Expansion by acquisition helped push net profit up a robust 66 percent in the third quarter for the Junior Market listed Mailpac, with the bottom line coming in at $114 million from $69 million in 2023. Nine months profits nevertheless declined by 10 percent to $183 million from $203 million in 2023, with revenues climbing a sharp 83 percent in the latest quarter to $732 million from $400 million in the prior year and 43 percent from $1.2 billion for the Nine months to September 2023 to $1.72 billion to September 2024.
 Cost of sales jumped 81 percent to $363.7 million in the 2024 third quarter from $200.8 million in 2023 and increased 46.2 percent to $895.5 million from $612.6 million for the nine months to September 2023.
Gross profit climbed 84.7 percent to $368.4 from $199.5 in the September quarter and increased 40 percent to $829 million in 2024 from $592 million for the nine months to September. Gross profit margin improved to 50.3 percent from 49.8 percent in the 2024 third quarter versus 2023 and 48.1 percent for the 2024 year to date from 49.1 percent in 2023.
Selling and Promotion Expenses for the nine months to September 2024 increased by 37 percent to $62.6 million versus $45.7 million to September 2023. For the September quarter, promotional expenses jumped 68.6 percent to $24 million from $14 million in 2023.
Administrative and General Expenses increased 71.3 percent for the nine months to September 2024 to $513 million compared with 2023 at $299 million and for the quarter it climbed 95 percent to $200 million from $103 million in 2023.
Profit before finance costs for the nine months ending September 2024 increased just 2.8 percent to $254 million from $247 million in 2023 and jumped 75 percent to $144 million from $83 million in 2023.
Finance costs jumped 59.5 percent to $71.8 million for the year to September 2024 from $45 million in 2023 and climbed 116 percent to $30 million from $14 million in 2023.
Cash Position rose to $254 million at the end of September 2024 compared to September 2023 at $138 million, helped by inflows from operations of $229 million before dividend payment of $67 million, working and other capital needs. $56 million was added to the $199 million on hand at the end of 2023. Shareholder’s Equity ended September 2024 at $807.6 million, up from September 2023 of $505.8 million. Equity includes $137 million relating to the acquisition of MyCart Express to be converted to shares as compensation for the acquisition of that operation. The exact conversion will be dependent on the performance of the acquired portfolio, up to March 2025.
Earnings per share for the latest quarter comes in at 5 cents, up from 3 cents last year and 7 cents for the nine months to September 2024 compared with 8 cents in 2023. Importantly, the acquisition and some changes to operations that contributed to increased profit are set to deliver higher profits in the future, accordingly, ICInsider.com projects 2024 earnings at 20 cents per share and 30 cents for 2025 and the company’s management seems optimistic about the immediate future.
“The performance of the third quarter has already started to show the expected results from the investments outlined in previous quarters. To date, we have been able to drive seamless integration of MyCart Express, the newly reorganized management team, and implement technological improvements to cut costs and drive innovation. As we continue to assess the strengths and competencies of the newly formed team and infrastructure, we anticipate significant synergistic benefits, enhanced revenue streams, operational efficiencies and increased shareholder value to result from emerging strategies. We are confident that the Company is strategically positioned for continued growth, industry leadership and sustained success in the evolving e-commerce landscape,” the Directors’ report to shareholders stated.
 Trading ended with an exchange of 12,282,549 shares at a value of $26,347,816 down from 15,379,999 stocks at $33,771,107 on Friday. Trading averaged 261,331 shares at $560,592 compared with 320,417 stocks at $703,565 on Friday, with the month to date ending with an average of 287,330 stock units at $783,503 compared with 288,806 stocks at $796,156 on the previous day and November that ended with an average of 309,920 shares at $766,307.
 The Junior Market ended trading with an average PE Ratio of 13.2, based on last traded prices in conjunction with
 Iron Rock Insurance popped 30 cents in closing at $3.89 with an exchange of 51 shares. KLE Group skidded 11 cents and ended at $1.14 with 47 stocks crossing the market, Knutsford Express sank 43 cents to finish at $13.76 after an exchange of 1,475 units, Lumber Depot rallied 25 cents to close at $2.90 after an exchange of 2,057,208 stocks. Mailpac Group dipped 14 cents to $2.65 as investors exchanged 23,546 shares, Medical Disposables shed 28 cents in closing at $1.62 after 20,257 stock units passed through the market, MFS Capital Partners shed 8 cents to end at 54 cents in an exchange of 274,061 stocks. Regency Petroleum rose 9 cents to close at $3.24 with investors trading 357,937 units and tTech gained 10 cents and ended at $2.10 with 4,000 stocks crossing the market.
 Prices of securities trading are those for the last transaction of each stock unless otherwise stated.
 At the close of the market, the JSE Combined Market Index climbed 1,935.02 points to 345,648.66, the All Jamaican Composite Index popped 3,267.33 points to wrap up trading at 385,401.92, the JSE Main Index rallied 1,719.39 points to finish at 333,199.47, the Junior Market Index jumped 40.56 points to close at 3,767.75 and the JSE USD Market Index dipped 2.88 points to close at 230.44.At the close of trading, 52,688,268 shares were exchanged by investors in all three markets, down from 59,254,946 units on Friday, with the value of stocks traded on the Junior and Main markets amounted to $182.88 million, down from $196.44 million on the previous day and the JSE USD market closed with an exchange of 195,047 shares for US$5,611 up from 32,270 units at US$3,513 on Friday.
 The market’s PE ratio, the most popular measure used to value stocks, ended at 14.2 based on 2024-25 projected earnings and 21 based on 2023-24 historical earnings. The ICInsider.com PE ratio chart and the other more detailed daily charts provide investors with regularly updated information to help in decision-making. The PE ratio chart covers all ordinary shares listed on Jamaica Stock Exchange, grouped by industry, allowing for easy comparisons within sectors and the overall market. The earnings per share (EPS) and PE ratios are based on 2024 and 2024 actual or projected earnings, excluding major one time income or expense.
 The net asset value of each company is incorporated into the chart. Investors can use this measure to assess stock values. The chart also shows daily changes in stock prices and the percentage year to date price movement based on the last traded prices. Dividends that are paid or are due to be paid and yields for each company are shown in the Main and Junior Markets’ daily report charts, along with the closing volume of the highest bid and the lowest offer for each company.
 The JSE Composite Index rose 10,029 points for a 3.11 percent gain for the week and 1.8 percent for the year to date, as the market takes on a more bullish tone, ahead of the close for the year.
 After dropping out of the Junior Market ICTOP10 last week, Image Plus returns, replacing Knutsford Express.
 In the Junior Market IC TOP10 are 12 stocks, 25 percent of the market, with PEs ranging from 15 to 33 with an average of 22 and a PE of 18 for half of the market with the highest PEs.
 The market closed with trading of 15,379,999 shares at $33,771,107 up from 5,903,831 stock units at $13,196,287 on Tuesday.
 The Junior Market ended trading with an average PE Ratio of 13.1, based on last traded prices in conjunction with earnings projected by ICInsider.com for the financial years ending around August 2025.
 Future Energy declined 8 cents in closing at $3.81 in trading 56,096 units, Indies Pharma sank 9 cents to close at $3.35 after an exchange of 29,194 stocks, Iron Rock Insurance climbed 8 cents to end at $3.59 after closing with an exchange of 3,861 stock units. Jamaican Teas rose 10 cents to $2.30 after 2,116,652 shares changed hands, Knutsford Express dropped 18 cents and ended at $14.19 with investors dealing in 1,530 stock units, Lasco Financial advanced 15 cents in closing at $1.65 with 205,756 stocks changing hands. Lumber Depot gained 15 cents to finish at $2.65 with an exchange of 3,452,486 units and Main Event fell 10 cents to close at $10.80 after trading 3,889 stocks.
 Prices of securities trading are those for the last transaction of each stock unless otherwise stated.

 The market’s PE ratio, the most popular measure used to value stocks, ended at 14.2 based on 2024-25 projected earnings and 21.2 based on 2023-24 historical earnings. The ICInsider.com PE ratio chart and other more detailed daily charts provide investors with regularly updated information to help decision-making. The PE ratio chart covers all ordinary shares on the Jamaica Stock Exchange, grouped by industry, allowing for easy comparisons within a sector and the overall market. The earnings per share (EPS) and PE ratios are based on 2024 and 2024 actual or projected earnings, excluding major one time income or expense.
 The net asset value of each company is incorporated into the chart. Investors can use this measure to assess stock values. The chart also shows daily changes in stock prices and the percentage year to date price movement based on the last traded prices. Dividends that are paid or are due to be paid and yields for each company are shown in the Main and Junior Markets’ daily report charts, along with the closing volume of the highest bid and the lowest offer for each company.
 Trading on the JSE USD market closed with an exchange of 32,183 shares for US$2,895 compared to 566,050 units at US$37,617 on Friday.
 The market’s PE ratio, the most popular measure used to value stocks, ended at 14 based on 2024-25 earnings and 20.6 based on 2023-24 historical earnings. The ICInsider.com PE ratio chart and other more detailed daily charts provide investors with regularly updated information to help decision-making. The PE ratio chart covers all ordinary shares on the Jamaica Stock Exchange, grouped by industry, allowing for easy comparisons within a sector and the overall market. The earnings per share (EPS) and PE ratios are based on 2024 and 2024 actual or projected earnings, excluding major one time income or expense.
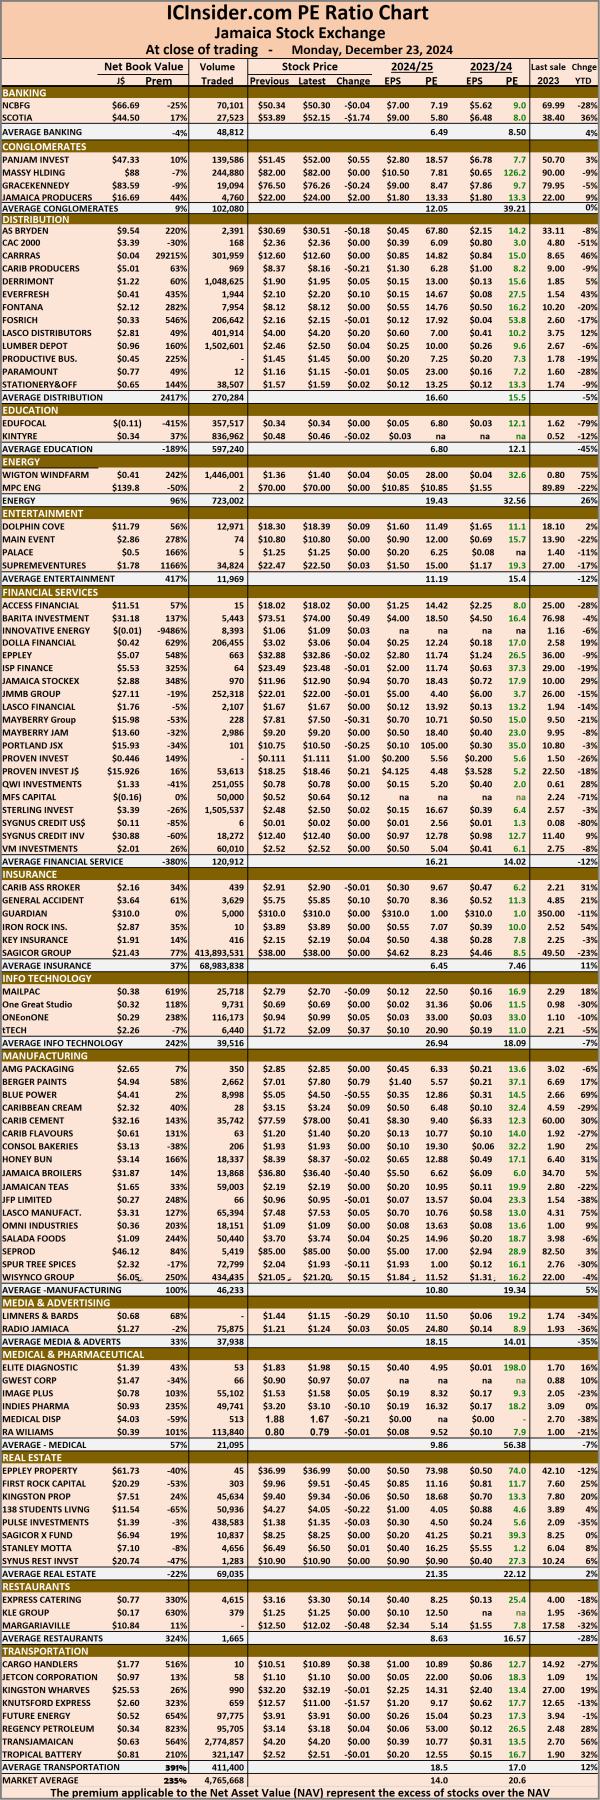 The net asset value of each company is incorporated into the chart. Investors can use these measures to assess stock values. The chart also shows daily changes in stock prices and the percentage year to date price movement based on the last traded prices. Dividends that are paid or are due to be paid and yields for each company are shown in the Main and Junior Markets’ daily report charts, along with the closing volume of the highest bid and the lowest offer for each company.
 The market closed with trading of 5,348,793 shares for $10,233,044 up from 2,338,924 stock units at $4,304,371 on Friday.
 The Junior Market ended trading with an average PE Ratio of 12.8, based on last traded prices in conjunction with earnings projected by ICInsider.com for financial years ending around August 2025.
 GWest Corporation climbed 7 cents to end at 97 cents with a transfer of 66 shares. Indies Pharma slid 10 cents in closing at $3.10 after the trading of 49,741 stocks, Knutsford Express skidded $1.57 to finish at $11 in an exchange of 659 units, Mailpac Group sank 9 cents and ended at $2.70 with investors trading 25,718 stock units. Medical Disposables shed 21 cents to $1.67 with 513 shares clearing the market, MFS Capital Partners rose 12 cents to end at 64 cents after a transfer of 50,000 units, Spur Tree Spices dropped 11 cents to $1.93 after 72,799 stocks passed through the market and tTech advanced 37 cents to close at $2.09 with an exchange of 6,440 stock units.
 Prices of securities trading are those for the last transaction of each stock unless otherwise stated.
 The week’s movement resulted in just one stock rising and seven falling in the Junior Market ICTOP10. In contrast to the Junior Market, only two stocks declined the Main Market TOP10 and six gained. The All JSE TOP10, compiled from all listed ordinary stocks on the JSE, has Guardian Holdings with the potential to rise 433 percent taking back the number one spot from Pulse Investments that held it last week and ended with the price jumping sharply, reducing its potential gains to 335 percent from 500 percent last week. Caribbean Cream replaced NCB Financial in the All JSE TOP10.
 In Main Market ICTOP10 activity, Pulse Investments recovering from a sharp fall in the previous week, jumped a solid 38 percent to $1.38, Key Insurance gained 8 percent after ending at $2.15, 138 Student Living gained 6 percent to close at $4.27 followed by Margaritaville and Scotia Group up 4 percent to $12.50 and $53.89 respectively. Berger Paints fell 10 percent to $7.01.
 In the Junior Market IC TOP10 are 13 stocks, 21 percent of the market, with PEs ranging from 15 to 31 with an average of 21 and a PE of 18 for half of the market with the highest PEs.
 The market closed with trading of 2,338,924 shares for $4,304,371 down from 4,463,393 stock units at $9,427,510 on Thursday.
 At the close, Access Financial increased 42 cents to $18.02 with investors trading just 152 shares, CAC 2000 popped 16 cents in closing at $2.36 following an exchange of 1,225 stocks, Cargo Handlers slipped 38 cents to close at $10.51 with a transfer of 450 shares. Caribbean Flavours fell 16 cents to end at $1.20 with 64,787 stock units crossing the exchange, as Derrimon Trading gained 7 cents and ended at $1.90 in trading 95,920 shares, Dolphin Cove rose 30 cents to finish at $18.30 after 30,562 stock units passed through the market. Elite Diagnostic sank 16 cents to $1.83 after a transfer of 10,000 units, Everything Fresh shed 10 cents to end at $2.10 with 22,356 stocks crossing the market, Express Catering lost 14 cents in closing at $3.16 with an exchange of 2,835 units. Fosrich climbed 10 cents to close at $2.16 with 256,386 stocks crossing the market, GWest Corporation skidded 7 cents and ended at 90 cents as investors exchanged 1,034 shares, Indies Pharma sank 19 cents to finish at $3.20 after closing with 57,854 stock units changing hands. ISP Finance climbed $3.52 to $23.49 with an exchange of 5 shares,
 Jamaican Teas rallied 7 cents and ended at $2.19 with investors dealing in 3,506 units, Kintyre Holdings rose 9 cents in closing at 48 cents in switching ownership of 511,162 stock units. Knutsford Express advanced $2.10 to close at $12.57 with investors swapping 5,365 stock units, Limners and Bards popped 16 cents to finish at $1.44 in an exchange of 20,140 shares, Main Event dipped 10 cents to end at $10.80 with 635 stock units clearing the market. Medical Disposables increased 18 cents to $1.88 in trading 62,929 stocks, Regency Petroleum climbed 14 cents to close at $3.14 after an exchange of 548 units and Spur Tree Spices gained 13 cents and ended at $2.04 with investors trading 104,282 stocks.
 Prices of securities trading are those for the last transaction of each stock unless otherwise stated.