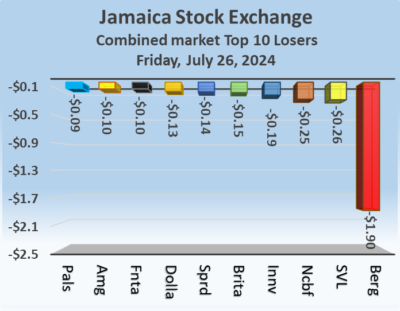
Rising stocks pushed the Main and Junior markets much higher at the close of the Jamaica Stock Exchange trading on Friday as the Market JSE USD market closed marginally lower as trading ended with the number of stocks changing hands falling, with the value of stocks traded jumping sharply over the previous trading day, resulting in prices of 38 shares rising and 26 declining.
 At the close of the market, the JSE Combined Market Index shot up 1,432.71 points to 327,489.18, the All Jamaican Composite Index rallied 1,682.41 points to 356,592.46, the JSE Main Index popped 1,044.59 points to 314,466.93. The Junior Market Index advanced a solid 61.06 points to end at 3,733.95 and the JSE USD Market Index dipped 0.70 points to close trading at 224.17.
At the close of trading, the volume of stocks traded jumped sharply to 28,434,606 shares in all three markets, well on the 19,944,044 units on Thursday, with the value of stocks traded on the Junior and Main markets amounted to $98.49 million, compared with $84.8 million on the previous trading day and the JSE USD market closed with an exchange of 47,268 shares for US$3,703 compared to 200,309 units at US$13,942 on Thursday.
In Main Market activity, Sagicor Select Financial Fund led trading with 5.81 million shares followed by Transjamaican Highway with 3.82 million stocks and Wisynco Group with 1.01 million units.
 In Junior Market trading, Jamaican Teas led trading with 4.20 million shares followed by Derrimon Trading with 3.87 million units and EduFocal with 1.42 million stock units.
In the preference segment, 138 Student Living preference share climbed $27.15 in closing at $155.25 and Sygnus Credit Investments C10.5% increased $7.98 to $107.98.
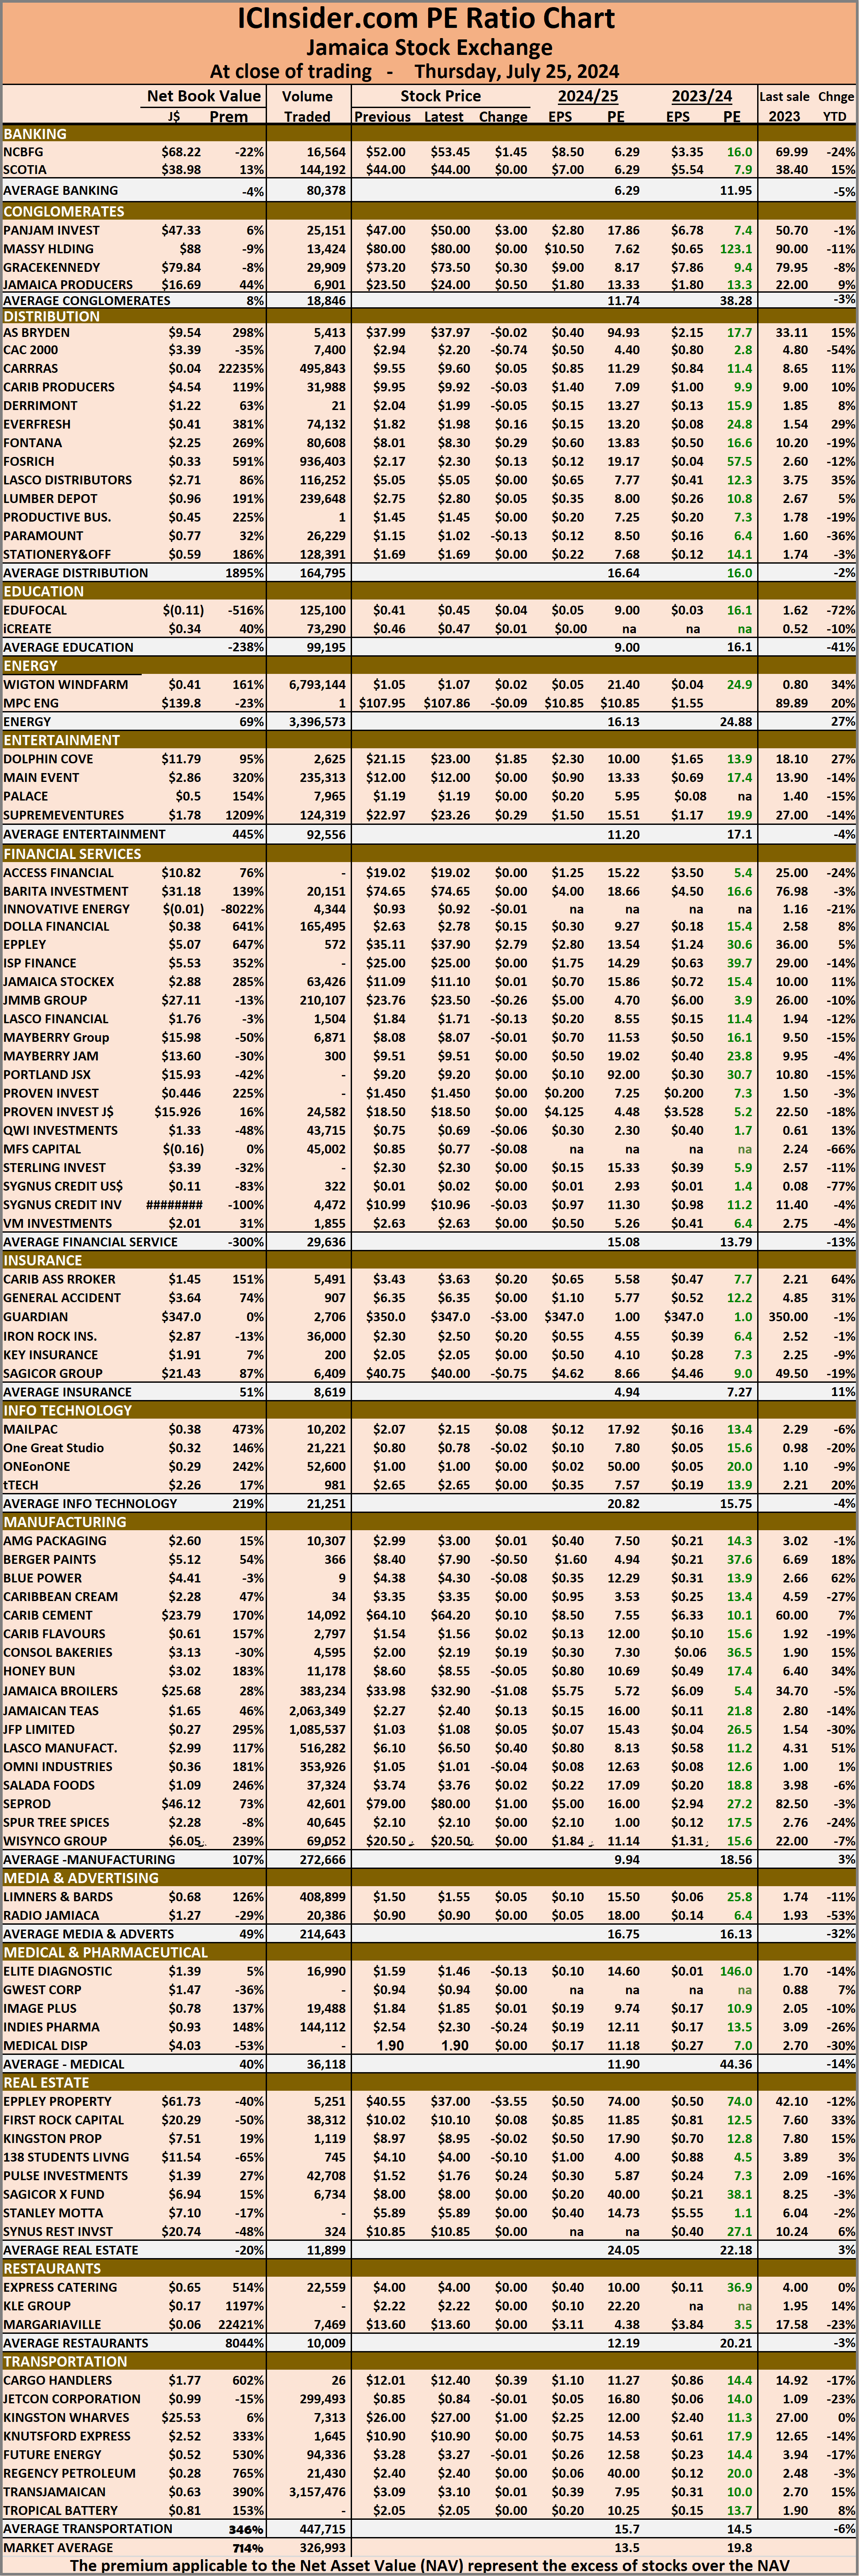
The market’s PE ratio, the most popular measure used to value stocks, ended at 20 on 2023-24 earnings and 13.7 times those for 2024-25 at the close of trading. ICInsider.com PE ratio chart and more detailed daily charts provide investors with regularly updated information to help decision-making.
The PE ratio chart covers all ordinary shares on the Jamaica Stock Exchange, grouped by industry, allowing for easy comparisons within a sector and the overall market. The EPS & PE ratios are based on 2023 and 2024 actual or projected earnings, excluding major one off items.
Pertinent information is required to navigate numerous investment options successfully in the stock market. The ICInsider.com PE ratio chart and more detailed daily charts provide investors with regularly updated information to help decision-making.
 The chart should be used in making rational decisions when investing in stocks close to the average for the sector, not going too far from it unless there are compelling reasons to do so. This approach helps to remove emotions from investment decisions and place them on fundamentals while at the same time not being too far from the majority of investors. Investors who buy when the price of a stock is close to the average will find that they are not inclined to overpay for a stock.
The net asset value of each company is incorporated into the chart. Investors can use this measure in assessing stock values. The chart also shows daily changes in stock prices and the percentage year to date price movement based on the last traded prices.
Dividends that are paid or are due to be paid and yields for each company are shown in the Main and Junior Markets’ daily report charts, along with the closing volume of the highest bid and the lowest offer for each company.
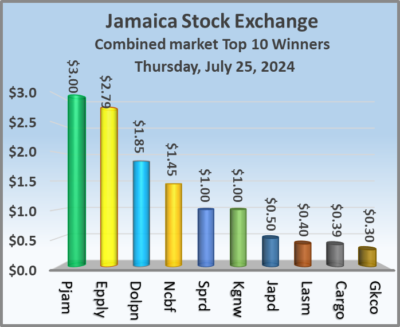
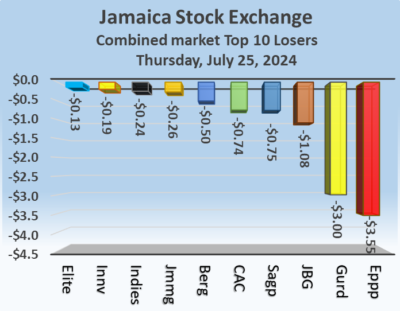
Main & Junior markets rise as trading climbs
The Main and Junior markets of the Jamaica Stock Exchange rose at the close of trading on Thursday as the JSE USD market closed moderately lower as trading ended with the number of stocks and the value changing hands rising over the previous day and resulting in prices of 36 shares rising and 30 declining.
 At the close of trading, the JSE Combined Market Index climbed 496.48 points to 326,056.47, the All Jamaican Composite Index rallied 1,667.39 points to 354,910.05, the JSE Main Index rose 358.22 points to 313,422.34. The Junior Market Index popped 21.67 points to 3,672.89 and the JSE USD Market Index fell 3.15 points to end trading at 224.87.
At the close of trading, 19,944,044 shares were exchanged in all three markets, up from 7,685,373 units on Wednesday, with the value of stocks traded on the Junior and Main markets amounted to $84.8 million, well over the $58.43 million on the previous trading day and the JSE USD market closed with an exchange of 200,309 shares for US$13,942 compared to 25,171 units at US$2,096 on Wednesday.
In Main Market activity, Wigton Windfarm led trading with 6.79 million shares followed by Transjamaican Highway with 3.16 million stocks and Lasco Manufacturing with 516,282 units.
In Junior Market trading, Jamaican Teas led trading with 2.06 million shares followed by JFP Ltd with 1.09 million units and Fosrich with 936,403 stocks.
In the preference segment, Jamaica Public Service 9.5% rallied $2 to $2,699.
 The market’s PE ratio, the most popular measure used to value stocks, ended at 19.8 on 2023-24 earnings and 13.5 times those for 2024-25 at the close of trading. ICInsider.com PE ratio chart and more detailed daily charts provide investors with regularly updated information to help decision-making.
The PE ratio chart covers all ordinary shares on the Jamaica Stock Exchange, grouped by industry, allowing for easy comparisons within a sector and the overall market. The EPS & PE ratios are based on 2023 and 2024 actual or projected earnings, excluding major one off items.
Pertinent information is required to navigate numerous investment options successfully in the stock market. The ICInsider.com PE ratio chart and more detailed daily charts provide investors with regularly updated information to help decision-making.
The chart should be used in making rational decisions when investing in stocks close to the average for the sector, not going too far from it unless there are compelling reasons to do so. This approach helps to remove emotions from investment decisions and place them on fundamentals while at the same time not being too far from the majority of investors. Investors who buy when the price of a stock is close to the average will find that they are not inclined to overpay for a stock.
 The net asset value of each company is incorporated into the chart. Investors can use this measure in assessing stock values. The chart also shows daily changes in stock prices and the percentage year to date price movement based on the last traded prices.
Dividends that are paid or are due to be paid and yields for each company are shown in the Main and Junior Markets’ daily report charts, along with the closing volume of the highest bid and the lowest offer for each company.
Trading drops on Jamaica Stocks Exchange
On another day of moderate activity, the Jamaica Stock Exchange, the volume and value of stocks traded fell well below Tuesday’s levels and resulted in the Main Market primary indices as the Junior Market and the JSE USD market recorded modest gains with the market closing with prices of 30 shares rising and 37 declining.
 At the close of the market, the JSE Combined Market Index fell 752.92 points to close at 325,559.99, the All Jamaican Composite Index slipped 1,518.48 points to 353,242.66, the JSE Main Index slipped 863.93 points to 313,064.12. The Junior Market Index rose 10.46 points to 3,651.22 and the JSE USD Market Index advanced 1.67 points to cease trading at 228.02.
At the close of trading, 7,685,373 shares were exchanged in all three markets, down from 22,053,861 units on Tuesday, with the value of stocks traded on the Junior and Main markets amounted to $58.43 million, well below the $86.67 million on the previous trading day and the JSE USD market closed with an exchange of 25,171 shares for US$2,096 compared to 484,869 units at US$42,958 on Tuesday.
In Main Market activity, Wisynco Group led trading with 2.21 million shares followed by Transjamaican Highway with 1.08 million stocks and Wigton Windfarm with 467,244 units.
In Junior Market trading, EduFocal led trading with 1.03 million shares followed by Dolla Financial with 460,385 stocks for 17.9 percent of the day’s trade and iCreate with just 202,733 units.
 In the preference segment, Sygnus Credit Investments C10.5 percent popped $9.04 to end at $100.
The market’s PE ratio, the most popular measure used to value stocks, ended at 19.8 on 2023-24 earnings and 13.4 times those for 2024-25 at the close of trading. ICInsider.com PE ratio chart and the more detailed daily charts provide investors with regularly updated information to help decision-making.
The PE ratio chart includes all of the ordinary shares on the Jamaica Stock Exchange, grouped by industry, allowing for easy comparisons within a sector and the overall market. The EPS & PE ratios are based on 2023 and 2024 actual or projected earnings, excluding major one off items.
Pertinent information is required to navigate numerous investment options successfully in the stock market. The ICInsider.com PE ratio chart and more detailed daily charts provide investors with regularly updated information to help decision-making.
The chart should be used in making rational decisions when investing in stocks close to the average for the sector, not going too far from it unless there are compelling reasons to do so. This approach helps to remove emotions from investment decisions and place them on fundamentals while at the same time not being too far from the majority of investors. 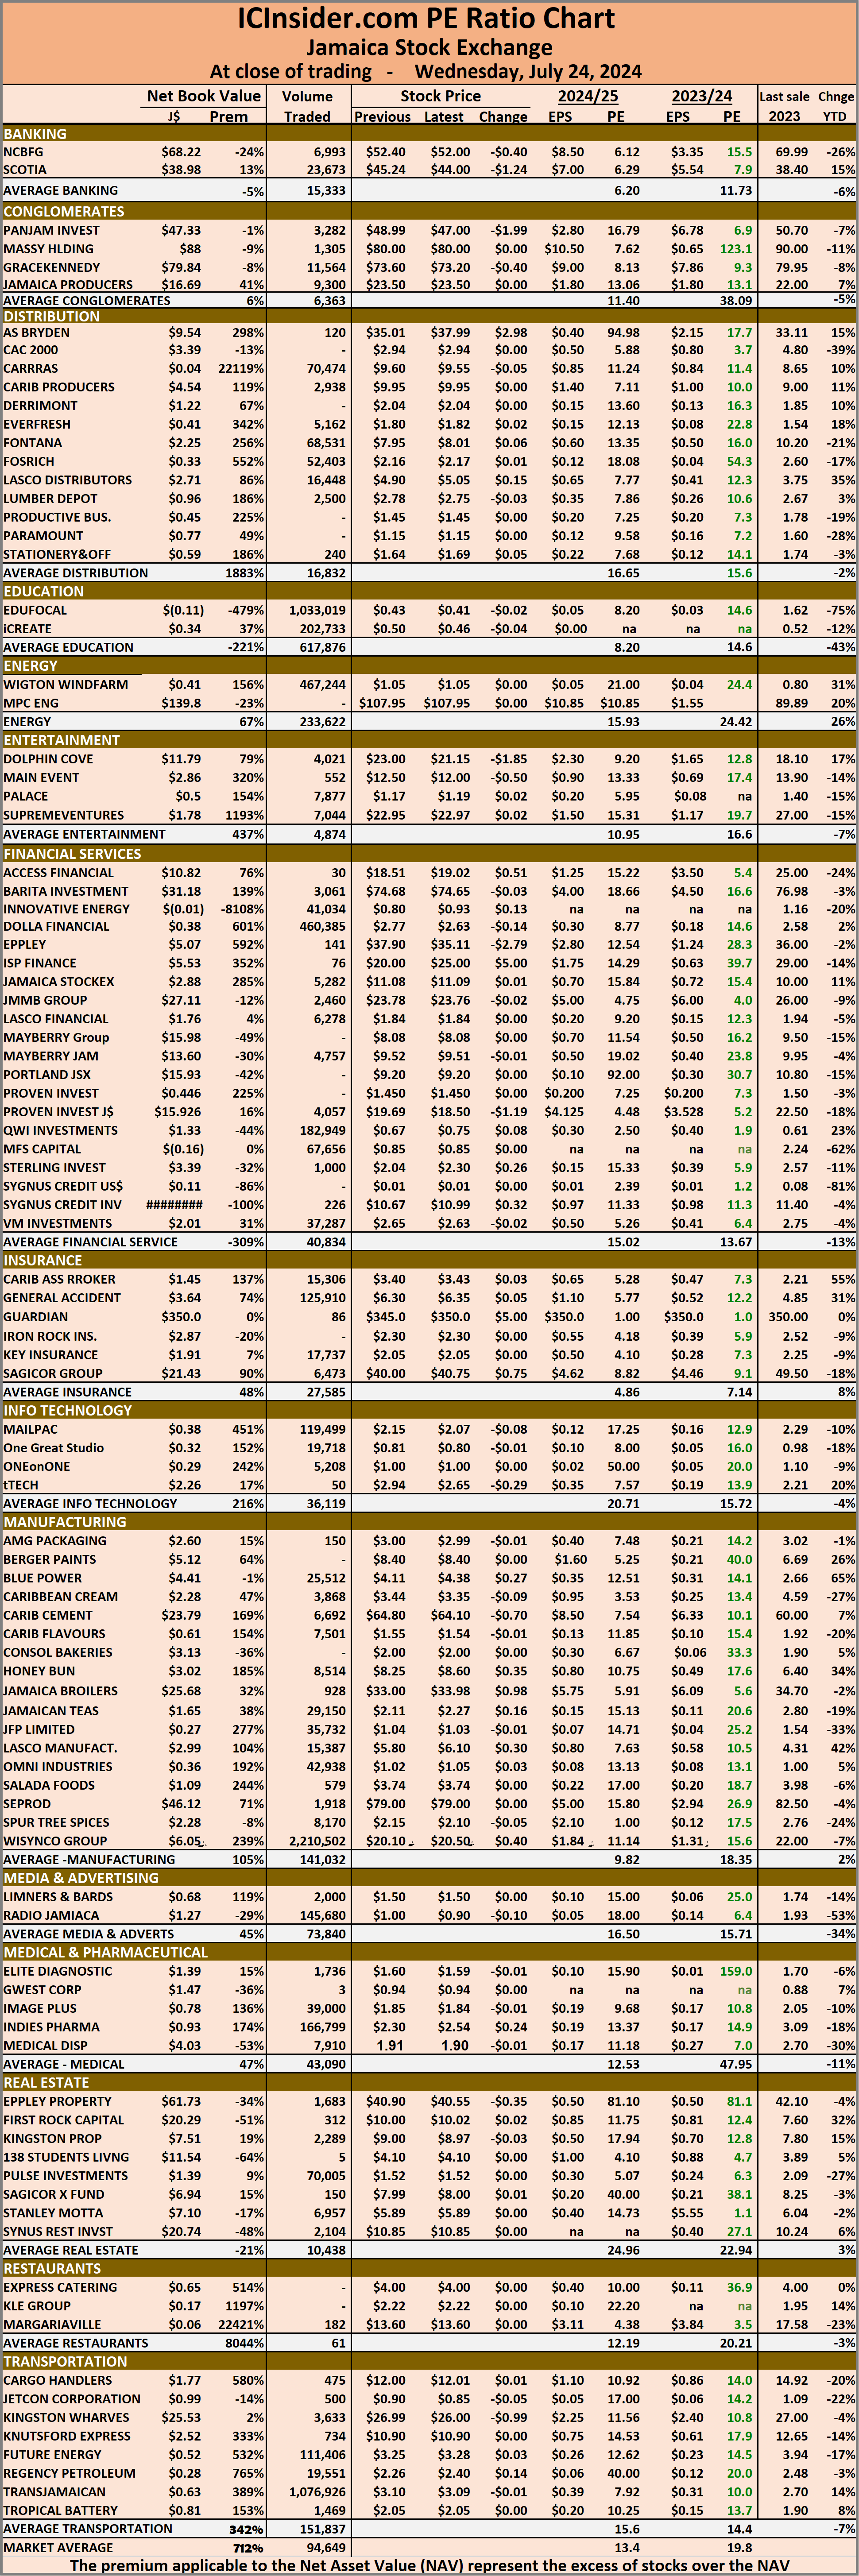 Investors who buy when the price of a stock is close to the average will find that they are not inclined to overpay for a stock.
The net asset value of each company is incorporated into the chart. Investors can use this measure in assessing stock values. The chart also shows daily changes in stock prices and the percentage year to date price movement based on the last traded prices.
Dividends that are paid or are due to be paid and yields for each company are shown in the Main and Junior Markets’ daily report charts, along with the closing volume of the highest bid and the lowest offer for each company.
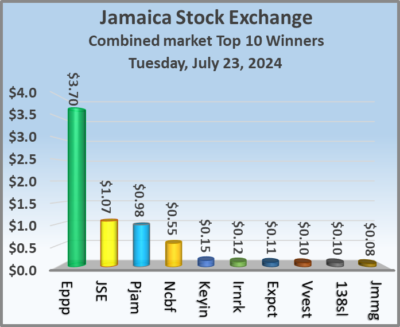
Main Market rises Junior & USD Markets fall
Trading picked up on the Jamaica Stock Exchange on Tuesday, with the volume of stocks changing hands climbing, with the value of stocks traded jumping sharply over the previous day and resulting in prices of just 18 shares rising and 44 declining, with the Main Market closing higher and the Junior and JSE USD markets closing lower.
 At the close of trading, the JSE Combined Market Index climbed 108.87 points to 326,312.91, the All Jamaican Composite Index rallied 1,008.75 points to 354,761.14, the JSE Main Index popped 338.01 points to close at 313,928.05. The Junior Market Index sank 30.30 points to close trading at 3,640.76 and the JSE USD Market Index slipped 0.44 points to 226.35.
At the close of trading, 22,053,861 shares were exchanged in all three markets, similar to 22,027,669 units on Monday, with the value of stocks traded on the Junior and Main markets amounted to $86.67 million, well over the $34.8 million on the previous trading day and the JSE USD market closed with an exchange of 484,869 shares for US$42,958 compared to 36,773 units at US$4,077 on Monday.
In Main Market activity, 138 Student Living led trading with 4.95 million shares followed by Wigton Windfarm with 2.52 million stock units and Transjamaican Highway with 850,644 units.
In Junior Market trading, JFP Ltd led trading with 2.40 million shares followed by EduFocal with 2.26 million stock units, Fontana ended with 1.72 million units and Dolla Financial with 1.03 million shares.
 In the preference segment, Sygnus Credit Investments C10.5% sank $16.04 and ended at $90.96.
The market’s PE ratio, the most popular measure used to value stocks, ended at 19.9 on 2023-24 earnings and 13.5 times those for 2024-25 at the close of trading. ICInsider.com PE ratio chart and more detailed daily charts provide investors with regularly updated information to help decision-making.
The PE ratio chart covers all ordinary shares on the Jamaica Stock Exchange, grouped by industry, allowing for easy comparisons within a sector and the overall market. The EPS & PE ratios are based on 2023 and 2024 actual or projected earnings, excluding major one off items.
Pertinent information is required to navigate numerous investment options successfully in the stock market. The ICInsider.com PE ratio chart and more detailed daily charts provide investors with regularly updated information to help decision-making.
The chart should be used in making rational decisions when investing in stocks close to the average for the sector, not going too far from it unless there are compelling reasons to do so. This approach helps to remove emotions from investment decisions and place them on fundamentals while at the same time not being too far from the majority of investors.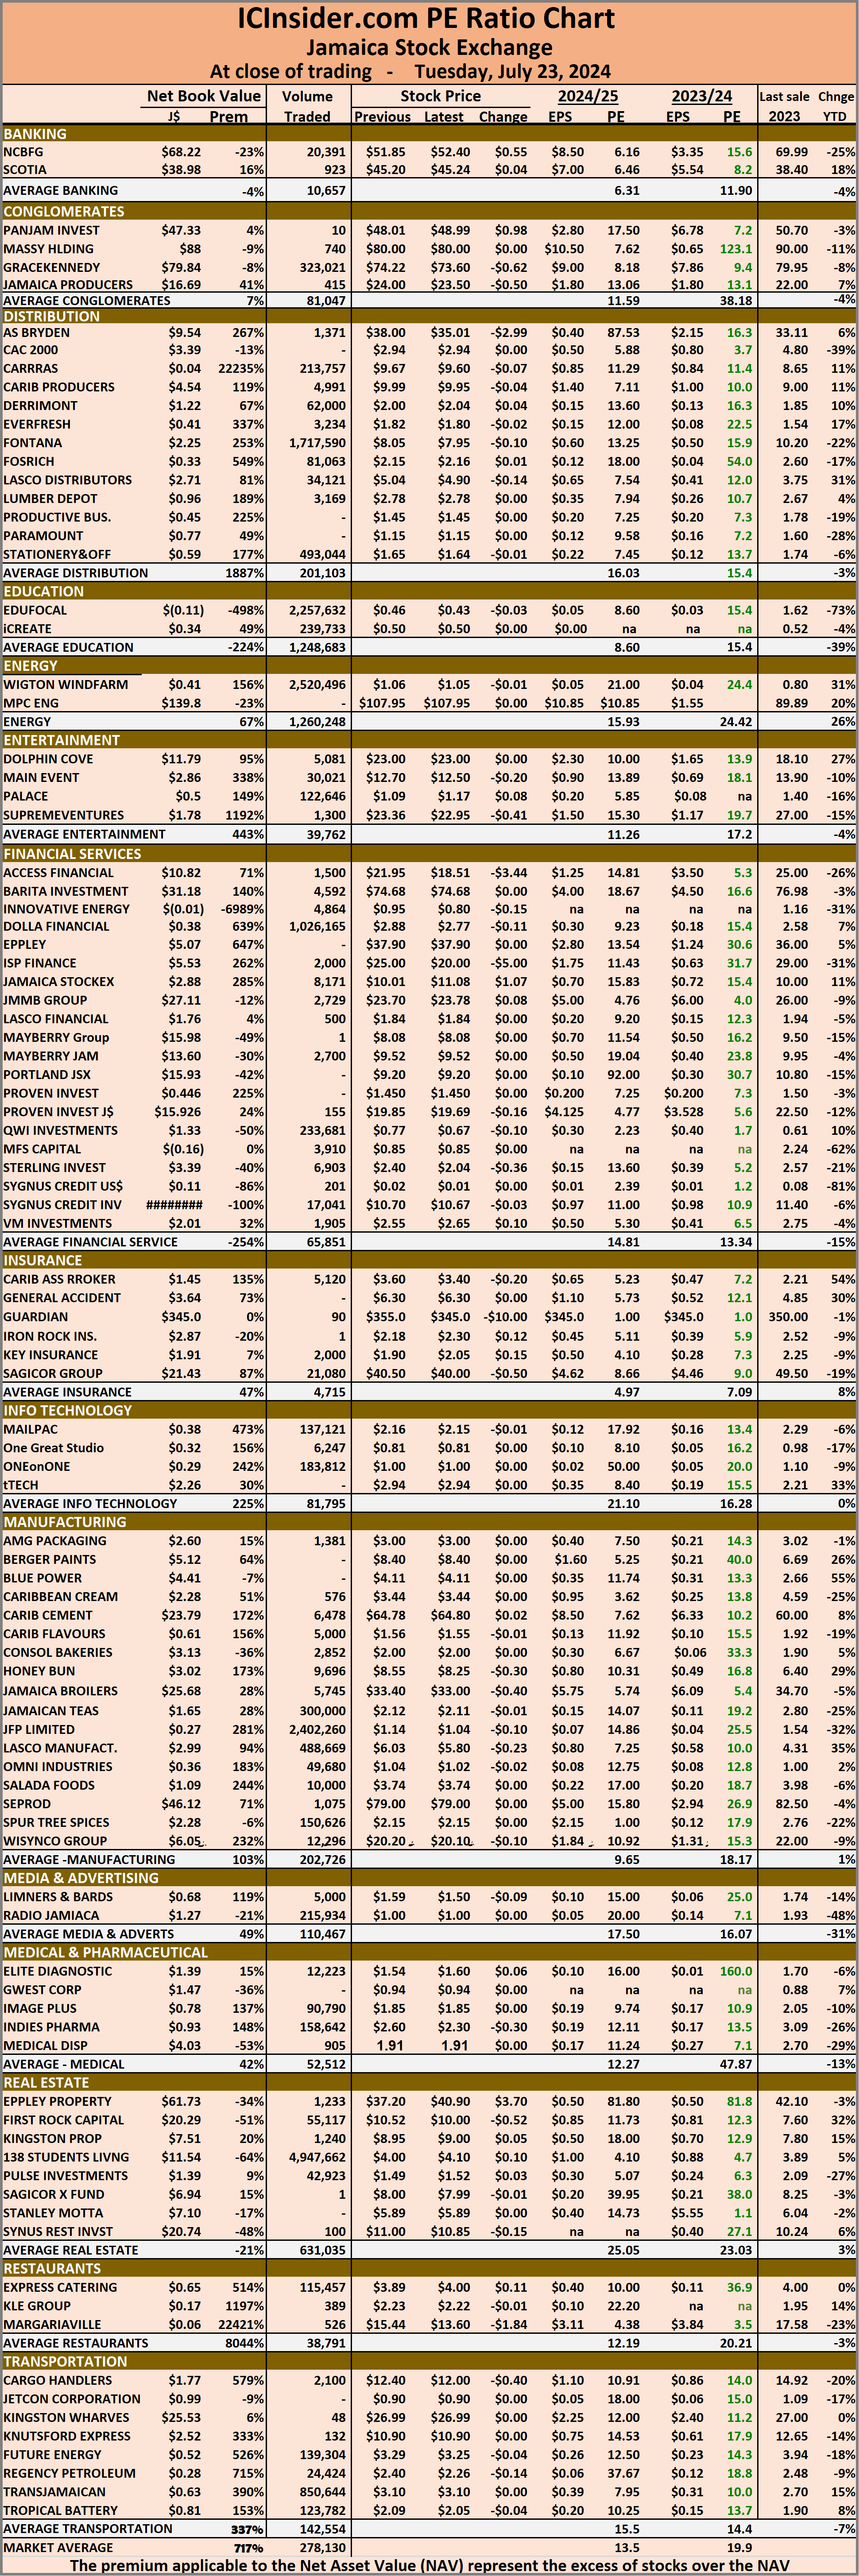 Investors who buy when the price of a stock is close to the average will find that they are not inclined to overpay for a stock.
The net asset value of each company is incorporated into the chart. Investors can use this measure in assessing stock values. The chart also shows daily changes in stock prices and the percentage year to date price movement based on the last traded prices.
Dividends that are paid or are due to be paid and yields for each company are shown in the Main and Junior Markets’ daily report charts, along with the closing volume of the highest bid and the lowest offer for each company.
Stocks bounce on Jamaica Stock Exchange
Stocks delivered gains in all three markets of the Jamaica Stock Exchange on Monday, with the Main Market and the Junior Market bouncing while the JSE USD market closed moderately higher as trading ended with the number and the value of stocks changing hands falling, from the previous trading day and resulting in prices of 45 shares rising and 27 declining.
 At the close of trading on Monday, the JSE Combined Market Index climbed 2,198.61 points to end at 326,204.04, the All Jamaican Composite Index rallied 1,831.79 points to 353,752.39, the JSE Main Index climbed 2,072.37 points to close at 313,590.04. The Junior Market Index bounced 30.31 points to end trading at 3,671.06 and the JSE USD Market Index rose 0.37 points to close at 226.79.
At the close of trading, 22,027,669 shares were exchanged in all three markets, down from 113,926,431 units on Friday, with the value of stocks traded on the Junior and Main markets amounted to $34.8 million, well below the $287.27 million on the previous trading day and the JSE USD market closed with an exchange of 36,773 shares for US$4,077 compared to 54,388 units at US$1,299 on Friday.
In Main Market activity, Palace Amusement led trading with 11.51 million shares followed by Sagicor Select Financial Fund with 2.05 million stocks and Transjamaican Highway with 1.43 million units.
In Junior Market trading, EduFocal led trading with 2.03 million shares followed by Dolla Financial with 957,337 stock units and JFP Ltd with 256,593 shares.
 In the preference segment, Jamaica Public Service 7% increased 92 cents to $47.34.
The market’s PE ratio, the most popular measure used to value stocks, ended at 20 on 2023-24 earnings and 13.7 times those for 2024-25 at the close of trading. ICInsider.com PE ratio chart and more detailed daily charts provide investors with regularly updated information to help decision-making.
The PE ratio chart covers all ordinary shares on the Jamaica Stock Exchange, grouped by industry, allowing for easy comparisons within a sector and the overall market. The EPS & PE ratios are based on 2023 and 2024 actual or projected earnings, excluding major one off items.
Pertinent information is required to navigate numerous investment options successfully in the stock market. The ICInsider.com PE ratio chart and more detailed daily charts provide investors with regularly updated information to help decision-making.
The chart should be used in making rational decisions when investing in stocks close to the average for the sector, not going too far from it unless there are compelling reasons to do so. This approach helps to remove emotions from investment decisions and place them on fundamentals while at the same time not being too far from the majority of investors. 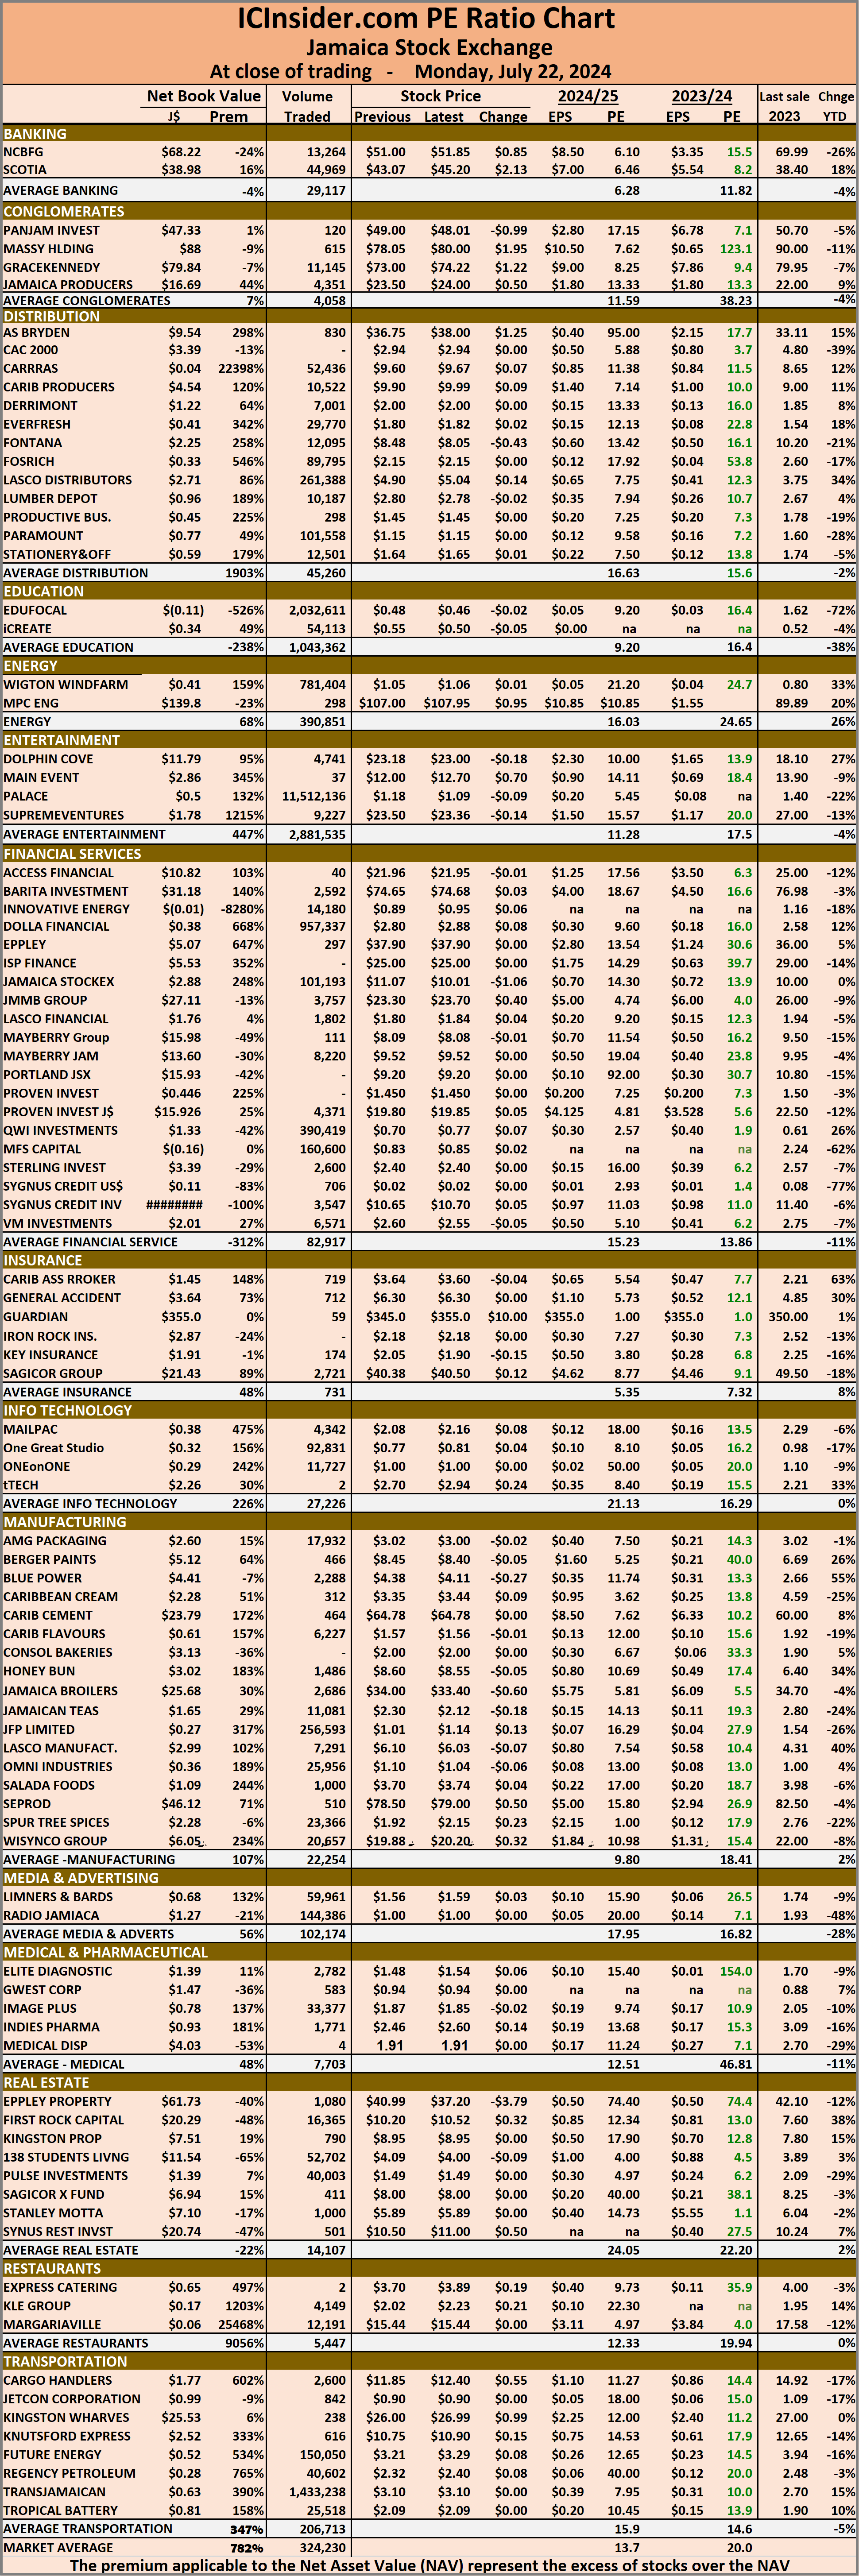 Investors who buy when the price of a stock is close to the average will find that they are not inclined to overpay for a stock.
The net asset value of each company is incorporated into the chart. Investors can use this measure in assessing stock values. The chart also shows daily changes in stock prices and the percentage year to date price movement based on the last traded prices.
Dividends that are paid or are due to be paid and yields for each company are shown in the Main and Junior Markets’ daily report charts, along with the closing volume of the highest bid and the lowest offer for each company.
Dolla dominates all JSE markets
Dolla Financial dominated trading on Friday with an exchange of 103 million shares before the release of positive six months results, with profit rising by 25 percent for the period and nearly 37 percent for the June quarter. All three Jamaica Stock Exchange markets lost ground at the end of trading, resulting in the number and value of stocks changing hands rising over the previous with prices of 29 shares rising and 29 declining.
 At the close of trading, the JSE Combined Market Index dropped 1,481.77 points to 324,005.43, the All Jamaican Composite Index fell 943.02 points to 351,920.60. The JSE Main Market Index declined by 1,235.60 points to end at 311,517.67. The Junior Market Index dropped 42.17 points to 3,640.75 and the JSE USD Market Index slipped 0.63 to close at 226.42.
At the close of trading, 113,926,431 shares were exchanged in all three markets, up from 10,033,070 units on Thursday, with the value of stocks traded on the Junior and Main markets amounted to $287.27 million, versus $281.88 million on the previous trading day and the JSE USD market closed with an exchange of 54,388 shares for US$1,299 compared to 243,125 units at US$8,678 on Thursday.
In Main Market activity, Transjamaican Highway led trading with 3.24 million shares followed by Wigton Windfarm with 1.70 million stocks and Sagicor Select Financial Fund with 1.0 million units.
In Junior Market trading, Dolla Financial led trading with 102.78 million shares followed by Omni Industries with 1.05 million stocks and Jamaican Teas with 890,611 units.
 In the preference segment, Jamaica Public Service 7% rose $4.42 to end at $46.42, 138 Student Living preference share advanced 74 cents to $128.10 and Sygnus Credit Investments C10.5% increased $5 and ended at $107.
The market’s PE ratio, the most popular measure used to value stocks, ended at 19.7 on 2023-24 earnings and 13.6 times those for 2024-25 at the close of trading. ICInsider.com PE ratio chart and more detailed daily charts provide investors with regularly updated information to help decision-making.
The PE ratio chart covers all ordinary shares on the Jamaica Stock Exchange, grouped by industry, allowing for easy comparisons within a sector and the overall market. The EPS & PE ratios are based on 2023 and 2024 actual or projected earnings, excluding major one off items.
Pertinent information is required to navigate numerous investment options successfully in the stock market. The ICInsider.com PE ratio chart and more detailed daily charts provide investors with regularly updated information to help decision-making.
The chart should be used in making rational decisions when investing in stocks close to the average for the sector, not going too far from it unless there are compelling reasons to do so. This approach helps to remove emotions from investment decisions and place them on fundamentals while at the same time not being too far from the majority of investors. 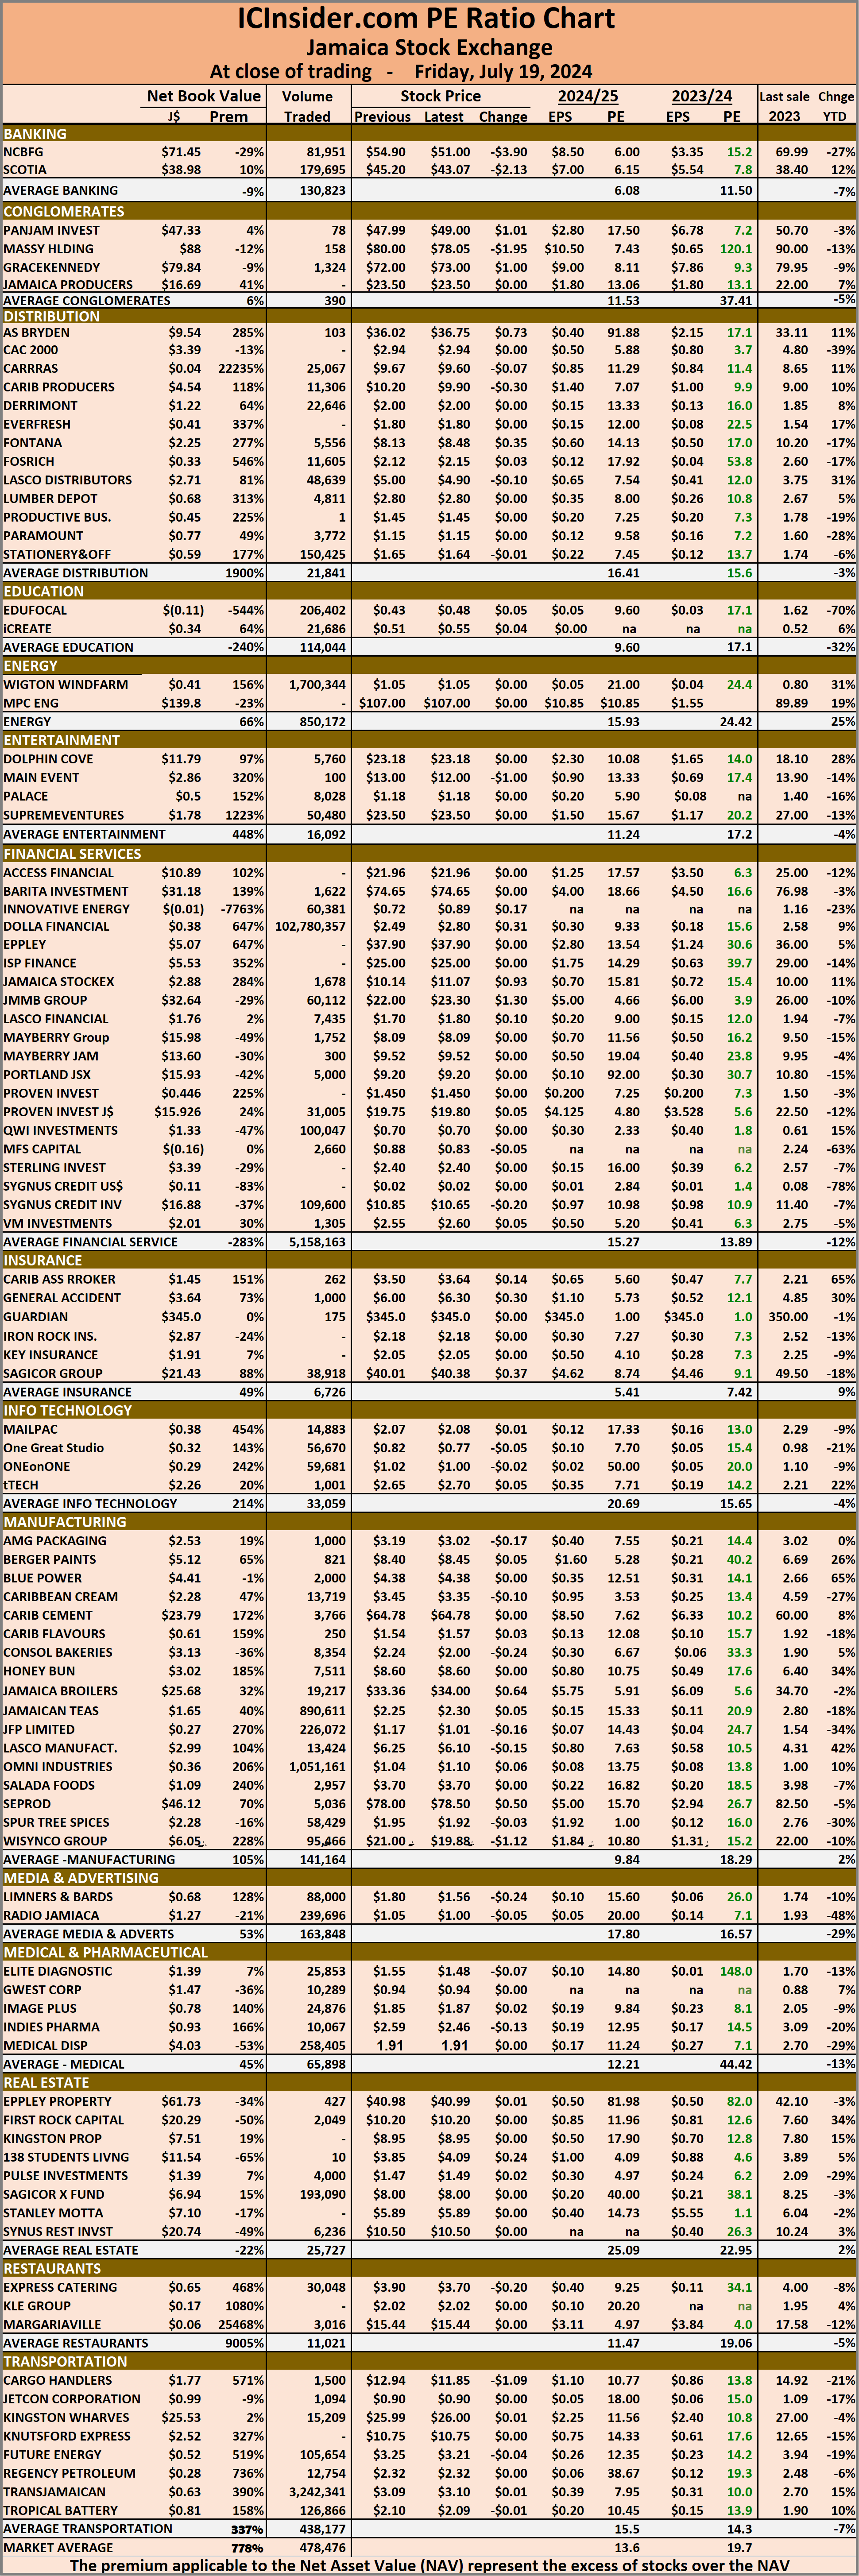 Investors who buy when the price of a stock is close to the average will find that they are not inclined to overpay for a stock.
The net asset value of each company is incorporated in the chart. Investors can use this measure as a guide to easily assess the value of stocks. The chart also shows daily changes in stock prices and the percentage year to date price movement based on the last traded prices.
Dividends that are paid or are due to be paid and yields for each company are shown in the Main and Junior Markets’ daily report charts, along with the closing volume of the highest bid and the lowest offer for each company.
GraceKennedy dominates trading on JSE markets
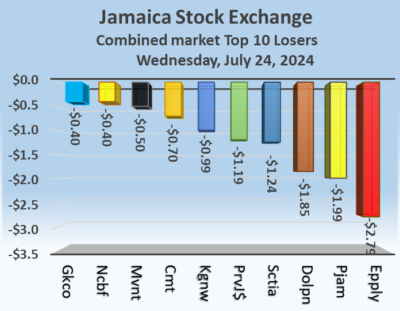
GraceKennedy lead trading on the Jamaica Stock Exchange jumped sharply on Thursday, accounting for just over $249 million of the total value of stocks traded, resulting in fewer shares being traded in all markets. The market closed with more stock prices declining than rising, resulting in a sharp decline in the Junior Market index and a drop in the Main Market major indices. The JSE USD market closed marginally lower as trading ended with the number of stocks changing hands falling, with the value of stocks traded jumping sharply over the previous day, resulting in prices of 26 shares rising and 40 declining.
 At the close of trading, the JSE Combined Market Index fell 1,306.76 points to close at 325,487.20, the All Jamaican Composite Index skidded 1,215.46 points to finish at 352,863.62. The JSE Main Index sank by 860.58 points to close at 312,753.36. The Junior Market Index dropped 68.15 points to close at 3,682.92 and the JSE USD Market Index slipped 0.03 points to conclude trading at 227.05.
At the close of trading, with just 10,033,070 shares being exchanged in all three markets, down from 33,083,446 units on Wednesday, with the value of stocks traded on the Junior and Main markets amounted to $281.88 million, well over the $178.27 million on the previous trading day and the JSE USD market closed with an exchange of 243,125 shares for US$8,678 down from 514,418 units at US$11,601 on Wednesday.
In Main Market activity, GraceKennedy led trading with 3.45 million shares followed by Wigton Windfarm with 1.10 million units for 15.5 percent of the day’s trade and Transjamaican Highway with 990,119 units.
In Junior Market trading, Stationery and Office Supplies led trading with 824,225 shares followed by Fosrich with 328,942 stocks and Dolla Financial with 316,992 units.
 In the preference segment, Eppley 7.25% preference share gained $2.79 and ended at $19.80, Jamaica Public Service 7% sank $5.34 in closing at $42 and 138 Student Living preference share lost $12.64 to end at $127.36.
The market’s PE ratio, the most popular measure used to value stocks, ended at 20.1 on 2023-24 earnings and 13.7 times those for 2024-25 at the close of trading. ICInsider.com PE ratio chart and more detailed daily charts provide investors with regularly updated information to help decision-making.
The PE ratio chart covers all ordinary shares on the Jamaica Stock Exchange, grouped by industry, allowing for easy comparisons within a sector and the overall market. The EPS & PE ratios are based on 2023 and 2024 actual or projected earnings, excluding major one off items.
Pertinent information is required to navigate numerous investment options successfully in the stock market. The ICInsider.com PE ratio chart and more detailed daily charts provide investors with regularly updated information to help decision-making.
The chart should be used in making rational decisions when investing in stocks close to the average for the sector, not going too far from it unless there are compelling reasons to do so. This approach helps to remove emotions from investment decisions and place them on fundamentals while at the same time not being too far from the majority of investors.  Investors who buy when the price of a stock is close to the average will find that they are not inclined to overpay for a stock.
The net asset value of each company is reported. Investors can use this measure as a guide to easily assess the value of stocks. The chart also shows daily changes in stock prices and the percentage year to date price movement based on the last traded prices.
Dividends paid or payable and yields for each company are shown in the Main and Junior Markets’ daily report charts, along with the closing volume of the highest bid and the lowest offer for each company.
Rising stocks push Jamaica Stock Exchange higher
Rising stocks sent the Jamaica Stock Exchange higher in trading on Wednesday, with the Main and Junior markets rising. The JSE USD market closed moderately lower as trading ended with the number and value of stocks changing hands jumping, sharply over the previous trading day, resulting in prices of just 23 shares rising and 48 declining.
 At the close of trading, the JSE Combined Market Index rose 680.60 points to 326,793.96, the All Jamaican Composite Index rallied 1,371.83 points to 354,079.08, the JSE Main Index popped 497.17 points to settle at 313,613.94. The Junior Market Index rallied 28.88 points to 3,751.07 and the JSE USD Market Index slipped 0.14 points to cease trading at 227.08.
At the close of trading, 33,083,446 shares were exchanged in all three markets, up from 11,572,254 units on Tuesday, with the value of stocks traded on the Junior and Main markets amounted to $178.27 million, well above the $35.47 million on the previous trading day and the JSE USD market closed with an exchange of 514,418 shares for US$11,601 compared to 123,275 units at US$3,408 on Tuesday.
In Main Market activity, Transjamaican Highway led trading with 18.71 million shares followed by Lasco Distributors with 2.72 million stock units, Jamaica Broilers was next with 1.48 million shares and Wigton Windfarm with 1.17 million units.
In Junior Market trading, EduFocal led trading with 1.75 million shares followed by Stationery and Office Supplies with 1.07 million stock units and Dolla Financial with 731,534 shares.
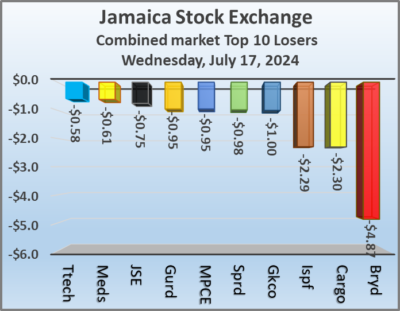 In the preference segment, 138 Student Living preference share nosedived by $54.50 to finish at $140.
The market’s PE ratio, the most popular measure used to value stocks, ended at 20.2 on 2023-24 earnings and 13.7 times those for 2024-25 at the close of trading. ICInsider.com PE ratio chart and more detailed daily charts provide investors with regularly updated information to help decision-making.
The PE ratio chart covers all ordinary shares on the Jamaica Stock Exchange, grouped by industry, allowing for easy comparisons within a sector and the overall market. The EPS & PE ratios are based on 2023 and 2024 actual or projected earnings, excluding major one off items.
Pertinent information is required to navigate numerous investment options successfully in the stock market. The ICInsider.com PE ratio chart and more detailed daily charts provide investors with regularly updated information to help decision-making.
The chart should be used in making rational decisions when investing in stocks close to the average for the sector, not going too far from it unless there are compelling reasons to do so. This approach helps to remove emotions from investment decisions and place them on fundamentals while at the same time not being too far from the majority of investors. 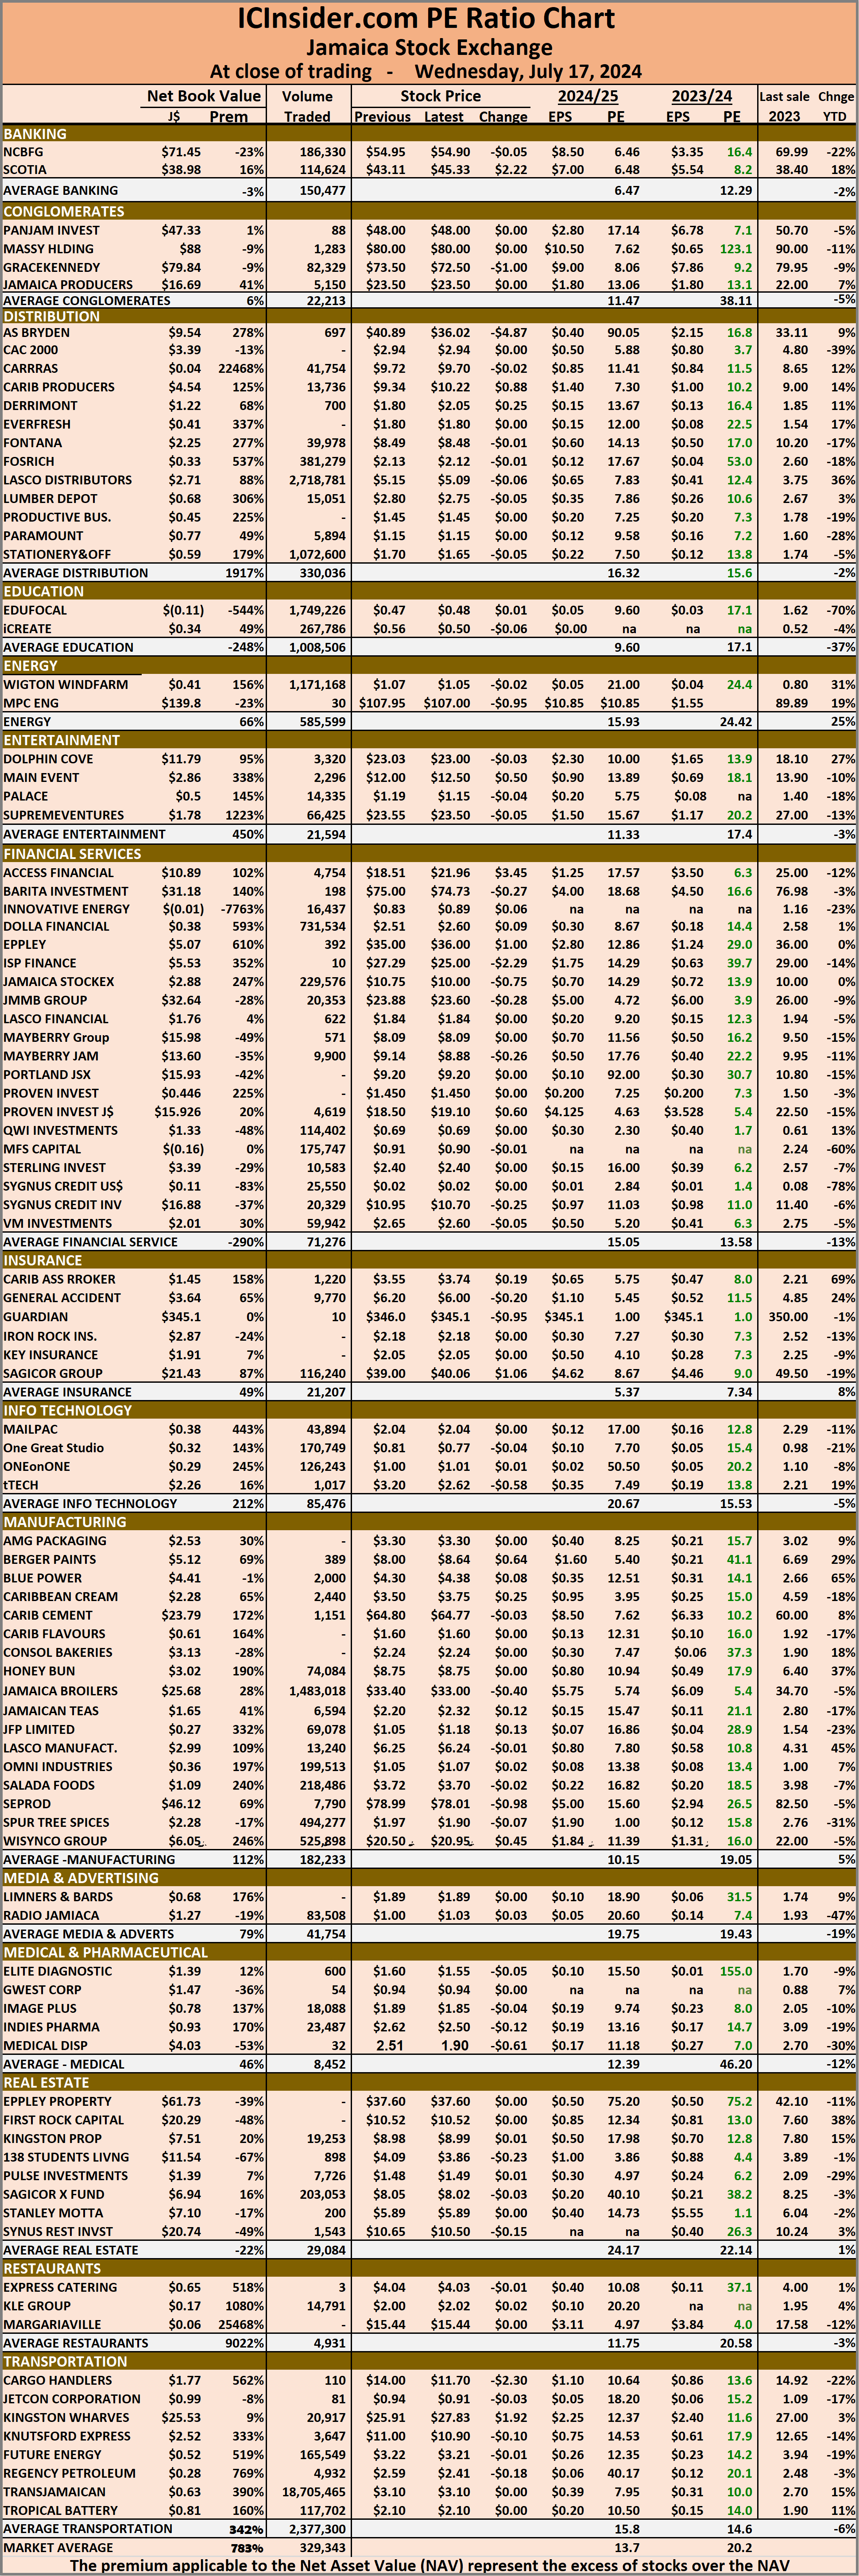 Investors who buy when the price of a stock is close to the average will find that they are not inclined to overpay for a stock.
The net asset value of each company is reported as a guide for investors to quickly assess the value of stocks based on this measure. The chart also shows daily changes in stock prices and the percentage year to date price movement based on the last traded prices.
Dividends paid or payable and yields for each company are shown in the Main and Junior Markets’ daily report charts, along with the closing volume of the highest bid and the lowest offer for each company.
Depressed trading on JSE markets
The Junior Market of the Jamaica Stock Exchange rose at the close of trading on Tuesday as the Main Market dropped and JSE USD market closed modestly higher as trading ended with the number of stocks changing hands falling, with the value of stocks traded jumping sharply over the previous trading day, resulting in prices of 30 shares rising and 34 declining that included several heavily weighted Main Market stocks.
 At the close of trading, the JSE Combined Market Index dropped 3,029.58 points to 326,113.36, the All Jamaican Composite Index dived 4,372.87 points to end at 352,707.25, the JSE Main Index sank 3,334.60 points to close trading at 313,116.77. The Junior Market Index climbed 22.93 points to 3,722.19 and the JSE USD Market Index rallied 0.85 points to 227.22.
At the close of trading, 11,572,254 shares were exchanged in all three markets, up from 8,691,048 units on Monday, with the value of stocks traded on the Junior and Main markets amounted to $35.47 million, well below the $40.09 million on the previous trading day and the JSE USD market closed with an exchange of 123,275 shares for US$3,408 compared to 243,637 units at US$6,654 on Monday.
In Main Market activity, Transjamaican Highway led trading with 1.93 million shares followed by Wigton Windfarm with 1.56 million stocks and Sagicor Select Financial Fund with 1.06 million units.
In Junior Market trading, JFP Ltd led trading with 1.75 million shares followed by Jamaican Teas with 950,471 stocks for and ONE on ONE Educational with 496,370 units.
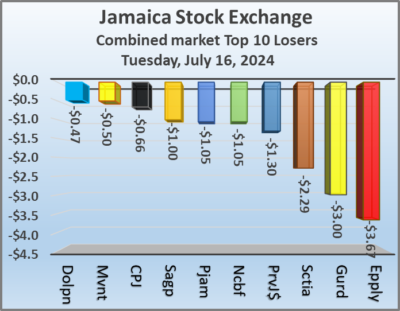 In the preference segment, Eppley 7.25% preference share dropped $3.98 to end at $17.01, Jamaica Public Service 9.5% fell $2 in closing at $2,697 and 138 Student Living preference share gained $24.50 to close at $194.50.
The market’s PE ratio, the most popular measure used to value stocks, ended at 20.4 on 2023-24 earnings and 13.9 times those for 2024-25 at the close of trading. ICInsider.com PE ratio chart and more detailed daily charts provide investors with regularly updated information to help decision-making.
The PE ratio chart covers all ordinary shares on the Jamaica Stock Exchange, grouped by industry, allowing for easy comparisons within a sector and the overall market. The EPS & PE ratios are based on 2023 and 2024 actual or projected earnings, excluding major one off items.
Pertinent information is required to navigate numerous investment options successfully in the stock market. The ICInsider.com PE ratio chart and more detailed daily charts provide investors with regularly updated information to help decision-making.
The chart should be used in making rational decisions when investing in stocks close to the average for the sector, not going too far from it unless there are compelling reasons to do so. This approach helps to remove emotions from investment decisions and place them on fundamentals while at the same time not being too far from the majority of investors. 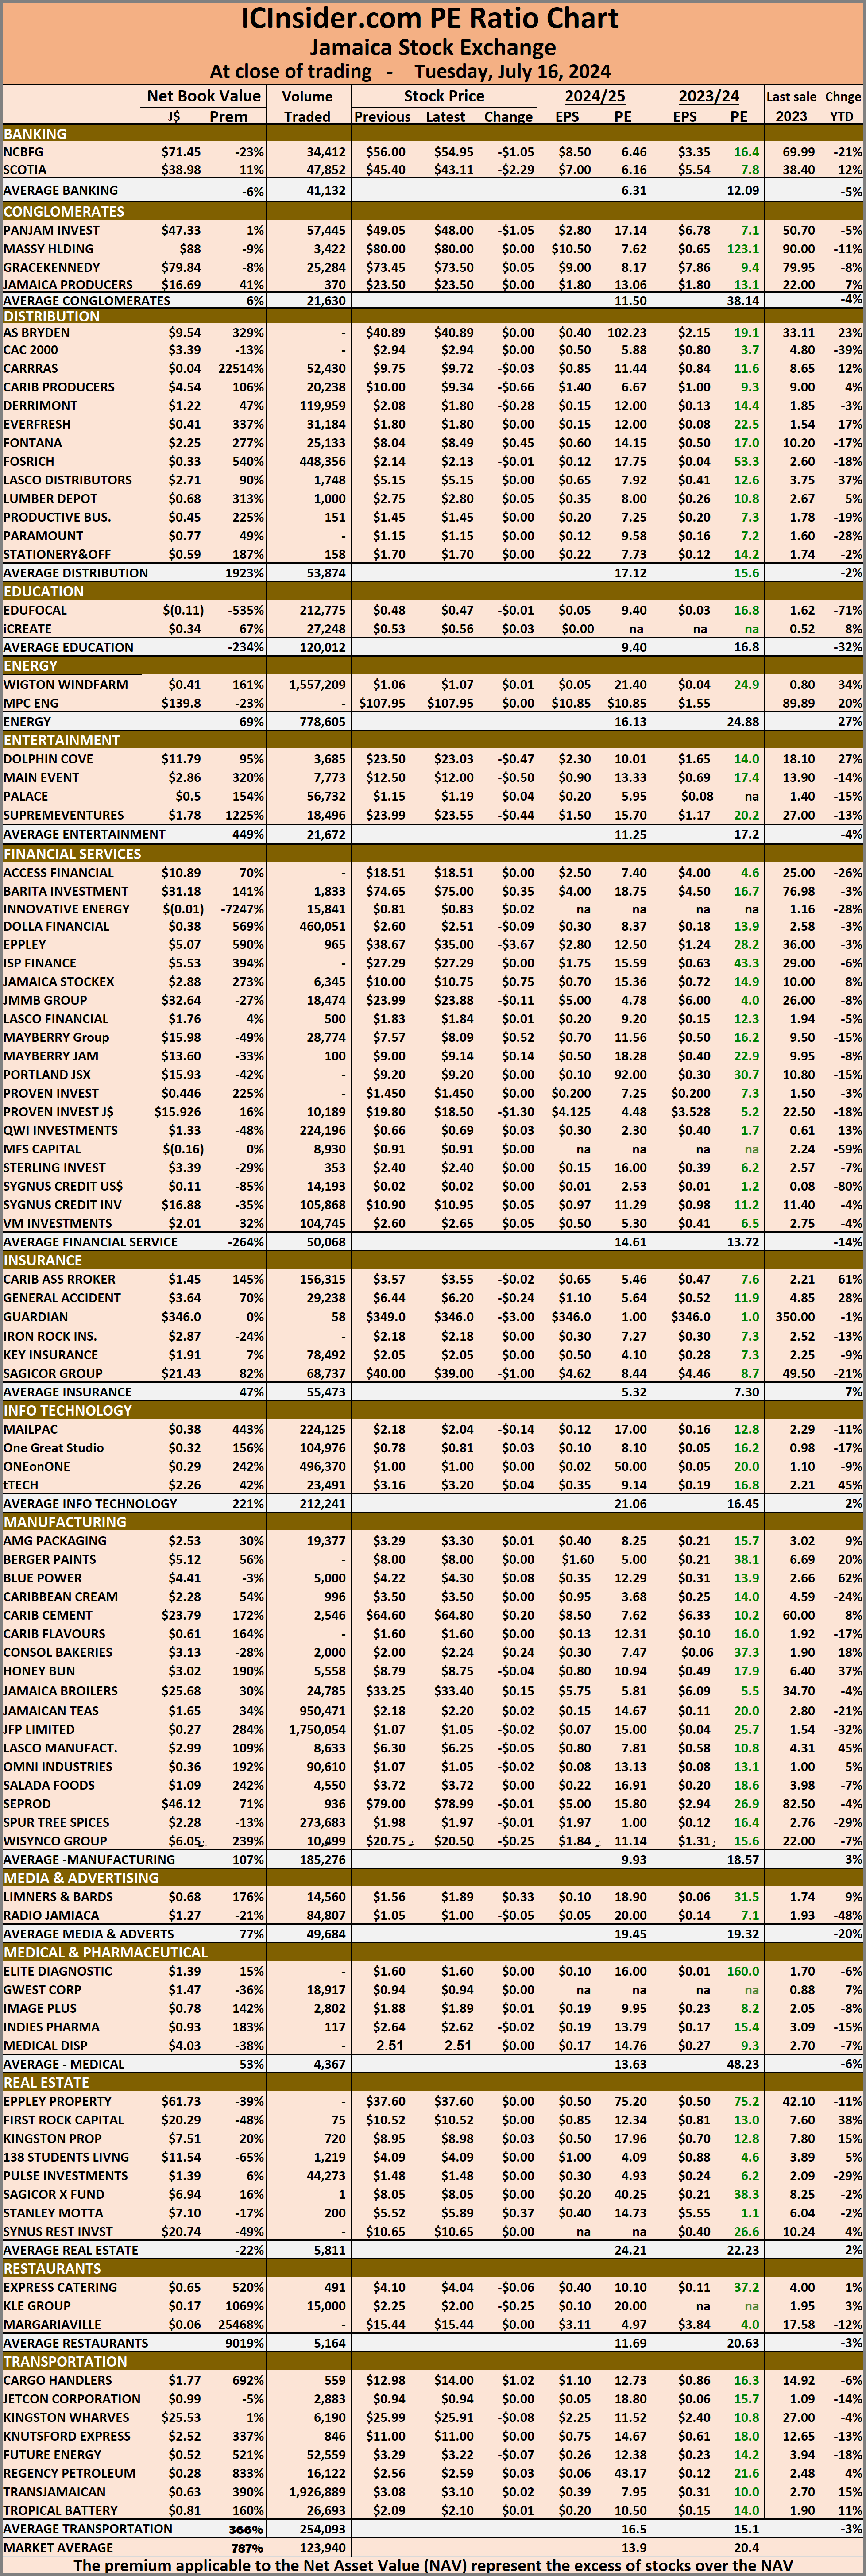 Investors who buy when the price of a stock is close to the average will find that they are not inclined to overpay for a stock.
The net asset value of each company is reported as a guide for investors to assess the value of stocks. The chart also shows daily changes in stock prices and the percentage year to date price movement based on the last traded prices.
Dividends paid or payable and yields for each company are shown in the Main and Junior Markets’ daily report charts, along with the closing volume of the highest bid and the lowest offer for each company.
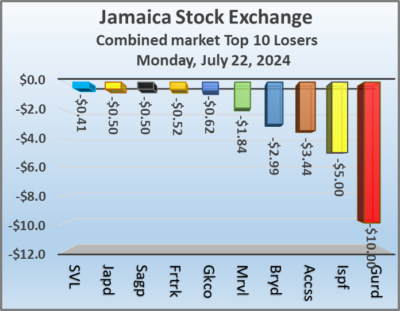
tTech jumps 26% as Junior & Main Market falter
Shareholders in the Junior Market listed tTech grabbed a massive 26 percent gain as the stock closed at a 52 weeks’ high of $3.16 and seemed poised to gain more, with only three offers posted to sell the stock between $3.56 and $6 just ahead of the close of the market on Monday, but closed with just two offers at $4.05 and above. tTech gains did little to ease the pain of the Junior Market as a drop in the average price of the heavily weighted Derrimon Trading and a near $2 drop in Access Financial helped to pull the market down.
The Main Market of the Jamaica Stock Exchange declined in trading on Monday as the JSE USD popped moderately to close out the day as 31 stocks recorded gains and 40 losses.
At the close of trading, the JSE Combined Market Index dropped 2,504.04 points to 329,142.94, the All Jamaican Composite Index slipped 610.00 points to 357,080.12, the JSE Main Index dropped 2,446.38 points to 316,451.37. The Junior Market Index fell 22.89 points to 3,699.26 and the JSE USD Market Index popped 1.43 points to close at 226.37.
On a day of disappointed trading activities, a total of 8,691,048 shares were exchanged in all three markets, up from 33,157,102 units on Friday, with the value of stocks traded on the Junior and Main markets amounted to $40.09 million, well below the $63.58 million on the previous trading day and the JSE USD market closed with an exchange of 243,637 shares for US$6,654 compared to 269,334 units at US$34,981 on Friday.
 In Main Market activity, on a day of low trading, Transjamaican Highway was the lead trade with 778,196 shares followed by Wigton Windfarm with 659,034 stocks and Jamaica Stock Exchange with 443,096 units.
In Junior Market trading, Derrimon Trading led trading with 1.28 million shares followed by Omni Industries with 1.17 million units and Spur Tree Spices with 479,681 stocks.
In the preference segment, 138 Student Living preference share dropped $30 in closing at $170 and Sygnus Credit Investments C10.5% sank $6 to end at $102.
The market’s PE ratio, the most popular measure used to value stocks, ended at 20.3 on 2023-24 earnings and 13.9 times those for 2024-25 at the close of trading. ICInsider.com PE ratio chart and more detailed daily charts provide investors with regularly updated information to help decision-making.
The PE ratio chart covers all ordinary shares on the Jamaica Stock Exchange, grouped by industry, allowing for easy comparisons within a sector and the overall market. The EPS & PE ratios are based on 2023 and 2024 actual or projected earnings, excluding major one off items.
Pertinent information is required to navigate numerous investment options successfully in the stock market. The ICInsider.com PE ratio chart and more detailed daily charts provide investors with regularly updated information to help decision-making.
The chart should be used in making rational decisions when investing in stocks close to the average for the sector, not going too far from it unless there are compelling reasons to do so. This approach helps to remove emotions from investment decisions and place them on fundamentals while at the same time not being too far from the majority of investors.  Investors who buy when the price of a stock is close to the average will find that they are not inclined to overpay for a stock.
The net asset value of each company is reported as a guide for investors to quickly assess the value of stocks based on this measure. The chart also shows daily changes in stock prices and the percentage year to date price movement based on the last traded prices.
Dividends paid or payable and yields for each company are shown in the Main and Junior Markets’ daily report charts, along with the closing volume of the highest bid and the lowest offer for each company.