Since listing on the Junior Market on Tuesday last week, EduFocal jumped 306 percent from the IPO price of $1as it hit an all-time high of $4.06 on Monday and ran out of steam with nearly 30 million units traded valued more than $1.6 million, with the price pulling back to $3.15 at the close.
At the close of trading, the Combined Index jumped 2,519.74 points to 398,338.57, the All Jamaican Composite Index surged 5,036.59 points to end at 434,295.40 and the JSE Main Index rose 3,059.12 points to end at 387,410.06 and the Junior Market Index dropped 38.77 points to close at 4013.42.
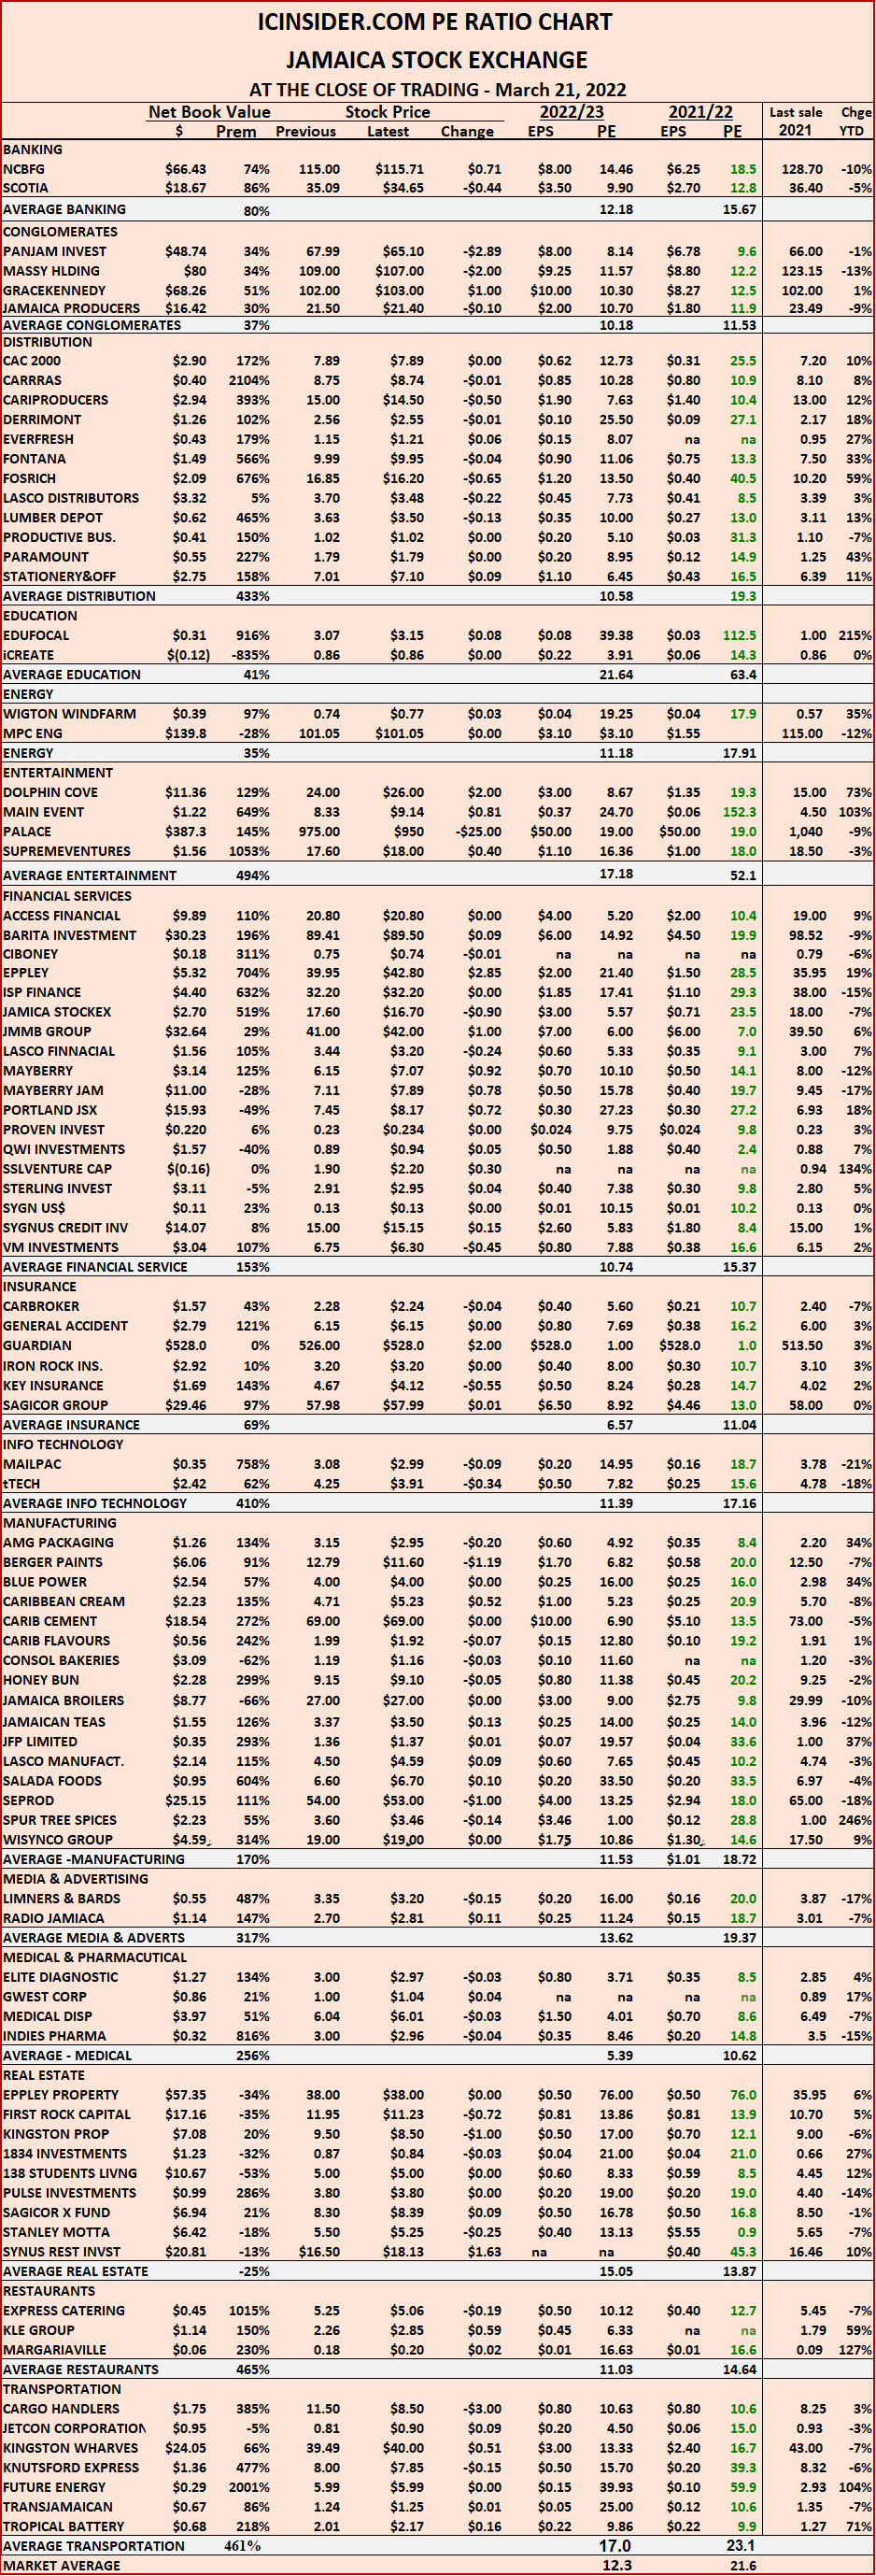
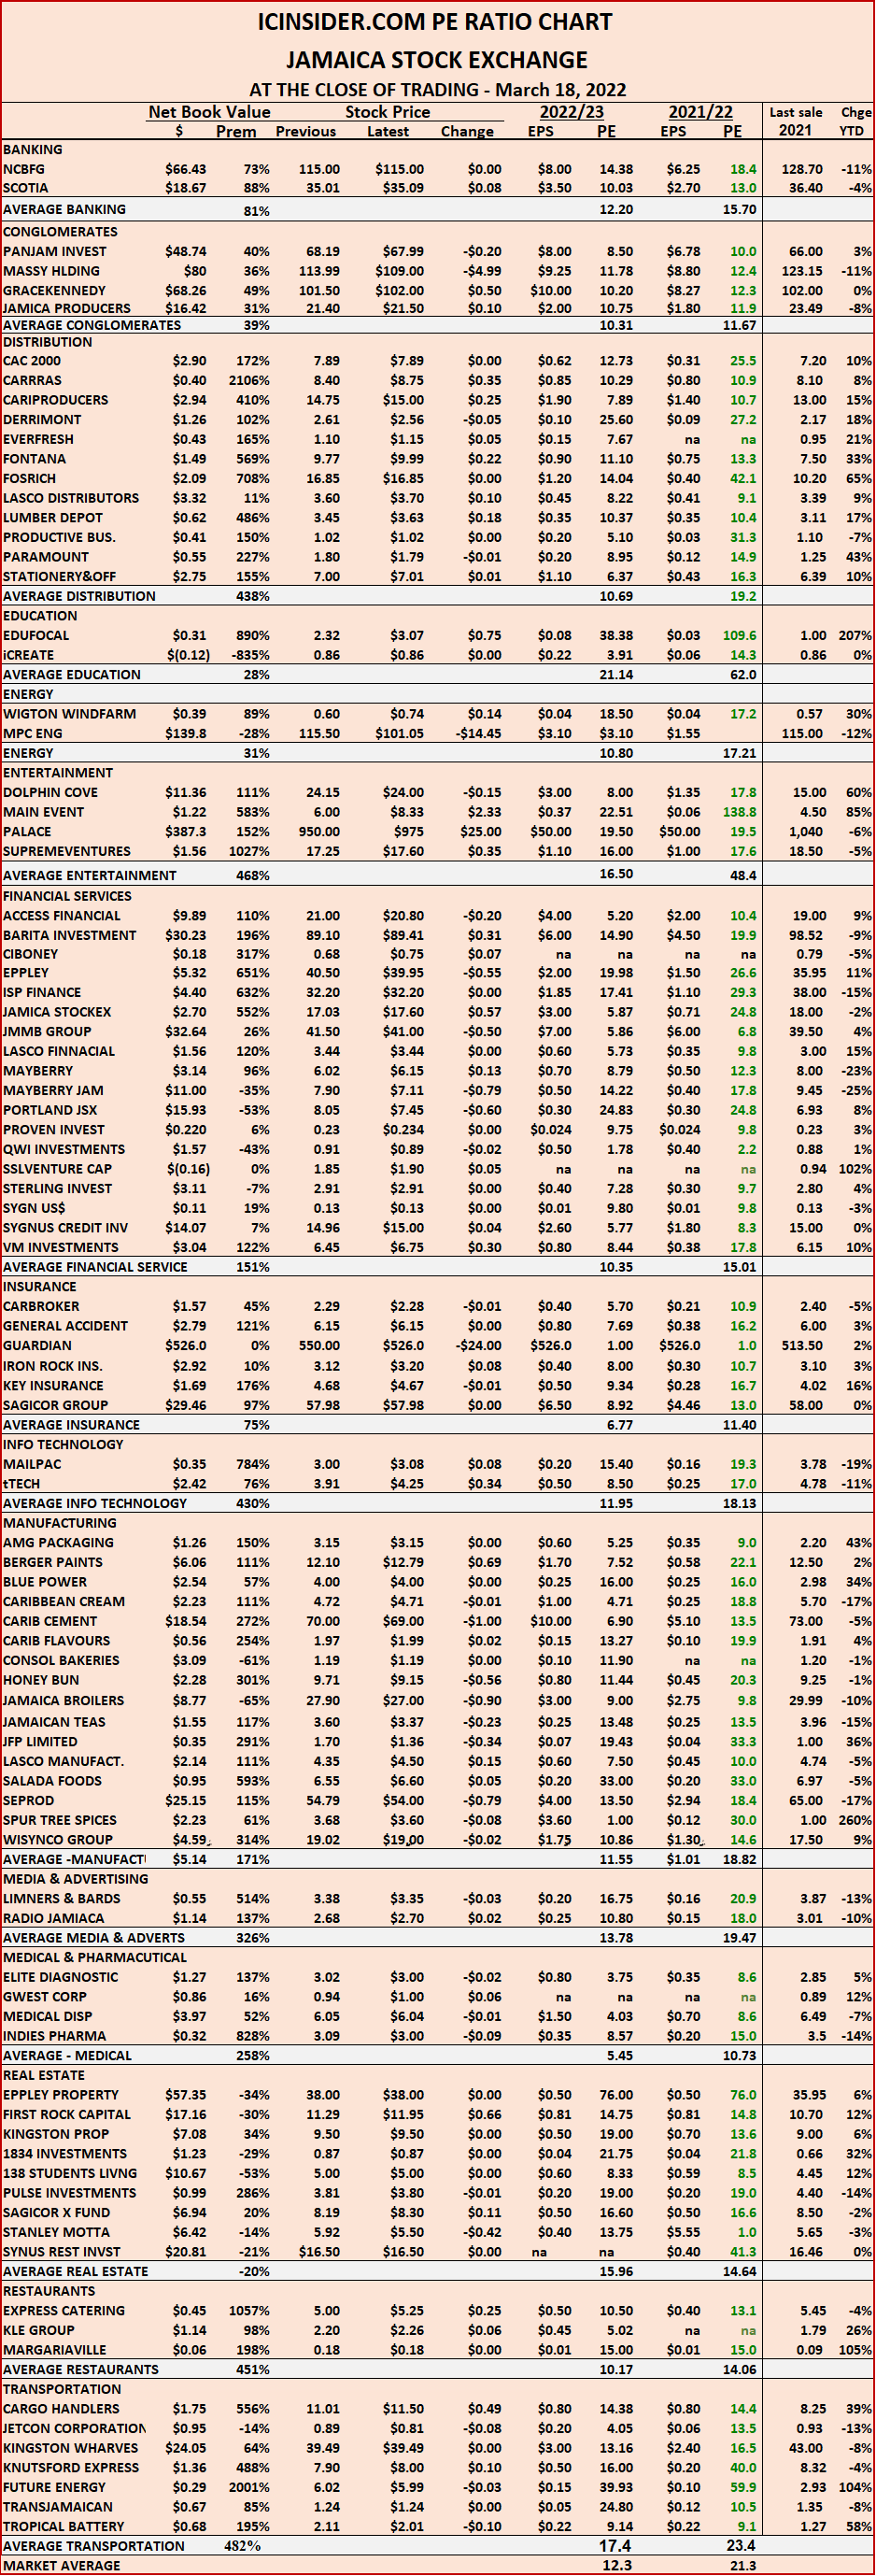
The market’s PE ratio ended at 21.6 based on 2021-22 earnings and 12.3 times those for 2022-23 at the close of the Jamaica Stock Exchange.
Investors need a series of measures and pertinent information to successfully navigate the many investment choices in the local stock market. The ICInsider.com PE ratio chart and the more detailed daily report charts provide investors with regularly updated information to help with decision-making.
 Investors should make use of the chart to help make rational investment decisions by investing in stocks that are close to the average for the sector and not going too far from it unless there are compelling reasons to do so. This approach helps to take emotions out of the investment decision and put in on fundamentals while at the same time not being too far from the majority of investors. Investors who buy when the price of a stock is close to the average will find that they are not inclined to overpay for a stock.
The ICInsider.com PE Ratio chart covers all ordinary shares listed on the Jamaica Stock Exchange. It shows companies grouped on an industry basis, allowing easy comparisons between the same sector companies and the overall market.
The net asset value of each company is reported as a guide to assess the value of stocks based on this measure quickly. The chart also shows daily changes in stock prices and the percentage year to date price movement based on the last traded prices. Dividends payable and yields for each company are shown in the Main and Junior Markets’ daily report charts that show closing volume for the bids and offers.
The EPS & PE ratios are based on 2021 and 2022 actual or projected earnings, excluding major one off items. The PE Ratio is the most popular measure used to determine the value of stocks.
EduFocal rally runs out of steam
10 stocks for 10 years
In the world of investing, it would be nice to find big winners at all times and invest in them just before their prices explode; that is not how stock markets work. Most investors need to buy and wait, to be rewarded with much higher prices later on. History is replete with many examples that show patience paying off handsomely.
 In more recent times, some investors are demonstrating levels of exuberance in buying some stocks at excessive values that will take a long time to generate a reasonable return on investment.
In Jamaica, over the past few years, there are several stocks that recorded huge gains, allowing persons who hold them for years to make a bungle. One of the most celebrated is Lascelles DeMercado is no longer listed on the Jamaica Stock Exchange having been acquired by Angostura in late 2007 for the equivalent of $643 or US$10.65 per share valuing the company at $61.7 billion. The stock traded at $4.25 (the equivalent of 10.5 cents) in 1983, with 2.4 million shares issued, valuing the group then at just $10 million and it gained 6,000 percent between 1983 and 2007. In other words, a $10,000 investment in 1983 would be worth over $6 million in 2007. How many persons saw that coming? Not many but some seasoned investors did. But Lascelles is not the only stock on the local market to provide rich rewards for Investors.
What the information above shows is that long term investment can be very rewarding. This is especially so for persons with limited time to spend monitoring their investment on an ongoing basis.
In 2017, this publication recited portions of an article captioned “Teachings from silly Unilever Investors.” “In 2013 ICInsider.com posted a report on the Unilever Caribbean, a company based in Trinidad and traded on the country’s stock exchange. “
”Since the report, the company stock has been on a downward slope after rising to a new record in 2013. On November 8, 2017, Jamaica Stock Exchange Junior Market listed Knutsford Express, after a long period of overvaluation relative to the market, dropped $2.75 as demand for the stock evaporated. Similarly, Cargo Handlers was pushed unrealistically to $30, only for it to currently be trading at $10, which is still above normal valuation. This latter stock came as a big buy recommendation on the way up by a brokerage house at the time.
“Unilever’s profit peaked in the period to September 2014 and started a downhill ride since, but investors kept on pushing the price higher until it peaked at an unrealistically high of TT$68.30 in December 2015.”
The IC Insider.com recommendation at the time was as follows: When stock prices rise much faster than the growth in profits, time out is needed to discover what is happening. That recommendation is as true then as it is now.

Knutsford Express
Notably, after several years, all three of the above stocks are currently trading well below their peak while many other stocks in the markets have gone on to record high prices. At the last trade Unilever is trading at TT$15.20, Cargo Handlers for a long time around $7, but recently hit $12 and Knutsford that traded at a high of $17, with a PE of 31 now trades at $8, with a PE closer to 40.
Investing in undervalued stocks that have products to support growth, as was the case in Lascelles shares, can pay rich dividends over time.
Investors should be mindful of chasing after the popular stocks that are fully valued or overpriced as was the case in the above three stocks that failed to perform in more than four years while others have delivered outstanding gains. That is why ICInsider.com has come up with a list of 10 stocks in both the Main and Junior Markets that, in our estimation, are good candidates for long-term investment for the next ten years. 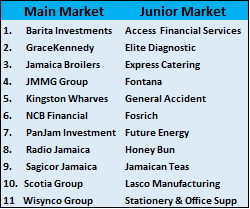 The numbers climbed to 11 each as we could not separate the 11th ones from the lists. The listings are a compilation based on inputs from some knowledgeable investors as well as ICInsider.com’s own assessment. The selections are based on an evaluation of the quality of management, products and services each company offers to their customers, and prospects for growth by these companies and the economies they service.
Most importantly, the analysis considers that management has the quality or will get the talent to steer the companies successfully over a ten year period.
Note is taken of the local economy, the commitment to fiscal surplus or modest deficit financing if at all for a number of years. This will lead to low interest rates and stimulate long term economic growth, subject to world conditions. In such an environment investors can look to invest for the long term rather than a few months or years.
Caribbean Producers almost made the cut with expected strong growth in the tourism sector in which it is a major player, but the historical performance since it was listed on the Junior Market in 2012, leaves doubt if management can in fact deliver predictable good returns for investors over the next ten years.
ICInsider.com was assisted with the selection by Karl Wynter and an individual investor, with years of managerial experience working for some leading groups in the Caribbean. Karl Wright former head of VM Group and individual investor, Ryan Strachan of GK Capital and Nigel Coke former investment advisor and trader at one of the leading Jamaican stockbrokers and an individual investor.
Coming in two separate articles are commentaries on the rationale for each selection.
More changes to ICTOP10
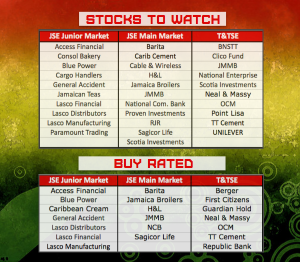
The only major move in the Junior Market ICTOP10 listing, this week was a fall of 8 percent for Tropical Battery, while in the Main Market, Carreras rose 6 percent followed by Caribbean Producers with 5 percent, both dropped out of the TOP10, while Guardian Holdings and 138 Student Living both lost 5 percent for the week. The week’s movements resulted in no change to the ICTOP10 Junior Market stocks but Transjamaican Highway and Jamaica Broilers return to the list.
BuyRated stocks from the long-ago past
The Junior Market index closed up to 4,052.19 points, ahead of the 4,031 close of the previous week, helped by the strong gains in the two newly listed companies; JFP limited and EducFocal that jumped sharply during the week, with the former topping out at $2 to close the week up by 36 percent at $1.36, with a PE of 19 times projected 2022 earnings, while the latter jumped to $3.07 for an incredible gain of 207 percent with a PE of 38 based on projected earnings of 8 cents for 2022. Meanwhile, the Main Market continues to consolidate at a support level of around 440,000 points using the All Jamaica Composite Index, but the market drifted down below that level in the latter part of the week as NCB Financial dropped to a multi-year low of $91.01 on Wednesday, with little demand for the stock currently, but it may find support around the $105 level.
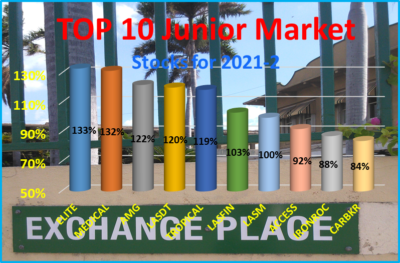
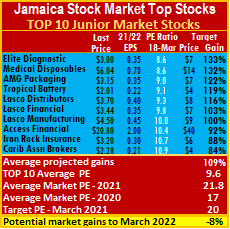
 The Junior Market potential gains for the TOP 10 Junior Market stocks stand at 109 percent, much lower than the Main Market at 137 percent, an indication that Main Market is greatly undervalued. The top three stocks in the Junior Market are Elite Diagnostic, Medical Disposables followed by AMG Packaging, to gain between 122 and 133 percent.
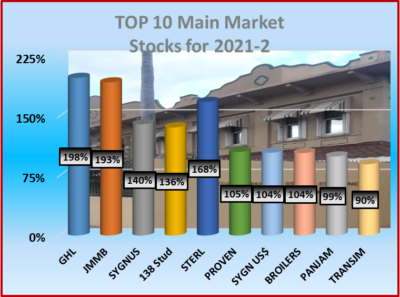
The potential gains for Main Market stocks moved from 127 percent last week to this weeks’ 137 percent, with the top three being Guardian Holdings, JMMB Group followed by Sygnus Credit Investments all projected to gain between 169 and 198 percent versus 168 to 193 percent last week.
 The average PE for Junior Market is well ahead of the average of 17 times 2020 earnings achieved at the end of March last year in moving to 21.8 based on ICInsider.com’s 2021-22 earnings, pushed up mainly by five stocks, with EduFocal and Main Event over 100 times 2021 earnings. Excluding the 5 highest PE ratios over 40, the average would be around 18. The JSE Main and USD Markets at 15.8 is well off from 19 in 2021. The TOP 10 stocks trade at a PE of a mere 8.6, with a 45 percent discount to that market’s average.
The average PE for the JSE Main Market is 20 percent less than the PE of 19 at the end of March and 24 percent below the target of 20 to the end of March this year. The Main Market TOP 10 average PE is 8.6 representing a 45 percent discount to the market, well below the potential of 20. 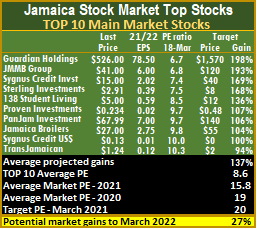 The depressed PE of the main market is an indication that bigger investors are reluctant to be aggressive in buying into the market currently, with inflation, rising interest rates and war populating the headlines.
ICTOP10 focuses on likely yearly winners, accordingly, the list may or may not include the best companies in the market. ICInsider.com ranks stocks based on projected earnings to highlight winners from the rest, allowing investors to focus on potential winning stocks and helping to remove emotional attachments to stocks that often result in costly mistakes.
 IC TOP10 stocks are likely to deliver the best returns up to March 2022 and ranked in order of potential gains, based on the possible increase for each company, considering the earnings and PE ratios for the current fiscal year. Expected values will change as stock prices fluctuate and result in weekly movements in and out of the lists. Revisions to earnings per share are ongoing, based on receipt of new information.
Persons who compiled this report may have an interest in securities commented on in this report.
EduFocal jumps, JFP drops 32% from peak
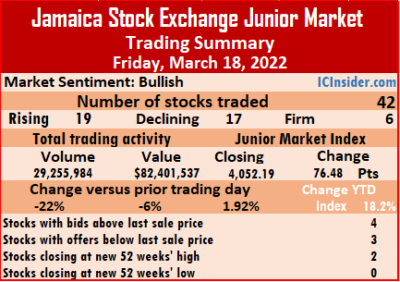
EduFocal rallied 75 cents to end at $3.07, with a gain of 207 percent over the IPO price and since listing on the Junior Market on Tuesday. Trading closed with strong demand for above $3 per share. The price movement on Friday helped to push the Market Index up a strong 76.48 points to close at 4,052.19, as the same time, JFP that listed on Monday fell 32 percent from its peak of $2.
 A total of 42 securities were traded on Friday, similar to Thursday. At the close, 18 gained, 17 declined and seven ended unchanged.
The PE Ratio, a measure used to compute appropriate stock values, averages 21.8. The PE ratio of each stock in the chart below is based on ICInsider.com earnings forecast for companies with financial years up to August 2022.
The overall volume of stocks traded slipped 22 percent with the value down moderately from Thursday. Overall, 29,255,984 shares traded for $82,401,537 compared to 37,553,313 units at $87,439,082 on the Thursday. EduFocal led trading with 11.18 million shares for 38.2 percent of total volume, followed by JFP Limited with 9.68 million units taking 33.1 percent of the day’s trade, Tropical Battery cornered 2.07 million units, with 7.1 percent market share and Future Energy Source ended with 1.97 million units for 6.7 percent market share.
Trading averaged 696,571 shares at $1,961,941 down from 894,127 shares at $2,081,883 on Thursday and month to date an average of 572,569 units at $2,182,126 compared to 562,132 units at $2,200,659 on the previous day. February closed with an average of 370,064 units at $1,402,517.
Investor’s Choice bid-offer indicator shows three stocks ended with bids higher than their last selling prices and three with lower offers.
 At the close, Access Financial fell 20 cents in closing at $20.80 while exchanging 7,532 shares, Cargo Handlers gained 49 cents to close at $11.50, 62 with stocks units changing hands, Dolphin Cove shed 15 cents to end at $24 in an exchange of 52,902 stock units. EduFocal rallied 75 cents to end at a record $3.07, with 11,180,753 units crossing the exchange, Express Catering advanced 25 cents ending at $5.25 in switching ownership of 49,975 with 35,634 units changing hands, Iron Rock Insurance rose 8 cents to end at $3.20 in exchanging 3,500 stocks. Jamaican Teas declined 23 cents to $3.37 after an exchange of 296,928 shares, Jetcon Corporation dropped 8 cents to end at 81 cents trading 94,486 units, JFP Limited fell 34 cents to $1.36 after exchanging 9,679,780 stock units. Knutsford Express climbed 10 cents to close at $8 in trading 100 shares, Lasco Distributors popped 10 cents to $3.70 with the swapping of 26,490 units, Lasco Manufacturing climbed 15 cents in closing at $4.50 with 344,003 stocks passing through the exchange.
 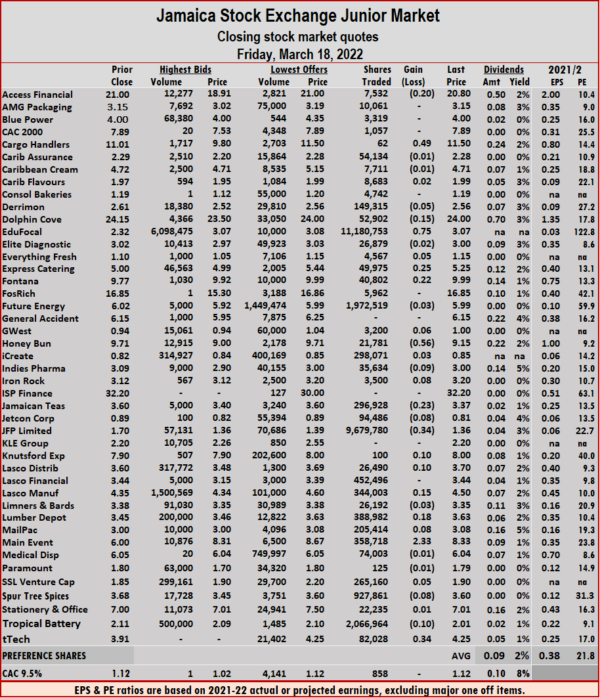 Lumber Depot popped 18 cents after ending at $3.63, with 388,982 stock units crossing the market, Mailpac Group rallied 8 cents in closing at $3.08 with an exchange of 205,414 shares, Main Event jumped $2.33 to end at 52 weeks’ high of $8.33 after finishing trading 358,718 stocks. Spur Tree Spices shed 8 cents to $3.60 after 927,861 units crossed the market, Tropical Battery lost 10 cents to close at $2.01 after exchanging 2,066,964 stock units and tTech advanced 34 cents to end at $4.25 and closed with 82,028 stock units changing hands.
Prices of securities trading are those for the last transaction of each stock unless otherwise stated.
EduFocal gains 207% in a week
Since listing on the Junior Market on Tuesday EduFocal is up 207 percent from the IPO price in early March, with demand at more than 18 million shares at $3 and above at the close of the market on Friday after gaining 75 cents for the day and helping to move the Junior Market Index jumped 76.48 points to settle at 4052.19, at the same time the Combined Index jumped 2,195.90 points to 395,818.83, the All Jamaican Composite Index gained 1,319.00 points to end at 429,258.81 and the JSE Main Index rose 1,620.15 points to end at 384,350.94,
The market’s PE ratio ended at 21.3 based on 2021-22 earnings and 12.3 times those for 2022-23 at the close of the Jamaica Stock Exchange.
Investors need a series of measures and pertinent information to successfully navigate the many investment choices in the local stock market. The ICInsider.com PE ratio chart along with the more detailed daily report charts, provide investors with regularly updated information to help with decision making.
Investors should make use of the chart to help make rational investment decisions, by investing in stocks that are close to the average for the sector and not going too far from it, unless there are compelling reasons to do so. Investors who buy when the price of a stock is close to the average will find that they are not inclined to overpay for a stock. This approach helps to take emotions out of the investment decision and put in on fundamentals while at the same time not being too far from the majority of investors.
 The ICInsider.com PE Ratio chart covers all ordinary shares listed on the Jamaica Stock Exchange and shows companies grouped on an industry basis, allowing for easy comparisons between same sector companies as well as the overall market.
The net asset value of each company is reported as a guide to easily assess the value of stocks based on this measure. The chart also shows daily changes in stock prices and the percentage year to date price movement based on the last traded prices. Dividends payable and yields for each company are shown in the Main and Junior Markets’ daily report charts that show closing volume for the bids and offers.
The EPS & PE ratios are based on 2021 and 2022 actual or projected earnings, excluding major one-off items. The PE Ratio is the most popular measure used to determine the value of stocks.
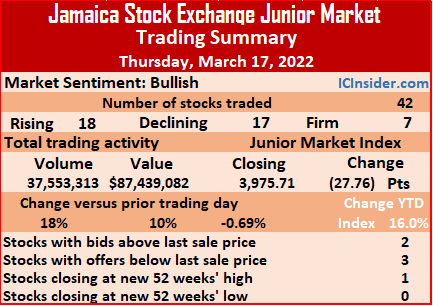
Junior Market slips on Thursday
Trading closed on Thursday, with the volume of stocks traded rising 18 percent with the value increasing 10 percent higher than on Wednesday at the close of the Jamaica Stock Exchange Junior Market, which ended with the Market Index declining.
 Market activity led to 42 securities trading compared to 43 on Wednesday and ended with 18 rising, 17 declining and seven closing unchanged. At the close, the Junior Market Index shed 27.76 points to close at 3,975.71.
The PE Ratio, a measure used to compute appropriate stock values, averages 21. The PE ratio of each stock in the chart below is based on ICInsider.com earnings forecast for companies with financial years up to August 2022.
Overall, 37,553,313 shares traded for $87,439,082 compared to 31,775,636 units at$ 79,249,482 on Wednesday. JFP Limited led trading with 18.41 million shares for 49 percent of total volume, followed by EduFocal with 9.72 million units for 25.9 percent of the day’s trade. Lumber Depot with 2.28 million units for 6.1 percent market share, Tropical Battery with 1.84 million units for 4.9 percent market share and Caribbean Flavours with 1.28 million units for 3.4 percent market share.
Trading averaged 894,127 shares at $2,081,883 in contrast to 738,968 shares at $1,843,011 on Wednesday and month to date, an average of 562,132 units at $2,200,659, compared to 531,620 units at $2,211,575 previously traded. February closed with an average of 370,064 units at $1,402,517.
Investor’s Choice bid-offer indicator shows two stocks ended with bids higher than their last selling prices and three with lower offers.
 At the close, Access Financial rallied $2.55 to end at $21, with 1,559 shares crossing the market, Blue Power rose 61 cents to $4 while exchanging 22,039 stocks, CAC 2000 rose 36 cents to close at $7.89 in an exchange of 1,462 units. Cargo Handlers climbed $1.87 after ending at $11.01 in trading 16,540 stock units, Dolphin Cove gained $2.15 in closing at $24.15 after exchanging 27,441 units, EduFocal popped 57 cents to end at a record of $2.32 in trading 9,716,123 shares. Express Catering fell 17 cents to close at $5 with an exchange of 10,295 stock units, Fosrich lost 10 cents in ending at $16.85 with 91,159 stocks changing hands, General Accident increased 25 cents to end at $6.15 with 3,000 shares clearing the market. GWest Corporation dropped 13 cents in closing at 94 cents in exchanging 10,206 stocks, Honey Bun advanced 79 cents to close at $9.71 after trading 23,898 stock units, Jamaican Teas popped 12 cents in closing at $3.60 with 262,059 units changing hands. JFP Limited declined 15 cents to $1.70, with 18,409,007 shares crossing the market, Knutsford Express shed 10 cents to end at $7.90 in switching ownership of 3,290 stocks Lasco Distributors fell 19 cents to end at $3.60 after trading 206,064 units.
 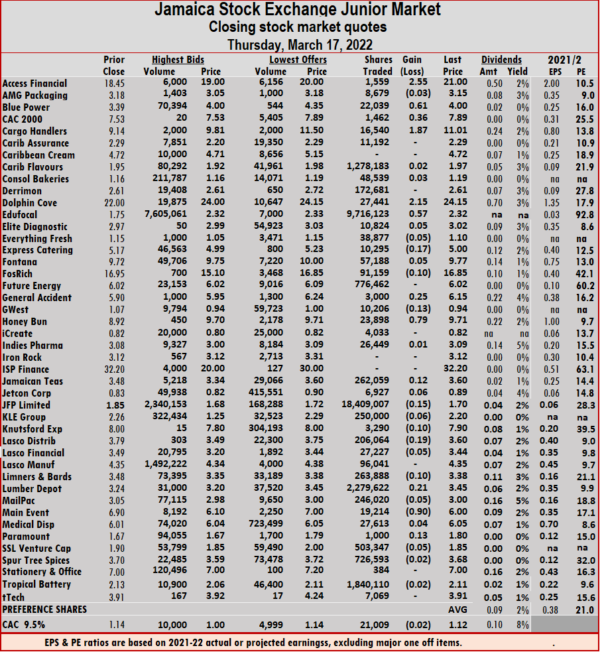 Limners and Bards lost 10 cents to $3.38 with an exchange of 263,888 stock units, Lumber Depot rallied 21 cents to end at $3.45 with the swapping of 2,279,622 stock units, Main Event dropped 90 cents to close at $6 in an exchange of 19,214 units and Paramount Trading rose 13 cents in closing at $1.80 in switching ownership of 1,000 shares.
Prices of securities trading are those for the last transaction of each stock unless otherwise stated.
NCB dropped to a low of $90
In Thursday trading, NCB Financial dropped to a 52 weeks’ intraday low of $90 before bouncing within minutes of the close to trading at $115 but the stock has only 14 bids to buy with most under $100 and an indication of the stock’s weakness. The fall in NCB helped in pushing the Main Market of the Jamaica Stock Exchange down, with the Combined Index dropping 2,719.24 points to 393,622.90, the All Jamaican Composite Index dived 4,466.69 points to 427,939.8, the JSE Main Index tumbled 2,641.22 points to end at 382,730.79, while the Junior Market Index declined 27.76 points to settle at 3,975.71.
The market’s PE ratio ended at 19.5 based on 2021-22 earnings and 11.8 times those for 2022-23 at the close of the Jamaica Stock Exchange.
Investors need a series of measures and pertinent information to successfully navigate the many investment choices in the local stock market. The ICInsider.com PE ratio chart along with the more detailed daily report charts, provide investors with regularly updated information to help with decision making.
Investors should make use of the chart to help make rational investment decisions, by investing in stocks that are close to the average for the sector and not going too far from it, unless there are compelling reasons to do so. 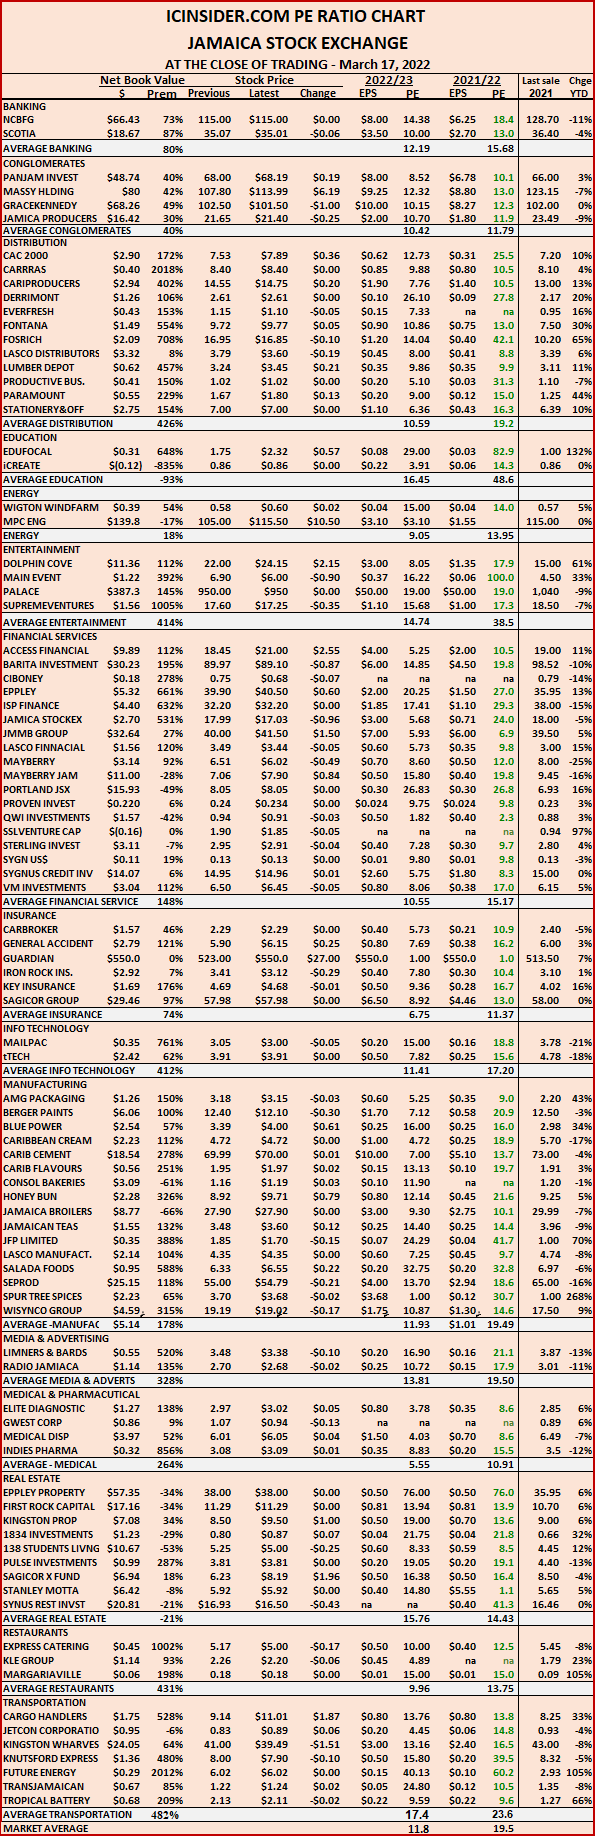 Investors who buy when the price of a stock is close to the average will find that they are not inclined to overpay for a stock. This approach helps to take emotions out of the investment decision and put in on fundamentals while at the same time not being too far from the majority of investors.
The ICInsider.com PE Ratio chart covers all ordinary shares listed on the Jamaica Stock Exchange and shows companies grouped on an industry basis, allowing for easy comparisons between same sector companies as well as the overall market.
The net asset value of each company is reported as a guide to easily assess the value of stocks based on this measure. The chart also shows daily changes in stock prices and the percentage year to date price movement based on the last traded prices. Dividends payable and yields for each company are shown in the Main and Junior Markets’ daily report charts that show closing volume for the bids and offers.
The EPS & PE ratios are based on 2021 and 2022 actual or projected earnings, excluding major one off items. The PE Ratio is the most popular measure used to determine the value of stocks.
JFP IPO pulls in 5,062 shareholders
Following a successful initial public offer of 280 million shares that were offered to the public to raise $280 million by JFP Limited a décor and furniture manufacturing company, amassed a total of 5,062 shareholders following the public issue.
 The company was listed on the Junior Market of the Jamaica Stock Exchange and Monday brought the total listings on the market to 44, the number of listed companies to 43 and the listing of companies on the exchange to 97 companies.
“The JFP could not be listed without the work of its founder Stephen Sirgany and the staff of JFP, who worked tirelessly to ensure that the Company is what it is today and to achieve the status of being listed on the Board of the Exchange,” Metry Seaga, Chief Executive Officer stated in his address at the listing ceremony.
“I want to encourage SMEs to stay the course, overcome the hurdles and you will be able to achieve great results, such as listing on the Board of the Exchange,” JFP’s CEO advised.
“The markets have been busy creating millionaires and we are happy that the Jamaica Stock Exchange could have provided the facilities for persons in Jamaica to create wealth. Companies are creating wealth through JSE’s facilities. Jamaicans don’t have to sit on the sideline and watch these companies create wealth, but they can now share in the whole process”, Ryan Strachan, VP Investor Relations at GK Capital Management Limited, the Lead Broker, stated in addressing the audience.
The stock that was issued at $1 each traded on Thursday morning at $1.91 for a gain of 91 percent over the issue price.
JFP & EduFocal dominate Junior Market
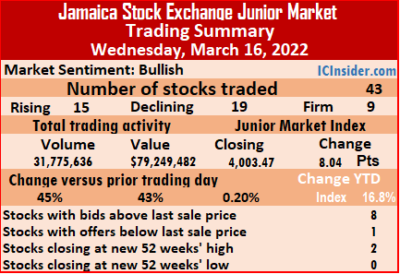
Trading Newly listed JFP Limited and EduFocal dominated Jamaica Stock Exchange Junior Market on Wednesday and rose to record highs in helping the volume of stocks traded to rise 45 percent more than on Tuesday with a 43 increase in value and were the main reason for the market Index to eke out a modest 8.04 points rose to settle at 4,003.47.
 Market activity led to 43 securities trading, similar to Tuesday and ended with 15 rising, 19 declining and nine closing unchanged.
The PE Ratio, a measure used in computing appropriate stock values, averages 20.3. The PE ratios of stocks reported in the chart below are based on ICInsider.com earnings forecast for companies with financial years up to August 2022.
A total of 31,775,636 shares traded for $79,249,482 compared to 21,910,635 units at $55,555,327 on the Tuesday JFP Limited led trading with 20.42 million shares for 64.3 percent of total volume, followed by Lumber Depot with 3.03 million units for 9.5 percent of the day’s trade and EduFocal, 2.15 million units for 6.8 percent market share, while Future Energy Source ended with 1.83 million units changing hands for 5.7 percent market share.
Trading averaged 738,968 shares at $1,843,011 up from 509,550 shares at $1,291,984 on Tuesday, with the month to date, averaging 531,620 units at $2,211,575, compared to 510,084 units at $2,249,855 on the previous day. February closed with an average of 370,064 units at $1,402,517.
Investor’s Choice bid-offer indicator shows eight stocks ended with bids higher than their last selling prices and one with a lower offer.
 At the close, Access Financial rallied 45 cents to $18.45, with 4,443 shares crossing the market, Blue Power dropped 51 cents in closing at $3.39 with an exchange of 629 stocks, Caribbean Cream popped 5 cents to $4.72 with the swapping of 1,802 stock units. Dolphin Cove lost 90 cents to end at $22 after exchanging 23,157 units. EduFocal gained 43 cents to close at a record high of $1.75 after trading 2,154,085 stocks, Elite Diagnostic shed 6 cents ending at $2.97, with 27,678 units clearing the market. Everything Fresh fell 6 cents to close at $1.15 while exchanging 35,264 stock units, Express Catering advanced 29 cents in closing at $5.17 with 3,549 shares changing hands, Fontana fell 6 cents to $9.72 in trading 58,977 stocks. Fosrich declined 5 cents to end at $16.95 after 46,783 shares crossed the exchange, Future Energy Source dropped 27 cents to $6.02, with 1,827,068 units changing hands, General Accident shed 29 cents to $5.90 in switching ownership of 2,163 stock units.
 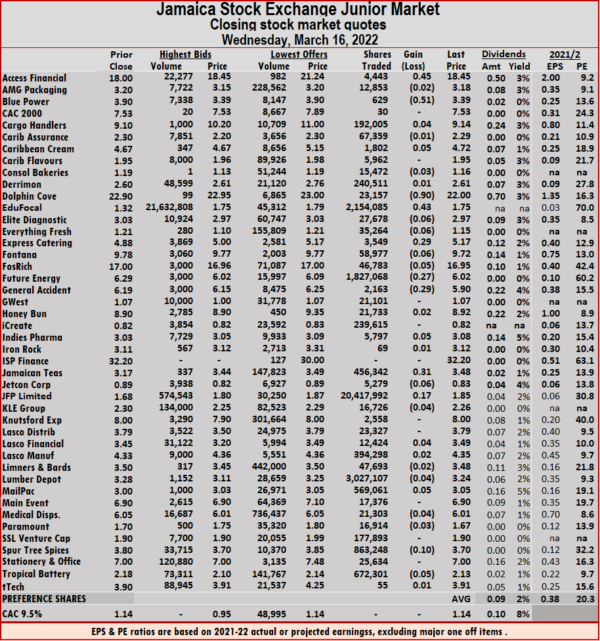 Indies Pharma popped 5 cents to end at $3.08 after an exchange of 5,797 units, Jamaican Teas increased 31 cents to close at $3.48 after 456,342 stock units changed hands, Jetcon Corporation lost 6 cents in closing at 83 cents trading 5,279 stocks. JFP Limited rose 17 cents to end at $1.85 with 20,417,992 shares crossing the market, Mailpac Group rallied 5 cents to $3.05 with 569,061 units changing hands, Spur Tree Spices fell 10 cents in closing at $3.70 in an exchange of 863,248 stocks and Tropical Battery dropped 5 cents to $2.13 trading 672,301 shares.
Prices of securities trading are those for the last transaction of each stock unless otherwise stated.
New listing enriching investors
In Wednesday’s trading on the Jamaica Stock Exchange, this week’s listed EduFocal climbed to $1.75 and JFP climbed to $1.85, after trading as high as $1.90, with both helping the Junior Market Index to rise 8.03 points to settle at 4,003.47 at the close.
The Combined Index dropped 1,013.51 points to 396,342.20 the All Jamaican Composite Index lost 1,779.45 points to settle at 432,406.50, the JSE Main Index dipped 1,158.80 points to end at 385,372.01.
The market’s PE ratio ended at 19 based on 2021-22 earnings and 11.7 times those for 2022-23 at the close of the Jamaica Stock Exchange.
Investors need a series of measures and pertinent information to successfully navigate the many investment choices in the local stock market. The ICInsider.com PE ratio chart along with the more detailed daily report charts, provide investors with regularly updated information to help with decision making.
Investors should make use of the chart to help make rational investment decisions, by investing in stocks that are close to the average for the sector and not going too far from it, unless there are compelling reasons to do so. 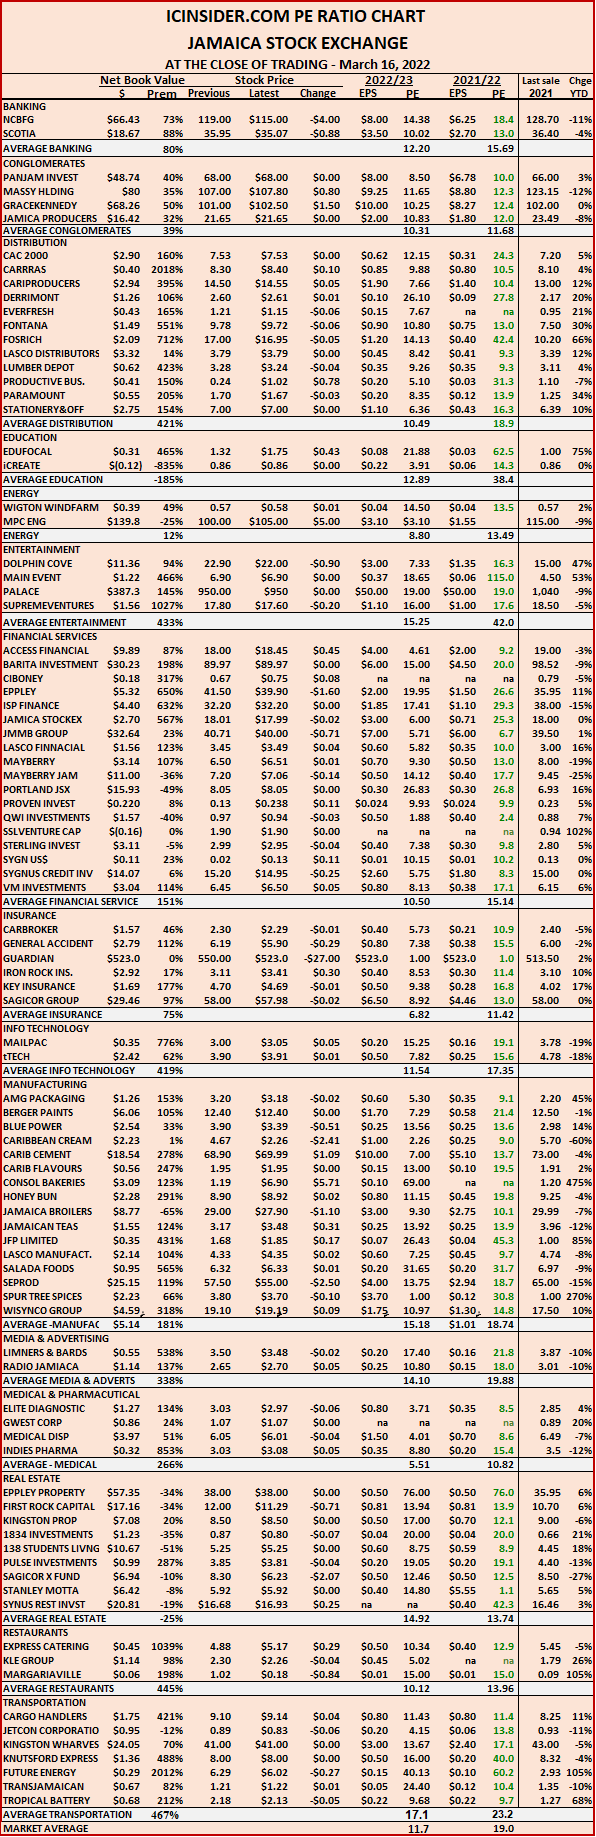 Investors who buy when the price of a stock is close to the average will find that they are not inclined to overpay for a stock. This approach helps to take emotions out of the investment decision and put in on fundamentals while at the same time not being too far from the majority of investors.
The ICInsider.com PE Ratio chart covers all ordinary shares listed on the Jamaica Stock Exchange and shows companies grouped on an industry basis, allowing for easy comparisons between same sector companies as well as the overall market.
The net asset value of each company is reported as a guide to easily assess the value of stocks based on this measure. The chart also shows daily changes in stock prices and the percentage year to date price movement based on the last traded prices. Dividends payable and yields for each company are shown in the Main and Junior Markets’ daily report charts that show closing volume for the bids and offers.
The EPS & PE ratios are based on 2021 and 2022 actual or projected earnings, excluding major one off items. The PE Ratio is the most popular measure used to determine the value of stocks.


