Trading more than doubled at the close of the Junior Market of the Jamaica Stock Exchange Friday, with trading in 41 securities as was the case on Thursday and ending with prices of 20 rising, nine declining and 12 unchanged as the Junior Market Index jumped a solid 61.06 points to 3,733.95. The Investor’s Choice bid-offer indicator is flashing negative signals for Monday’s trading.
 The market closed with trading of 14,787,906 shares for $32,912,226 up from 6,869,011 units at $15,510,430 on Thursday.
Trading averaged 360,681 shares at $802,737 compared with 167,537 units at $378,303 on Thursday with a month to date, average of 375,434 units at $776,020 compared to 376,281 stock units at $774,486 on the previous day and June with an average of 318,732 units at $696,979.
Jamaican Teas led trading with 4.20 million shares for 28.4 percent of total volume followed by Derrimon Trading with 3.87 million stocks for 26.2 percent of the day’s trade and EduFocal with 1.42 million units for 9.6 percent of the total trade.
The Junior Market ended trading with an average PE Ratio of 12.9, based on last traded prices and earnings projected by ICInsider.com for the financial years ending around August 2025.
 Investor’s Choice bid-offer indicator shows two stocks ended with bids higher than their last selling prices and seven with lower offers.
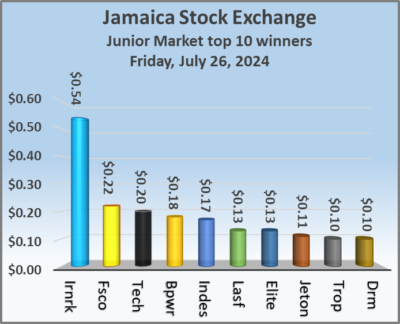
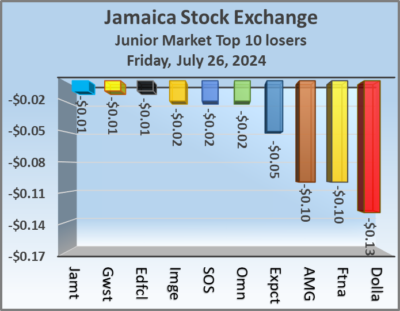
At the close, AMG Packaging dropped 10 cents in closing at $2.90 with an exchange of 3,022 stock units, Blue Power gained 18 cents to close at $4.48, with 8,000 shares passing through the market, Derrimon Trading popped 10 cents to finish at $2.09 with investors trading 3,867,566 units. Dolla Financial fell 13 cents and ended at $2.65 after closing with 284,821 stocks being traded, Elite Diagnostic climbed 13 cents to close at $1.59 with traders dealing in 21,360 shares, Fontana dipped 10 cents to end at $8.20 with an exchange of 566,164 stocks. 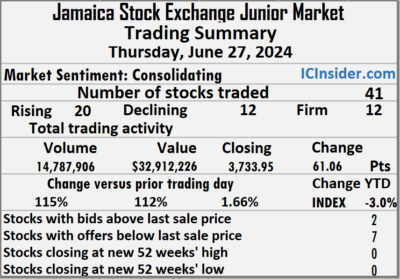 Future Energy rose 22 cents to $3.49 in trading 517,728 units, Indies Pharma gained 17 cents and ended at $2.47 in switching ownership of 328,267 stock units, Iron Rock Insurance rallied 54 cents to end at $3.04, with just 28 shares changing hands. Jetcon Corporation advanced 11 cents in closing at 95 cents, with 370,872 units crossing the exchange, Lasco Financial popped 13 cents to finish at $1.84 in trading 500 stocks, MFS Capital Partners gained 8 cents to close at 85 cents after 121,561 stock units passed through the market. Tropical Battery rose 10 cents to $2.15 in an exchange of 61,526 shares and tTech climbed 20 cents in closing at $2.85, with a mere 3 stock units crossing the market.
 Prices of securities trading are those for the last transaction of each stock unless otherwise stated.
Tropical Battery to migrate
Tropical Battery, the energy storage and power generation company is heading to the Jamaica Stock Exchange (JSE) Main Market by the end of this year, the company reported in a release to the JSE.
Tropical currently has operations in Jamaica, the Dominican Republic and the United States.
According to the company directors, “Since our listing on the Junior Market in September 2020, Tropical Battery has experienced substantial growth and is now surpassing the junior market’s $500 million capital requirement.  This strategic move to the Main Market reflects our commitment to continuing this trajectory of success and delivering enhanced value to our shareholders.” They go on to further state “Since our listing, revenue has grown more than threefold, from $1.8 billion to $5.7 billion forecasted for this fiscal year ending September 30, 2024.”
The company incurred a large amount of debt in funding recent acquisitions, with long term loans amounting to $2.9 billion and shareholders’ equity of only just $1.14 billion, in addition, the group has short term loans amounting to $1.8 billion. With gross cash flows from operations in 2023 amounting to $260 million and cash on hand of $429 million in March this year, funds on hand and to be generated over twelve months are not likely to be able to pay off the short term borrowings. Regardless, the heavy debt load is unhealthy and the company will need to bring the debt down to be in line with total equity. Accordingly, they will need the avenue of the Main Market to raise around $2 billion in equity to rebalance the financial position.
For the six months to March, the company reported revenues of $2.36 billion with $1.55 billion generated in the March quarter, with the operations producing $100 million in profit before minority interest and $164 million for the half year, excluding $77 million that was expensed relating to the acquisition of a subsidiary.
Solid gains for Main & Junior markets
Rising stocks pushed the Main and Junior markets much higher at the close of the Jamaica Stock Exchange trading on Friday as the Market JSE USD market closed marginally lower as trading ended with the number of stocks changing hands falling, with the value of stocks traded jumping sharply over the previous trading day, resulting in prices of 38 shares rising and 26 declining.
 At the close of the market, the JSE Combined Market Index shot up 1,432.71 points to 327,489.18, the All Jamaican Composite Index rallied 1,682.41 points to 356,592.46, the JSE Main Index popped 1,044.59 points to 314,466.93. The Junior Market Index advanced a solid 61.06 points to end at 3,733.95 and the JSE USD Market Index dipped 0.70 points to close trading at 224.17.
At the close of trading, the volume of stocks traded jumped sharply to 28,434,606 shares in all three markets, well on the 19,944,044 units on Thursday, with the value of stocks traded on the Junior and Main markets amounted to $98.49 million, compared with $84.8 million on the previous trading day and the JSE USD market closed with an exchange of 47,268 shares for US$3,703 compared to 200,309 units at US$13,942 on Thursday.
In Main Market activity, Sagicor Select Financial Fund led trading with 5.81 million shares followed by Transjamaican Highway with 3.82 million stocks and Wisynco Group with 1.01 million units.
 In Junior Market trading, Jamaican Teas led trading with 4.20 million shares followed by Derrimon Trading with 3.87 million units and EduFocal with 1.42 million stock units.
In the preference segment, 138 Student Living preference share climbed $27.15 in closing at $155.25 and Sygnus Credit Investments C10.5% increased $7.98 to $107.98.
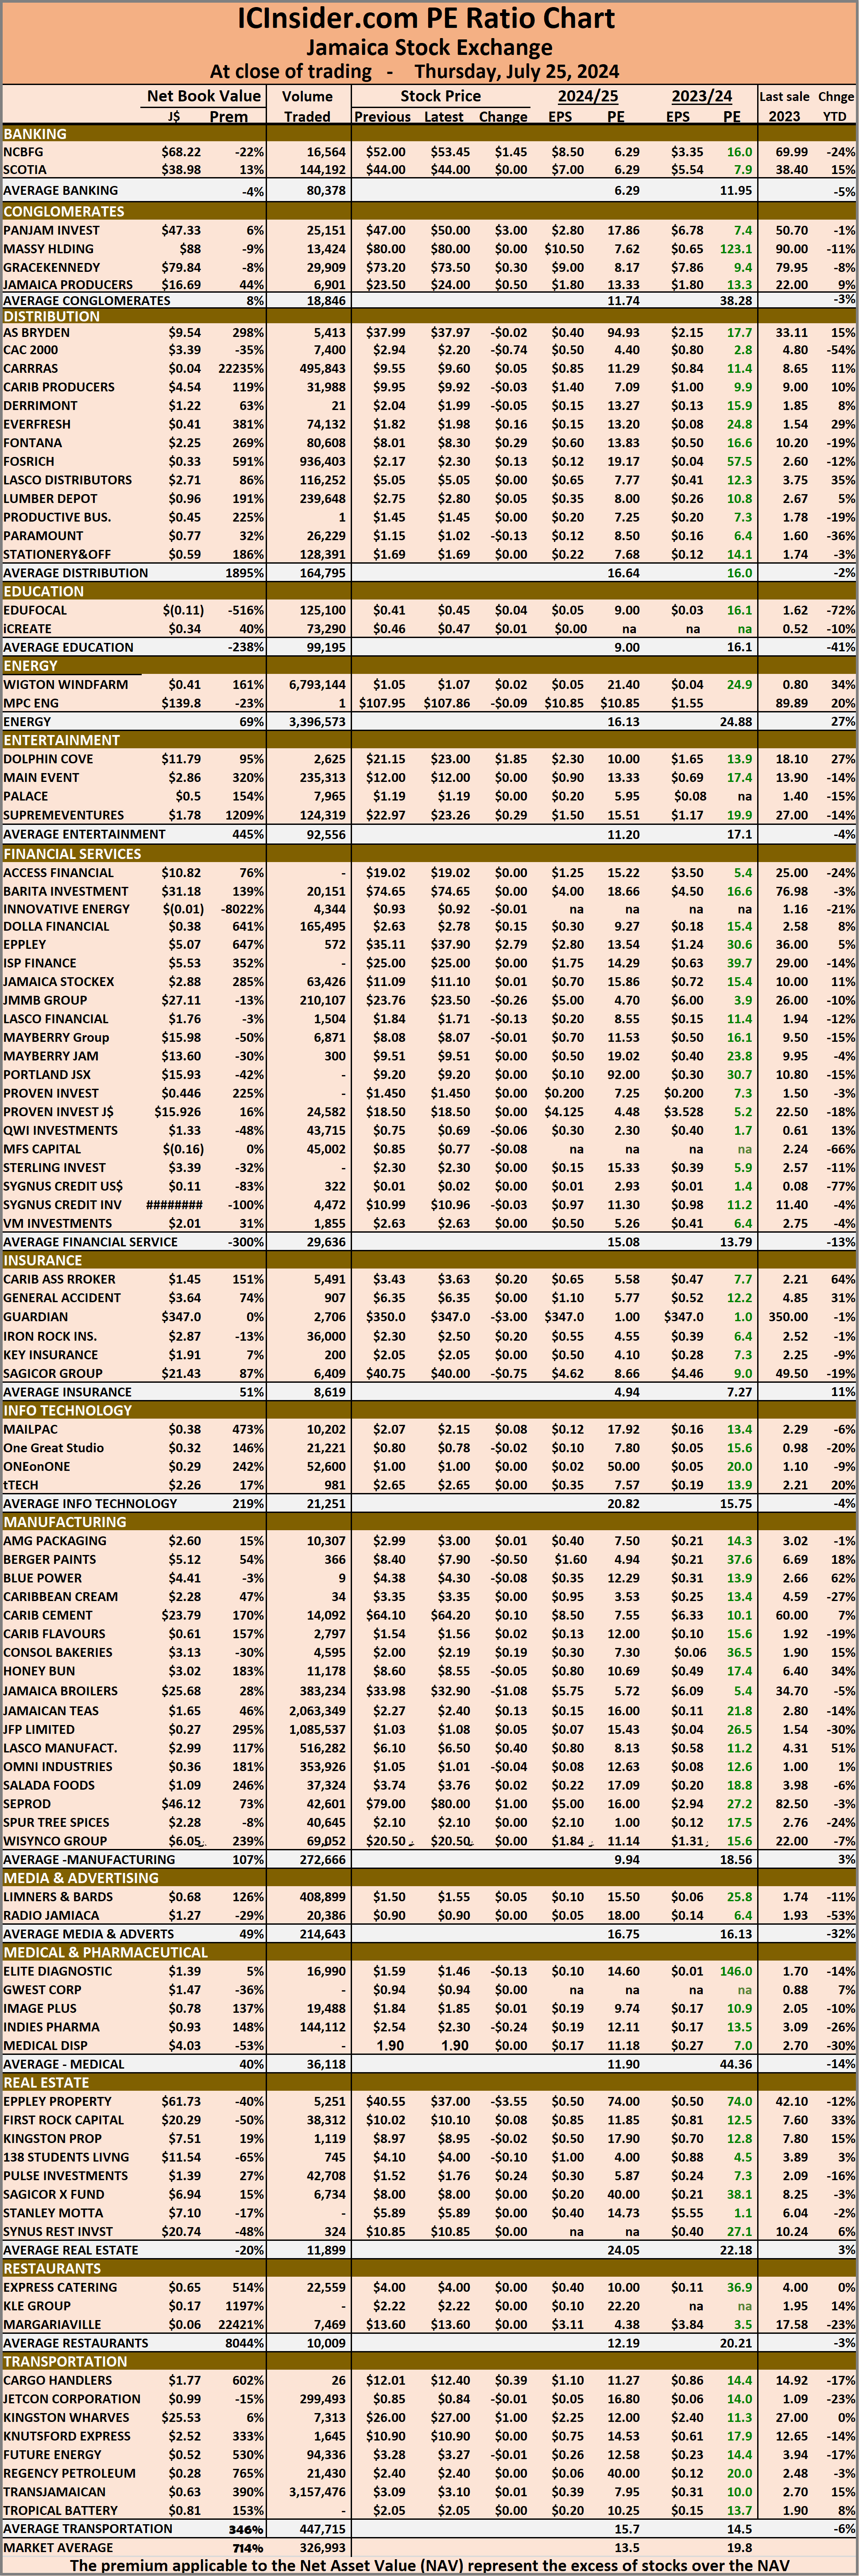
The market’s PE ratio, the most popular measure used to value stocks, ended at 20 on 2023-24 earnings and 13.7 times those for 2024-25 at the close of trading. ICInsider.com PE ratio chart and more detailed daily charts provide investors with regularly updated information to help decision-making.
The PE ratio chart covers all ordinary shares on the Jamaica Stock Exchange, grouped by industry, allowing for easy comparisons within a sector and the overall market. The EPS & PE ratios are based on 2023 and 2024 actual or projected earnings, excluding major one off items.
Pertinent information is required to navigate numerous investment options successfully in the stock market. The ICInsider.com PE ratio chart and more detailed daily charts provide investors with regularly updated information to help decision-making.
 The chart should be used in making rational decisions when investing in stocks close to the average for the sector, not going too far from it unless there are compelling reasons to do so. This approach helps to remove emotions from investment decisions and place them on fundamentals while at the same time not being too far from the majority of investors. Investors who buy when the price of a stock is close to the average will find that they are not inclined to overpay for a stock.
The net asset value of each company is incorporated into the chart. Investors can use this measure in assessing stock values. The chart also shows daily changes in stock prices and the percentage year to date price movement based on the last traded prices.
Dividends that are paid or are due to be paid and yields for each company are shown in the Main and Junior Markets’ daily report charts, along with the closing volume of the highest bid and the lowest offer for each company.
Nice gains for Junior Market
Rising stocks moved the Junior Market of the Jamaica Stock Exchange higher at the close on Thursday, after trading in 41 securities compared with 40 on Wednesday and ended with prices of 19 rising, 13 declining and nine ending unchanged with a 167 percent rise in the volume and 264 percent jump in the value of stocks traded, over Wednesday.
 Trading closed with an exchange of 6,869,011 shares for $15,510,430 compared with 2,576,485 units at $4,262,470 on Wednesday.
Trading averaged 167,537 shares at $378,303 up from 64,412 units at $106,562 on Wednesday. Trading for the month to date, averages 376,281 stock units at $774,486 compared with 388,998 shares at $798,622 on the previous day as well as June that ended with an average of 318,732 units at $696,979.
Jamaican Teas led trading with 2.06 million shares for 30 percent of total volume followed by JFP Ltd with 1.09 million units for 15.8 percent of the day’s trade and Fosrich with 936,403 units for 13.6 percent market share.
At the close of trading, the Junior Market Index increased 21.67 points to end the day at 3,672.89.
The Junior Market ended with an average PE Ratio of 12.4, based on last traded prices in conjunction with earnings projected by ICInsider.com for the financial years ending around August 2025.
 Investor’s Choice bid-offer indicator shows five stocks ended with bids higher than their last selling prices and four with lower offers.
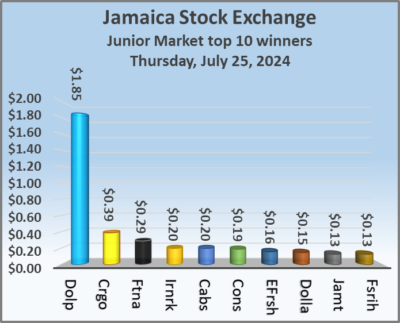
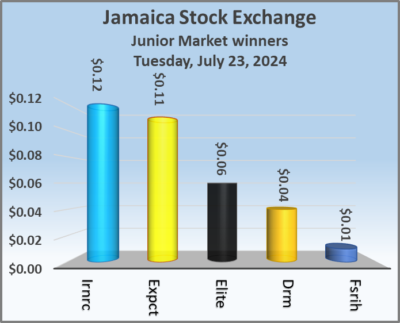
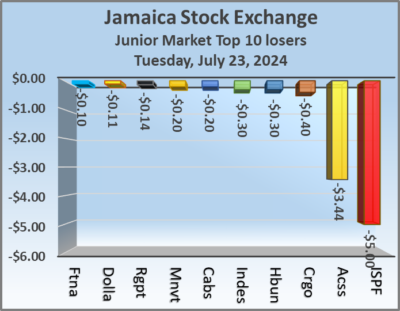
At the close of the market, Blue Power slipped 8 cents and ended at $4.30 with investors trading 9 stock units, CAC 2000 declined 74 cents to close at a 52 weeks’ low of $2.20 with 7,400 shares clearing the market, Cargo Handlers rallied 39 cents to $12.40 after an exchange of 26 units. Caribbean Assurance Brokers popped 20 cents in closing at $3.63, with 5,491 stocks crossing the market, Consolidated Bakeries rallied 19 cents to finish at $2.19 after trading 4,595 units, Derrimon Trading lost 5 cents to end at $1.99 in an exchange of 21 stocks. Dolla Financial increased 15 cents to $2.78 with investors trading 165,495 shares, Dolphin Cove climbed $1.85 and ended at $23, with 2,625 stock units crossing the market, Elite Diagnostic dropped 13 cents to close at $1.46 after an exchange of 16,990 shares.  Everything Fresh rose 16 cents to end at $1.98 after 74,132 stocks passed through the market, Fontana gained 29 cents in closing at $8.30 with an exchange of 80,608 units, Fosrich popped 13 cents to finish at $2.30, with 936,403 stock units changing hands. Honey Bun fell 5 cents and ended at $8.55 with traders dealing in 11,178 shares, Indies Pharma slipped 24 cents to $2.30 in an exchange of 144,112 stock units, Iron Rock Insurance gained 20 cents to close at $2.50 with investors dealing in 36,000 units. Jamaican Teas rose 13 cents to finish at $2.40 with a transfer of 2,063,349 stocks, JFP Ltd advanced 5 cents in closing at $1.08 and closed after 1,085,537 units changed hands, Lasco Financial sank 13 cents to end at $1.71 in trading 1,504 shares. Limners and Bards climbed 5 cents to $1.55 with 408,899 stock units crossing the exchange, Lumber Depot increased 5 cents to end at $2.80 in switching ownership of 239,648 stocks,
 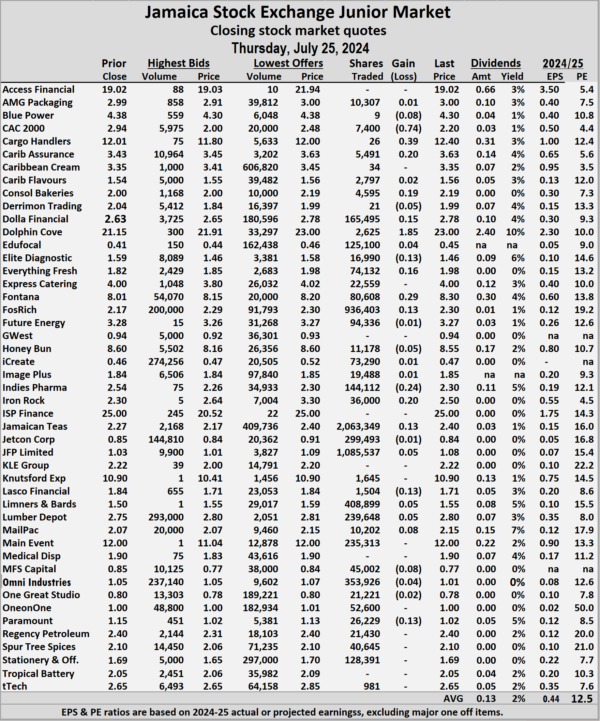 Mailpac Group rallied 8 cents in closing at $2.15 as investors exchanged 10,202 shares. MFS Capital Partners skidded 8 cents and ended at a 52 weeks’ low of 77 cents after a transfer of 45,002 units and Paramount Trading shed 13 cents to finish at $1.02 with investors swapping 26,229 stocks.
Prices of securities trading are those for the last transaction of each stock unless otherwise stated.
Main & Junior markets rise as trading climbs
The Main and Junior markets of the Jamaica Stock Exchange rose at the close of trading on Thursday as the JSE USD market closed moderately lower as trading ended with the number of stocks and the value changing hands rising over the previous day and resulting in prices of 36 shares rising and 30 declining.
 At the close of trading, the JSE Combined Market Index climbed 496.48 points to 326,056.47, the All Jamaican Composite Index rallied 1,667.39 points to 354,910.05, the JSE Main Index rose 358.22 points to 313,422.34. The Junior Market Index popped 21.67 points to 3,672.89 and the JSE USD Market Index fell 3.15 points to end trading at 224.87.
At the close of trading, 19,944,044 shares were exchanged in all three markets, up from 7,685,373 units on Wednesday, with the value of stocks traded on the Junior and Main markets amounted to $84.8 million, well over the $58.43 million on the previous trading day and the JSE USD market closed with an exchange of 200,309 shares for US$13,942 compared to 25,171 units at US$2,096 on Wednesday.
In Main Market activity, Wigton Windfarm led trading with 6.79 million shares followed by Transjamaican Highway with 3.16 million stocks and Lasco Manufacturing with 516,282 units.
In Junior Market trading, Jamaican Teas led trading with 2.06 million shares followed by JFP Ltd with 1.09 million units and Fosrich with 936,403 stocks.
In the preference segment, Jamaica Public Service 9.5% rallied $2 to $2,699.
 The market’s PE ratio, the most popular measure used to value stocks, ended at 19.8 on 2023-24 earnings and 13.5 times those for 2024-25 at the close of trading. ICInsider.com PE ratio chart and more detailed daily charts provide investors with regularly updated information to help decision-making.
The PE ratio chart covers all ordinary shares on the Jamaica Stock Exchange, grouped by industry, allowing for easy comparisons within a sector and the overall market. The EPS & PE ratios are based on 2023 and 2024 actual or projected earnings, excluding major one off items.
Pertinent information is required to navigate numerous investment options successfully in the stock market. The ICInsider.com PE ratio chart and more detailed daily charts provide investors with regularly updated information to help decision-making.
The chart should be used in making rational decisions when investing in stocks close to the average for the sector, not going too far from it unless there are compelling reasons to do so. This approach helps to remove emotions from investment decisions and place them on fundamentals while at the same time not being too far from the majority of investors. Investors who buy when the price of a stock is close to the average will find that they are not inclined to overpay for a stock.
 The net asset value of each company is incorporated into the chart. Investors can use this measure in assessing stock values. The chart also shows daily changes in stock prices and the percentage year to date price movement based on the last traded prices.
Dividends that are paid or are due to be paid and yields for each company are shown in the Main and Junior Markets’ daily report charts, along with the closing volume of the highest bid and the lowest offer for each company.
Junior Market popped higher Wednesday
Trading activity fell sharply at the close of the Junior Market of the Jamaica Stock Exchange on Wednesday, with a 74 percent drop in the volume of stocks traded, with an 83 percent lower value than on Tuesday with trading in 40 securities compared with 41 on Tuesday and ending with prices of 15 rising, 18 declining and seven closing unchanged.
 The market ended with 2,576,485 shares trading at $4,262,470 down from 9,854,162 units at $24,889,108 on Tuesday.
Trading averaged 64,412 shares at $106,562, down from 240,345 stocks at $607,051 on Tuesday with trading for the month to date, averaging 388,998 units at $798,622 versus 409,509 stock units at $842,354 on the previous day compared to June with an average of 318,732 units at $696,979.
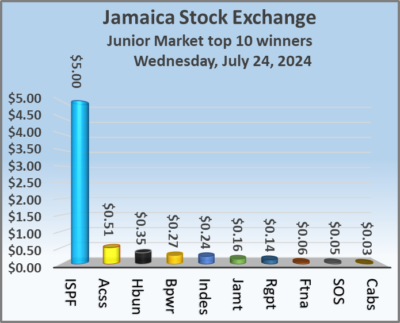
EduFocal led trading with 1.03 million shares for 40.1 percent of total volume followed by Dolla Financial with 460,385 units for 17.9 percent of the day’s trade and iCreate with 202,733 units for 7.9 percent market share.
At the close of trading, the Junior Market Index advanced 10.46 points to conclude trading at 3,651.22.
The Junior Market ended trading with an average PE Ratio of 12.4, based on last traded prices in conjunction with earnings projected by ICInsider.com for the financial years ending around August 2025.
 Investor’s Choice bid-offer indicator shows 10 stocks ended with bids higher than their last selling prices and four with lower offers.
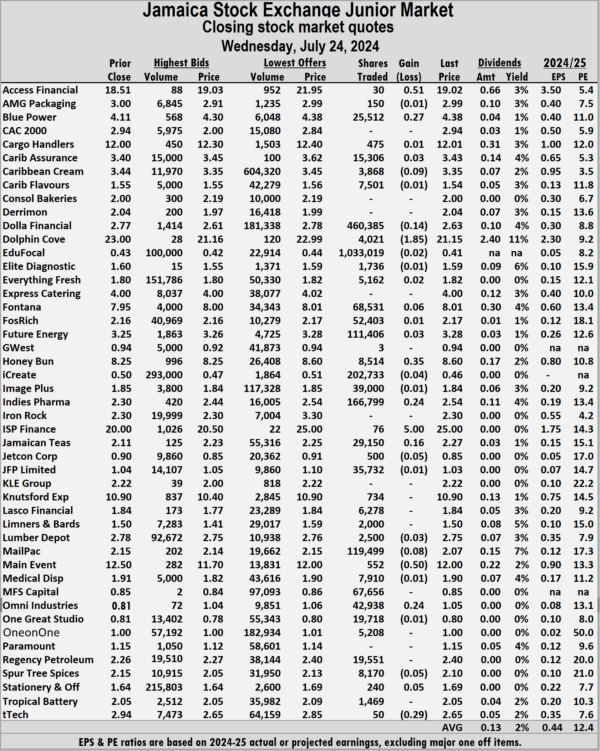
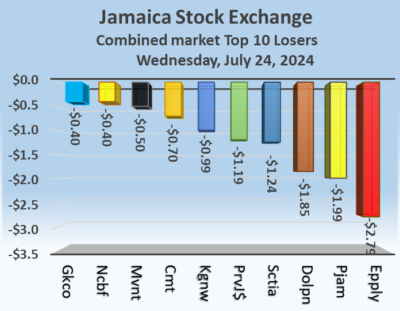
At the close, Access Financial rose 51 cents in closing at $19.02 with an exchange of 30 stocks, Blue Power rallied 27 cents to $4.38 and closed after an exchange of 25,512 units, Caribbean Cream declined 9 cents to finish at $3.35 with traders dealing in 3,868 shares. Dolla Financial sank 14 cents and ended at $2.63 with 460,385 stocks clearing the market, Dolphin Cove dropped $1.85 to close at $21.15 with a transfer of 4,021 shares, Fontana popped 6 cents to end at $8.01, with 68,531 units crossing the exchange. Honey Bun gained 35 cents to end at $8.60 in trading 8,514 stocks, Indies Pharma increased 24 cents to end at $2.54, with 166,799 stock units crossing the market, ISP Finance climbed $5 in closing at $25 after a transfer of 76 shares. Jamaican Teas rose 16 cents t0 $2.27 after 29,150 units passed through the market, 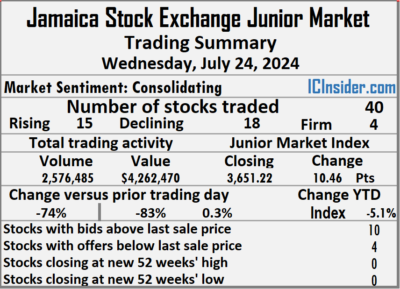 Jetcon Corporation fell 5 cents to close at 85 cents in switching ownership of 500 stocks, Mailpac Group skidded 8 cents to finish at $2.07 after an exchange of 119,499 stock units. Main Event sank 50 cents to close at $12, with 552 shares crossing the market, Regency Petroleum popped 14 cents to finish at $2.40 with investors swapping 19,551 units, Spur Tree Spices slipped 5 cents and ended at $2.10 in an exchange of 8,170 stock units. Stationery and Office Supplies advanced 5 cents to close at $1.69 after investors ended trading 240 stock units and tTech lost 29 cents to end at $2.65 as investors exchanged 50 shares.
 Prices of securities trading are those for the last transaction of each stock unless otherwise stated.
Trading drops on Jamaica Stocks Exchange
On another day of moderate activity, the Jamaica Stock Exchange, the volume and value of stocks traded fell well below Tuesday’s levels and resulted in the Main Market primary indices as the Junior Market and the JSE USD market recorded modest gains with the market closing with prices of 30 shares rising and 37 declining.
 At the close of the market, the JSE Combined Market Index fell 752.92 points to close at 325,559.99, the All Jamaican Composite Index slipped 1,518.48 points to 353,242.66, the JSE Main Index slipped 863.93 points to 313,064.12. The Junior Market Index rose 10.46 points to 3,651.22 and the JSE USD Market Index advanced 1.67 points to cease trading at 228.02.
At the close of trading, 7,685,373 shares were exchanged in all three markets, down from 22,053,861 units on Tuesday, with the value of stocks traded on the Junior and Main markets amounted to $58.43 million, well below the $86.67 million on the previous trading day and the JSE USD market closed with an exchange of 25,171 shares for US$2,096 compared to 484,869 units at US$42,958 on Tuesday.
In Main Market activity, Wisynco Group led trading with 2.21 million shares followed by Transjamaican Highway with 1.08 million stocks and Wigton Windfarm with 467,244 units.
In Junior Market trading, EduFocal led trading with 1.03 million shares followed by Dolla Financial with 460,385 stocks for 17.9 percent of the day’s trade and iCreate with just 202,733 units.
 In the preference segment, Sygnus Credit Investments C10.5 percent popped $9.04 to end at $100.
The market’s PE ratio, the most popular measure used to value stocks, ended at 19.8 on 2023-24 earnings and 13.4 times those for 2024-25 at the close of trading. ICInsider.com PE ratio chart and the more detailed daily charts provide investors with regularly updated information to help decision-making.
The PE ratio chart includes all of the ordinary shares on the Jamaica Stock Exchange, grouped by industry, allowing for easy comparisons within a sector and the overall market. The EPS & PE ratios are based on 2023 and 2024 actual or projected earnings, excluding major one off items.
Pertinent information is required to navigate numerous investment options successfully in the stock market. The ICInsider.com PE ratio chart and more detailed daily charts provide investors with regularly updated information to help decision-making.
The chart should be used in making rational decisions when investing in stocks close to the average for the sector, not going too far from it unless there are compelling reasons to do so. This approach helps to remove emotions from investment decisions and place them on fundamentals while at the same time not being too far from the majority of investors. 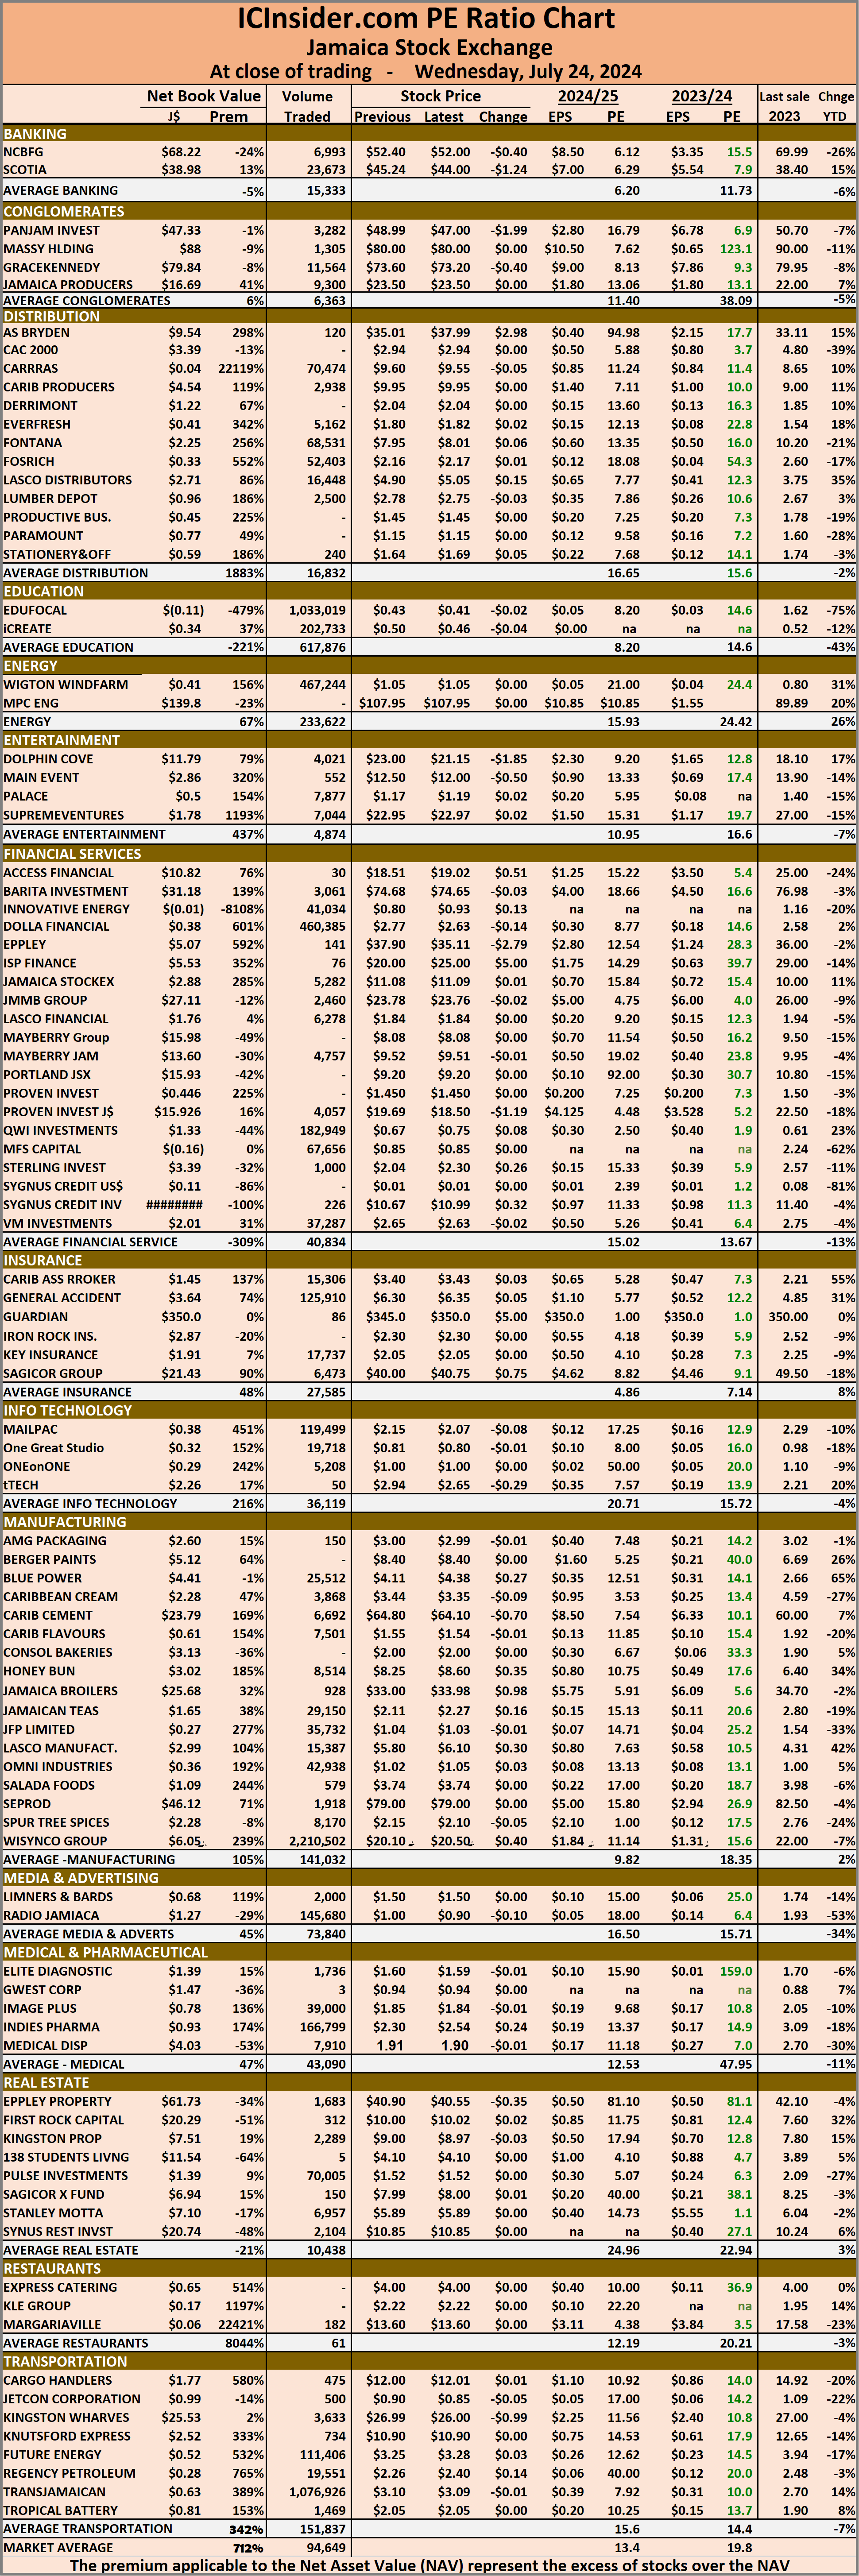 Investors who buy when the price of a stock is close to the average will find that they are not inclined to overpay for a stock.
The net asset value of each company is incorporated into the chart. Investors can use this measure in assessing stock values. The chart also shows daily changes in stock prices and the percentage year to date price movement based on the last traded prices.
Dividends that are paid or are due to be paid and yields for each company are shown in the Main and Junior Markets’ daily report charts, along with the closing volume of the highest bid and the lowest offer for each company.
Blow out profit for Iron Rock
Insurance revenues jumped 40 percent to $1.4 billion and net profit surged 150 percent to $84 million at Iron Rock Insurance for 2023 as insurance results climbed from $63 million to $120 and Investments delivered slightly higher gains of $79 million rising from $64 million in 2022, the company’s long-delayed audited financial statements show.

Operating expenses rose 14.4 percent from $104 million to $119 million as the company generated 39 cents in earnings per share for the year, up from 16 cents in 2022. ICInsider.com had a forecast of 32 cents.
At the end of 2023, shareholders’ equity stood at $748 million. Investments was $630 million, with reinsurance assets of $427 million and Insurance liabilities of $777 million.
The company improved its performance in the March quarter this year, with revenues rising by 29 percent to $401 million. Return on investments rose to $29 from $16 million in 2023. Other operating expenses climbed from $30 million to $37 million. A profit of $5.5 was realised, up from a $12 million loss in 2023, with earnings per share of 3 cents.
At the end of 2023, shareholders’ equity rose to $756 million. Investments stood at $719 million, with reinsurance assets of $312 million and Insurance liabilities of $735 million.
Iron Rock generated positive cash flows of $45 million in the quarter and $254 million for the 2023 fiscal year.
The stock was in the ICTOP10 Junior Market listing but was dropped following the suspension of trading but with projections of 55 cents per share for 2024 it will most likely be back, subject to stock price by week end.
The stock rose 12 cents on Tuesday to $2.30, with just three offers amounting to 115,000 shares, with 7,004 units at $3.30 up to $4.36.
With projected earnings of 55 cents per share, the PE ratio at the last price is just 4.2 times earnings, well below the market average of 12.4.
Winners hard to find on Junior Market
A mere five stocks recorded gains on Tuesday, following trading in 41 securities up from 43 on Monday with prices of 22 declining and 14 closing unchanged, however, the Investor’s Choice bid-offer indicator is flashing positive developments for trading activity on the Junior Market of the Jamaica Stock Exchange on Wednesday, as the market ended with a 132 percent surge in the volume of stocks traded, with a 331 percent greater value than Monday.
 The market closed on Tuesday with trading of 9,854,162 stock units for $24,889,108 compared to 4,251,907 shares at $5,779,055 on Monday.
Trading averaged 240,345 shares at $607,051 up from 98,882 units at $134,397 on Monday with the month to date, averaging 409,509 units at $842,354 compared to 421,225 stock units at $858,650 on the previous day and June with an average of 318,732 units at $696,979.
JFP Ltd led trading with 2.40 million shares for 24.4 percent of total volume followed by EduFocal with 2.26 million stocks for 22.9 percent of the day’s trade, Fontana ended with 1.72 million units for 17.4 percent market share and Dolla Financial with 1.03 million shares for 10.4 percent of total volume.
At the close of trading, the Junior Market Index dropped 30.30 points to close at 3,640.76.
 The Junior Market ended trading with an average PE Ratio of 12.4, based on last traded prices in conjunction with earnings projected by ICInsider.com for financial years ending around August 2025.
Investor’s Choice bid-offer indicator shows 10 stocks ended with bids higher than their last selling prices and five with lower offers.
At the close, Access Financial shed $3.44 to end at $18.51 with investors dealing in 1,500 stock units, Cargo Handlers sank 40 cents to $12 with 2,100 shares crossing the market, Caribbean Assurance Brokers dipped 20 cents to $3.40 as investors traded 5,120 stocks. Dolla Financial sank 11 cents to finish at $2.77 and closed with an exchange of 1,026,165 units, Express Catering climbed 11 cents and ended at $4 with investors trading 115,457 shares, Fontana slipped 10 cents to close at $7.95 after 1,717,590 stocks passed through the market. 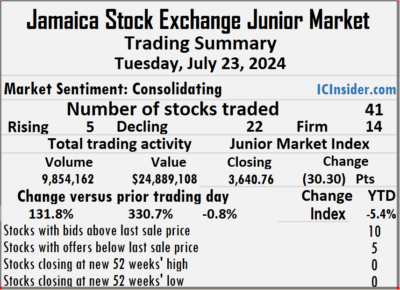 Honey Bun fell 30 cents to $8.25 in trading 9,696 units, Indies Pharma skidded 30 cents to close at $2.30, with 158,642 stock units crossing the exchange, following the lifting of the suspension of trading, Iron Rock Insurance increased 12 cents to finish at $2.30 with traders dealing in just one stock with the company posting big gains in profit for the 2023 fiscal year and the first quarter to March. ISP Finance lost $5 and ended at $20, with 2,000 stocks clearing the market, JFP Ltd declined 10 cents in closing at $1.04 with an exchange of 2,402,260 units, Limners and Bards dipped 9 cents to end at $1.50 after investors ended trading 5,000 stock units. Main Event fell 20 cents in closing at $12.50 with a transfer of 30,021 shares and Regency Petroleum dropped 14 cents to $2.26, with 24,424 stocks changing hands.
 Prices of securities trading are those for the last transaction of each stock unless otherwise stated.
Main Market rises Junior & USD Markets fall
Trading picked up on the Jamaica Stock Exchange on Tuesday, with the volume of stocks changing hands climbing, with the value of stocks traded jumping sharply over the previous day and resulting in prices of just 18 shares rising and 44 declining, with the Main Market closing higher and the Junior and JSE USD markets closing lower.
 At the close of trading, the JSE Combined Market Index climbed 108.87 points to 326,312.91, the All Jamaican Composite Index rallied 1,008.75 points to 354,761.14, the JSE Main Index popped 338.01 points to close at 313,928.05. The Junior Market Index sank 30.30 points to close trading at 3,640.76 and the JSE USD Market Index slipped 0.44 points to 226.35.
At the close of trading, 22,053,861 shares were exchanged in all three markets, similar to 22,027,669 units on Monday, with the value of stocks traded on the Junior and Main markets amounted to $86.67 million, well over the $34.8 million on the previous trading day and the JSE USD market closed with an exchange of 484,869 shares for US$42,958 compared to 36,773 units at US$4,077 on Monday.
In Main Market activity, 138 Student Living led trading with 4.95 million shares followed by Wigton Windfarm with 2.52 million stock units and Transjamaican Highway with 850,644 units.
In Junior Market trading, JFP Ltd led trading with 2.40 million shares followed by EduFocal with 2.26 million stock units, Fontana ended with 1.72 million units and Dolla Financial with 1.03 million shares.
 In the preference segment, Sygnus Credit Investments C10.5% sank $16.04 and ended at $90.96.
The market’s PE ratio, the most popular measure used to value stocks, ended at 19.9 on 2023-24 earnings and 13.5 times those for 2024-25 at the close of trading. ICInsider.com PE ratio chart and more detailed daily charts provide investors with regularly updated information to help decision-making.
The PE ratio chart covers all ordinary shares on the Jamaica Stock Exchange, grouped by industry, allowing for easy comparisons within a sector and the overall market. The EPS & PE ratios are based on 2023 and 2024 actual or projected earnings, excluding major one off items.
Pertinent information is required to navigate numerous investment options successfully in the stock market. The ICInsider.com PE ratio chart and more detailed daily charts provide investors with regularly updated information to help decision-making.
The chart should be used in making rational decisions when investing in stocks close to the average for the sector, not going too far from it unless there are compelling reasons to do so. This approach helps to remove emotions from investment decisions and place them on fundamentals while at the same time not being too far from the majority of investors.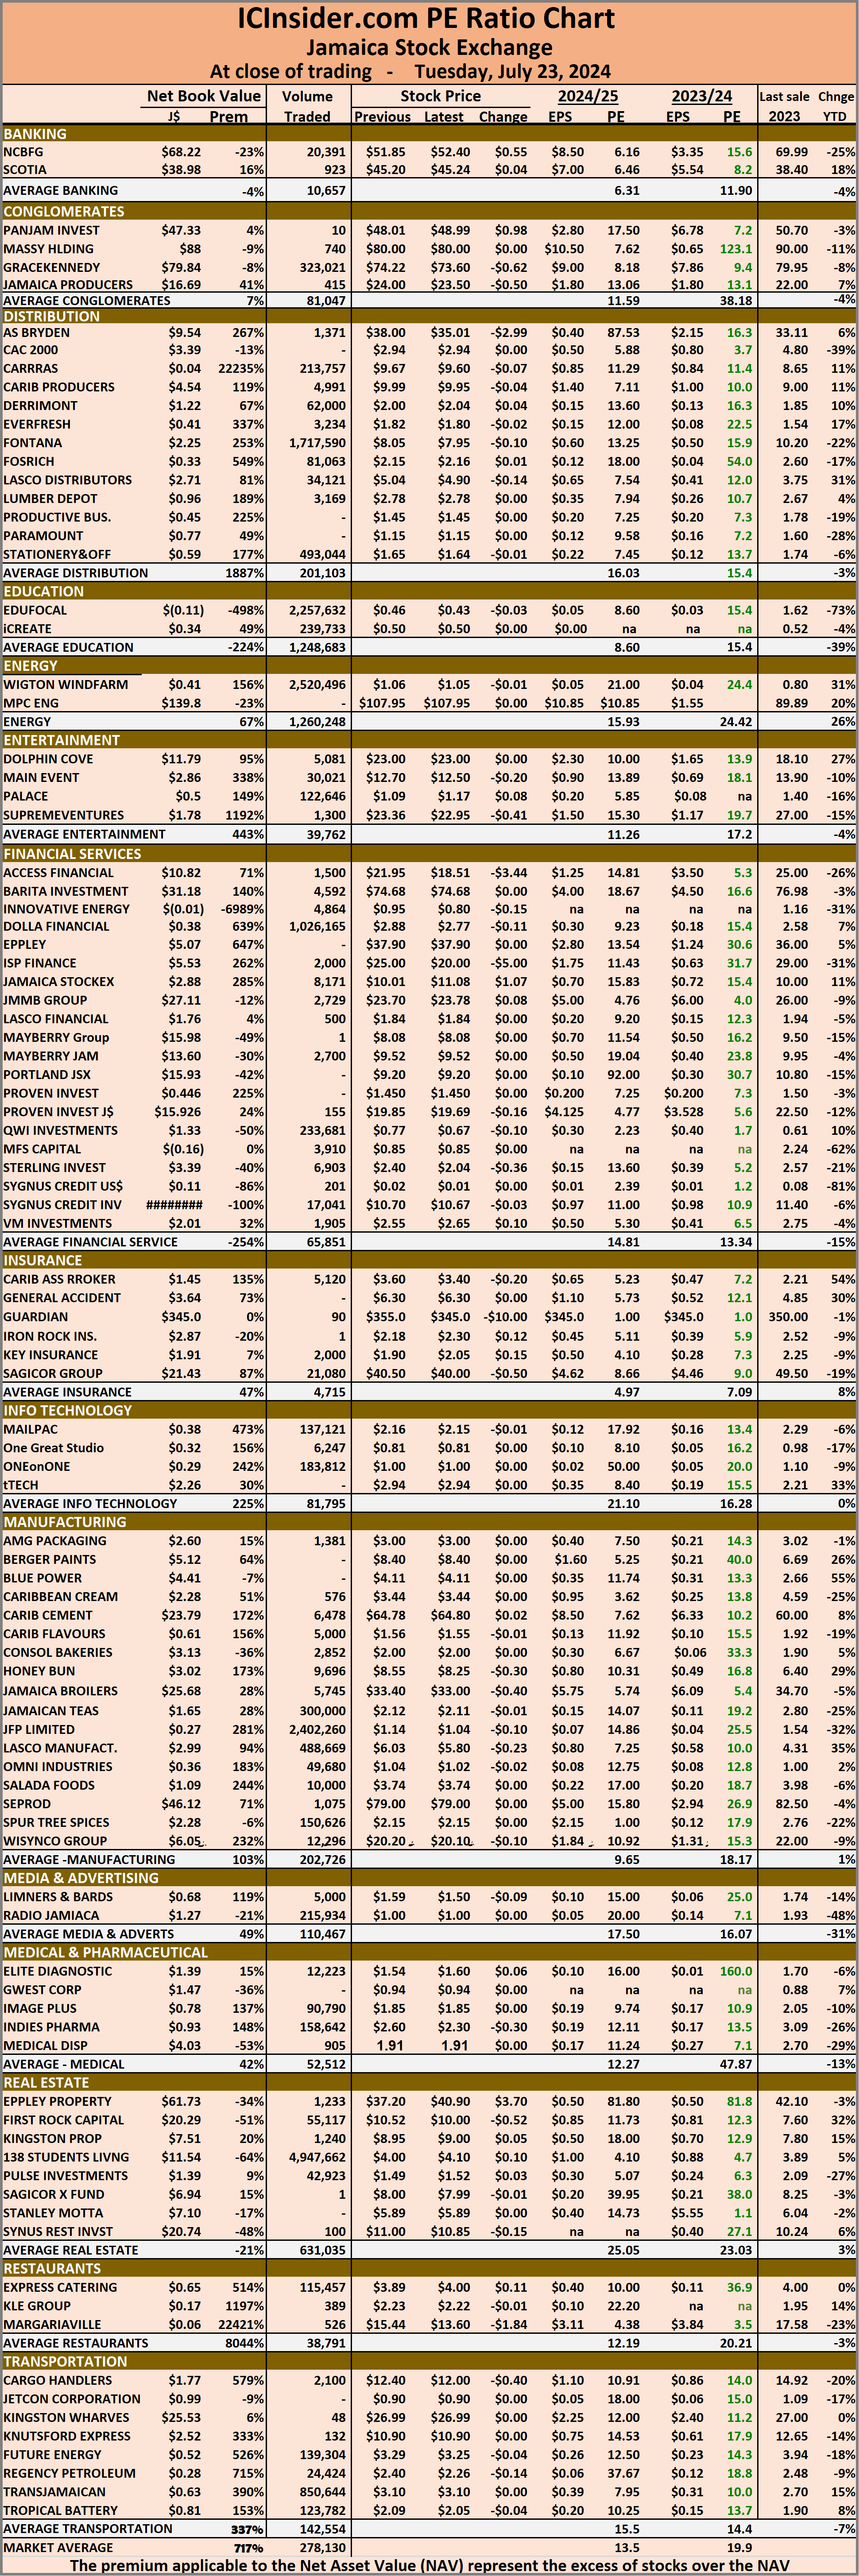 Investors who buy when the price of a stock is close to the average will find that they are not inclined to overpay for a stock.
The net asset value of each company is incorporated into the chart. Investors can use this measure in assessing stock values. The chart also shows daily changes in stock prices and the percentage year to date price movement based on the last traded prices.
Dividends that are paid or are due to be paid and yields for each company are shown in the Main and Junior Markets’ daily report charts, along with the closing volume of the highest bid and the lowest offer for each company.