The Jamaica Stock Exchange Main market recorded gains on Monday with all three Main Market indices closing higher but the Junior Market fell. The Combined Index added 923.92 points to end at 404,421.17, the All Jamaican Composite Index rose 1,252.31 points to 443,919.06 as trading in the Main Market jumped sharply over Monday and the JSE  Main Index climbed 1,248.85 points to end at 392,406.78 on a day when JMMB Group traded at a new high of $60 resulting in the circuit breaker being triggered and the stock ended at a 52 weeks’ closing high of $54.
Trading slipped in trading on the Junior Market with the index falling 27.63 points to end at 4,171.59.
Mayberry Jamaican Equities was the lead trade for the day with 100 million shares.
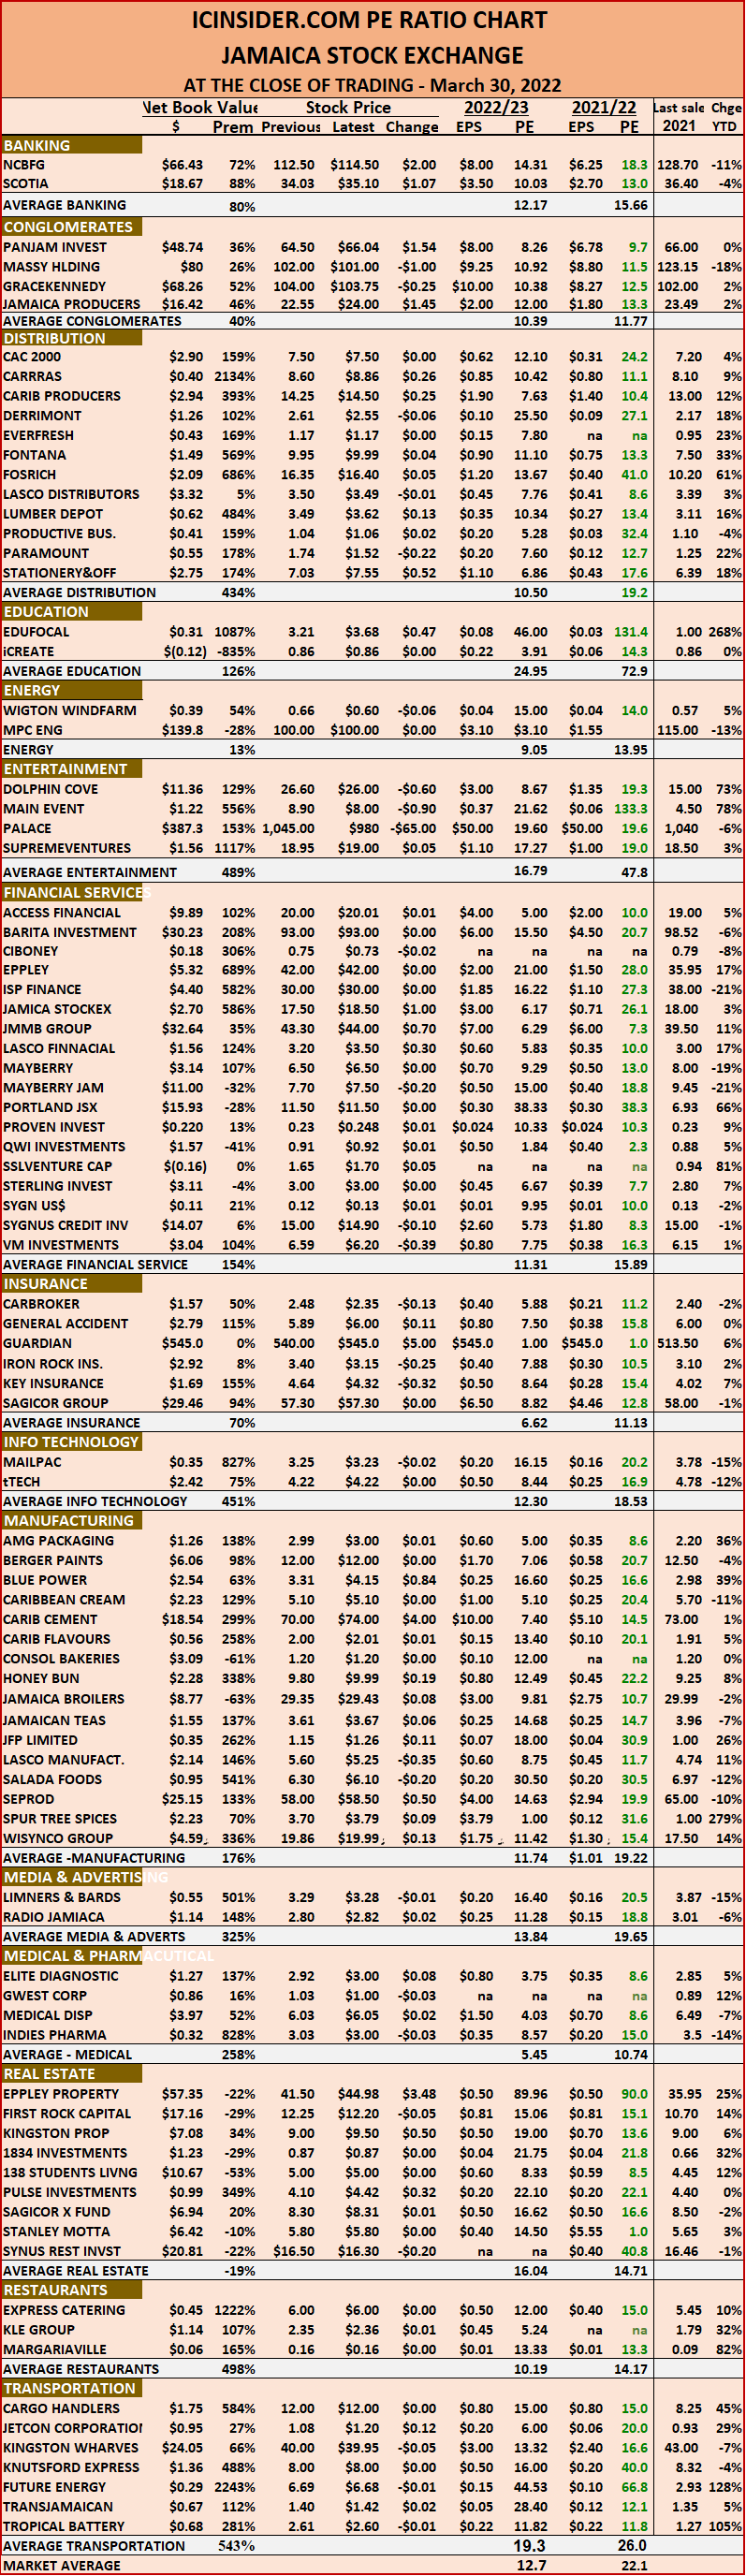
The market’s PE ratio ended at 23.1 based on 2021-22 earnings and 13.1 times those for 2022-23 at the close of the Jamaica Stock Exchange.
Investors need a series of measures and pertinent information to successfully navigate the many investment choices in the local stock market. The ICInsider.com PE ratio chart and the more detailed daily report charts provide investors with regularly updated information to help with decision-making.
Investors should make use of the chart to help make rational investment decisions by investing in stocks that are close to the average for the sector and not going too far from it unless there are compelling reasons to do so. 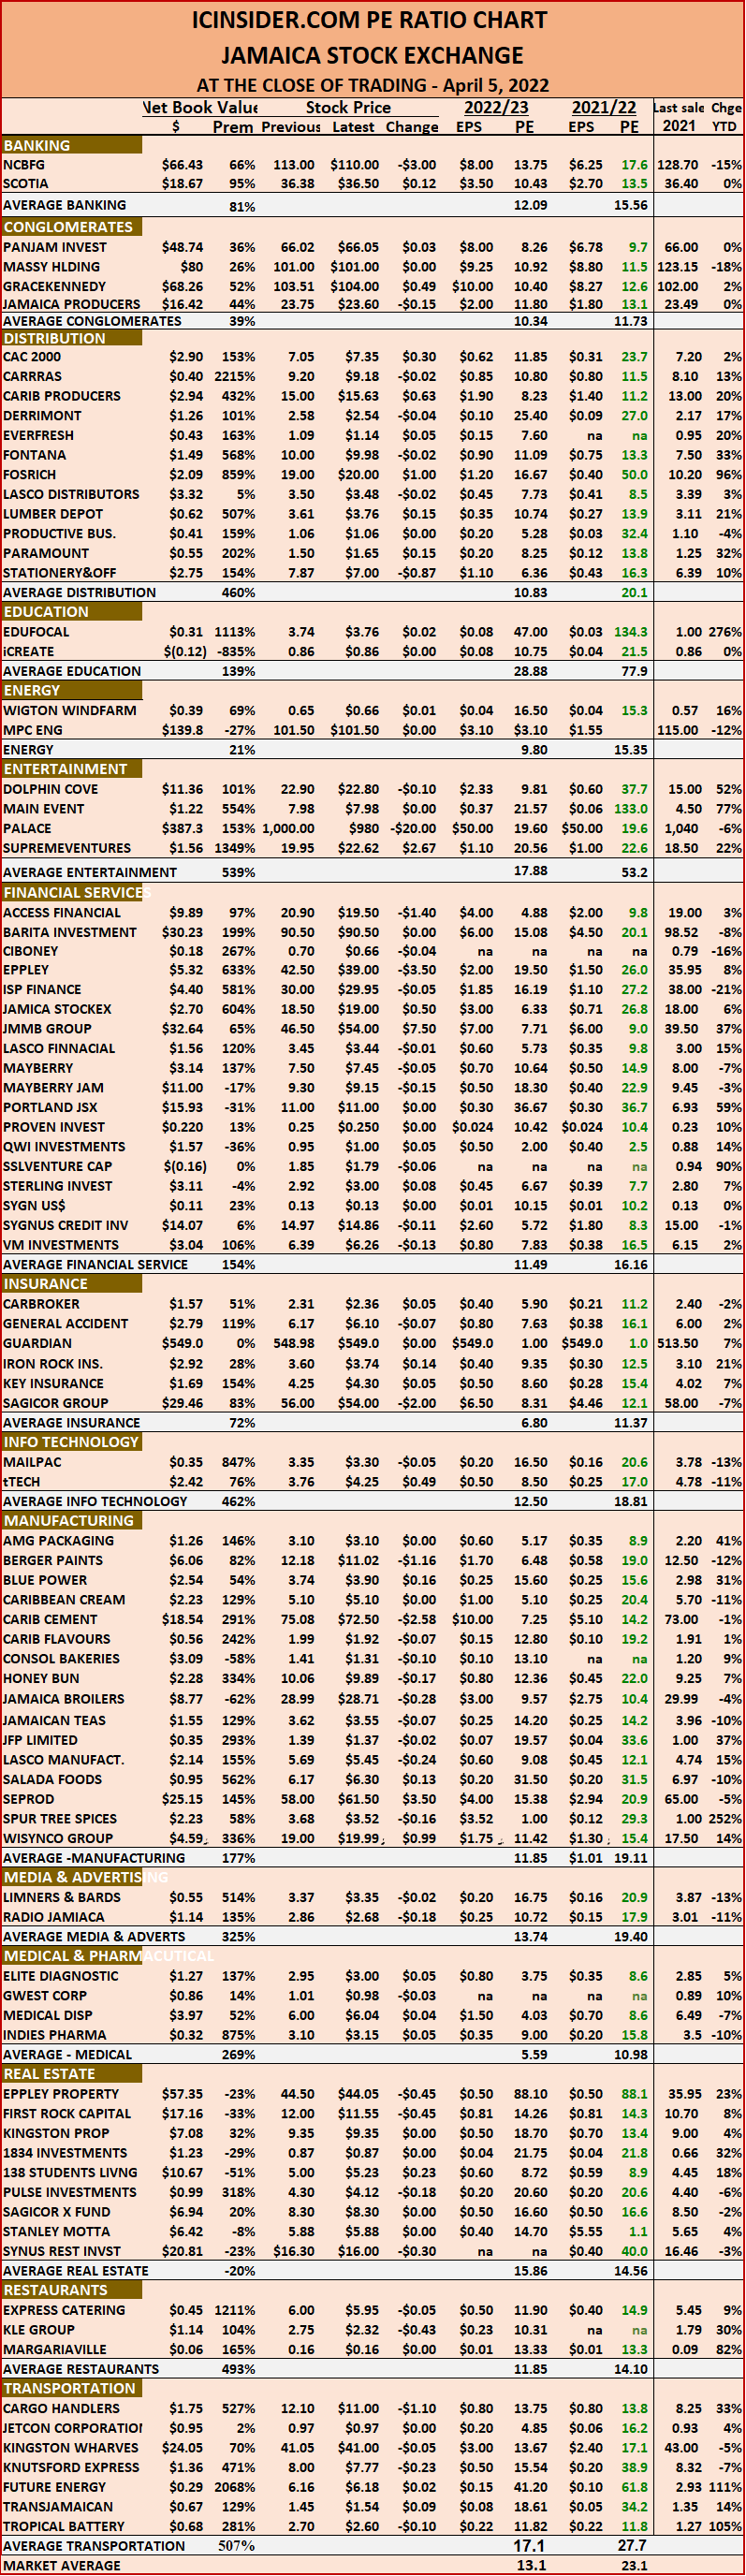 This approach helps to take emotions out of the investment decision and put in on fundamentals while at the same time not being too far from the majority of investors. Investors who buy when the price of a stock is close to the average will find that they are not inclined to overpay for a stock.
The ICInsider.com PE Ratio chart covers all ordinary shares listed on the Jamaica Stock Exchange. It shows companies grouped on an industry basis, allowing easy comparisons between the same sector companies and the overall market.
The net asset value of each company is reported as a guide to assess the value of stocks based on this measure quickly. The chart also shows daily changes in stock prices and the percentage year to date price movement based on the last traded prices. Dividends payable and yields for each company are shown in the Main and Junior Markets’ daily report charts that show closing volume for the bids and offers.
The EPS & PE ratios are based on 2021 and 2022 actual or projected earnings, excluding major one off items. The PE Ratio is the most popular measure used to determine the value of stocks.
Trading jumps sharply on JSE Main Market
Juniors gain on 2nd trading day in April
Trading closed on Monday, with the volume of stocks traded declining by 59 percent, with a 49 percent lower value than on Friday at the close of the Jamaica Stock Exchange Junior Market, after 43 securities traded down from 41 on Friday, with 22 rising, 16 declining and five closing unchanged.
 At the close, the Junior Market Index advanced 13.32 points to settle at 4,199.22.
The PE Ratio, a measure used to compute appropriate stock values, averages 12.6 based on ICInsider.com earnings forecast for companies with financial years ending from August 2022 to August 2023.
A total of 8,658,067 shares traded for $49,169,751 compared to 20,898,865 units at $96,173,773 on Friday. Fosrich led trading with 1.19 million shares for 13.8 percent of total volume, followed by JFP Limited with 1.11 million units for 12.8 percent of the day’s trade and EduFocal with 829,274 units for 9.6 percent market share.
Trading averaged 201,350 shares at $1,143,483 in contrast to 509,728 shares at $2,345,702 on Friday, with month to date, averaging 351,868 units at $1,730,280 on Friday. March closed with an average of 719,276 units at $2,636,802.
Investor’s Choice bid-offer indicator shows one stock ended with a higher bid than the last selling price and four with lower offers.
At the close, Blue Power popped 34 cents in closing at $3.74 with 123 shares crossing the exchange,  Cargo Handlers declined 35 cents, ending at $12.10 after switching owners of 6,500 stocks, Caribbean Assurance Brokers shed 9 cents to end at $2.31 in an exchange of 214,474 units. Consolidated Bakeries climbed 16 cents to close at $1.41 after exchanging 174,125 stock units, Dolphin Cove popped 90 cents to $22.90 after an exchange of 253,504 shares, Express Catering fell 9 cents in closing at $6 after 356,802 units changed hands. Fontana rallied 9 cents to close at $10 with the swapping of 192,666 stocks, Fosrich advanced $1.98 to end at a 52 weeks’ closing high of $19 after 1,192,228 stock units changed hands, Future Energy Source dropped 13 cents to $6.16 after trading 534,016 units. General Accident rose 17 cents in ending at $6.17, with 15,958 stock units clearing the market, Indies Pharma increased 22 cents in closing at $3.10 in exchanging 97,081 stocks, JFP Limited gained 9 cents to end at $1.39 while exchanging 1,108,073 shares. Lasco Financial lost 7 cents to close at $3.45, with 126,807 shares crossing the market, Limners and Bards popped 12 cents to $3.37 in trading 13,013 stock units, Lumber Depot advanced 15 cents in ending at $3.61 with an exchange of 599,254 units.
 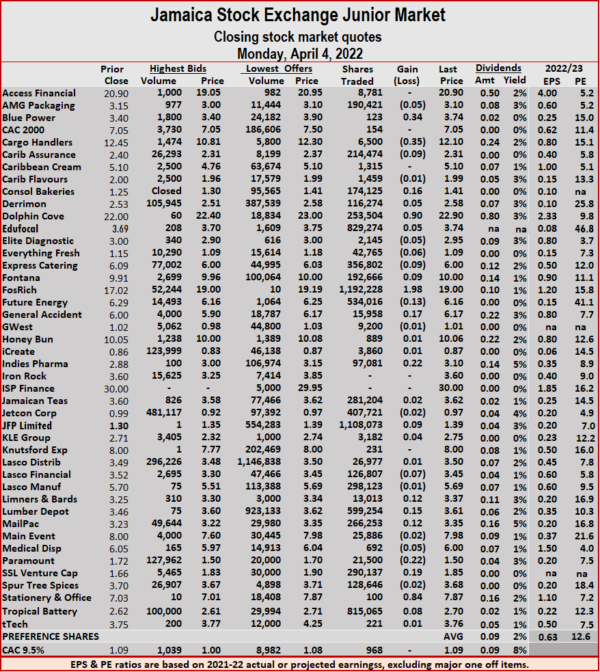 Mailpac Group rallied 12 cents to end at $3.35 after 266,253 stocks changed hands, Paramount Trading declined 22 cents to $1.50 after 21,500 units crossed the market, SSL Venture climbed 19 cents in ending at $1.85 after trading 290,137 shares. Stationery and Office Supplies increased 84 cents in closing at $7.87 in trading 100 stocks and Tropical Battery rose 8 cents to finish at a 52 weeks’ close of $2.70 with an exchange of 815,065 stock units.
Prices of securities trading are those for the last transaction of each stock unless otherwise stated.
JSE markets start week with gains
The Jamaica Stock Exchange recorded gains on Monday with all three Main Market indices closing higher and they were joined by the Junior Market. The Combined Index added 1,414.33 points to end at 403,497.25, the All Jamaican Composite Index rose 1,999.37 points to settle at 442,666.75 as trading in the Main Market slipped marginally from that on Friday and the JSE Main Index climbed 1384.40 points to end at 391157.93.
Trading plunged on the second day of trading on the Junior Market and ended, after adding 13.32 to end at 4,199.22.
The market’s PE ratio ended at 23 based on 2021-22 earnings and 13.1 times those for 2022-23 at the close of the Jamaica Stock Exchange.
Investors need a series of measures and pertinent information to successfully navigate the many investment choices in the local stock market. The ICInsider.com PE ratio chart and the more detailed daily report charts provide investors with regularly updated information to help with decision-making.
Investors should make use of the chart to help make rational investment decisions by investing in stocks that are close to the average for the sector and not going too far from it unless there are compelling reasons to do so.  This approach helps to take emotions out of the investment decision and put in on fundamentals while at the same time not being too far from the majority of investors. Investors who buy when the price of a stock is close to the average will find that they are not inclined to overpay for a stock.
The ICInsider.com PE Ratio chart covers all ordinary shares listed on the Jamaica Stock Exchange. It shows companies grouped on an industry basis, allowing easy comparisons between the same sector companies and the overall market.
The net asset value of each company is reported as a guide to assess the value of stocks based on this measure quickly. The chart also shows daily changes in stock prices and the percentage year to date price movement based on the last traded prices. Dividends payable and yields for each company are shown in the Main and Junior Markets’ daily report charts that show closing volume for the bids and offers.
The EPS & PE ratios are based on 2021 and 2022 actual or projected earnings, excluding major one off items. The PE Ratio is the most popular measure used to determine the value of stocks.
Bullishness rises on the JSE as 2022 ages
Trading levels are soaring at the Jamaica Stock Exchange in 2022 with the amount of funds passing through the Main Market for trading jumping 141 percent over 2021 with an exchange of $14.87 billion over the $6.16 billion in the first quarter of 2021, at the same time the Junior Market attracted 184 percent more funds for all three months amounting to $4.6 billion up from just $1.62 billion in 2021.
 New listings helped considerably in pushing the value of trading in the Junior Market in March but not significantly in January and February. March benefitting strongly from Spur Tree that was listed in January, accounting for $617 million, JFP Ltd with trading of just $160 million and EduFocal $286 million with the three accounting for $1.06 billion of the $1.84 billion increased trading in March over 2021. Spur Tree in January when it was listed accounted for $208 million and just $186 million in February.
The Main Market benefitted from the listing of Massey Holdings in January but has had a moderate impact on the value of stocks traded, with March showing the largest amount of $1 billion, with just $369 million in February and $150 million in January.
 Trading rose 145 percent in January 2022 over 2021 for the Junior Market to hit $979 million and 90 percent in February to $1.19 billion, with March enjoying a big 309 percent rise to $2.4 billion. In the Main Market trading rose 114 percent in January 2022 over 2021 to $2.7 billion, 66 percent in February to $3.64 billion and 215 percent to $8.5 billion in March.
Importantly, in both markets, the increases are reflected in higher value month over month suggesting that investors are getting increasingly more aggressive in trading stocks. The buoyancy in the market will swell revenues and profit in the first quarter for the JSE.
Two way price movement for Junior Market
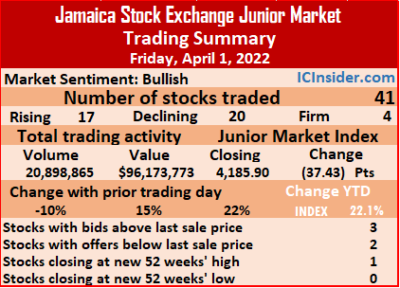
The volume of stocks traded slipped while the value rose on Friday over Thursday at the close of the Jamaica Stock Exchange Junior Market, leaving the market with more losses than gains with the market index falling to open the new month.
 Overall, 41 securities traded compared to 42 on Thursday, with 17 rising, 20 declining and four closing unchanged and left the Junior Market Index in decline with a loss of 37.43 points to settle at 4,185.90.
The PE Ratio, a measure used to compute appropriate stock values, averages 12.2 based on projected 2022-23 earnings. The PE ratio of each stock in the chart below is based on ICInsider.com earnings forecast for companies with financial years ending up to August 2023.
Some 20,898,865 shares traded for $96,173,773 versus 23,142,159 units at $83,667,452 on Thursday. Jamaican Teas led trading with 10.27 million shares for 49.1 percent of total volume, followed by Lasco Financial, 2.04 million units for 9.8 percent of the day’s trade and Lasco Manufacturing with 1.05 million units for 5 percent market share.
Trading averaged 509,728 shares at $2,345,702 in contrast to 551,004 shares at $1,992,082 on Thursday. March closed with an average of 719,276 units at $2,636,802.
Investor’s Choice bid-offer indicator shows three stocks ended with higher bids than their last selling prices and two with lower offers.
 At the close, Access Financial popped 40 cents to end at $20.90, with 93 shares crossing the market, AMG Packaging increased 15 cents to $3.15 in exchanging 501,246 stock units, Blue Power climbed 11 cents to $3.40 with the swapping of 512 units. Cargo Handlers rallied 45 cents to close at a 52 weeks’ high of $12.45 after trading 2,954 stocks, Derrimon Trading dropped 15 cents in closing at $2.53 and trading 334,399 stock units, Dolphin Cove fell $4.69 to $22 while exchanging 690,218 stocks, following the release of full year’s results to December last year. Fontana declined 7 cents in closing at $9.91 after 176,510 units changed hands, Fosrich shed $1.61 in ending at $17.02 after exchanging 88,339 shares and after the price hit an intraday high of $20, Honey Bun lost 23 cents to end at $10.05, with 77,350 shares crossing the exchange. Indies Pharma fell 21 cents to close at $2.88 after 204,763 stock units crossed the market, Iron Rock Insurance gained 40 cents to $3.60 with an exchange of 6,135 stocks, Jamaican Teas shed 8 cents in closing at $3.60 in trading 10,270,448 units. KLE Group advanced 35 cents to close at $2.71after trading 1,031 stock units, Knutsford Express rose 55 cents after ending at $8 in switching ownership of 1,000 units, Lasco Manufacturing popped 15 cents to end at $5.70 in an exchange of 1,046,863 stocks.
 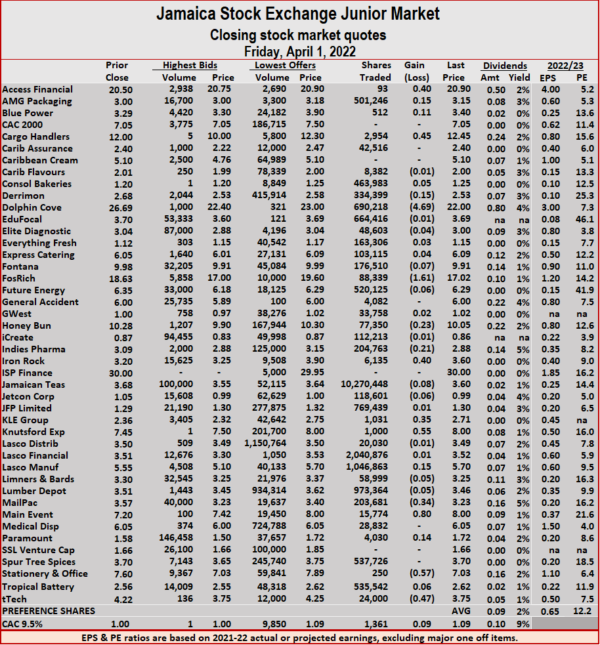 Mailpac Group dropped 34 cents to $3.23, with 203,681 shares clearing the market, Main Event rose 80 cents to close at $8 after an exchange of 15,774 stock units, Paramount Trading increased 14 cents to $1.72 after trading 4,030 shares. Stationery and Office Supplies declined 57 cents in closing at $7.03, with 250 units crossing the market and tTech lost 47 cents to end at $3.75 while exchanging 24,000 stocks following the release of poor 2021 full year results.
Prices of securities trading are those for the last transaction of each stock unless otherwise stated.
JSE markets slip into April
Stocks traded down at the close of the Jamaica Stock Exchange on Friday, with all three Main Market indices closing lower, with the Junior Market joining forces. The Combined Index fell 1,697.80 points to 402,082.92, the All Jamaican Composite Index dropped 1,990.84 points to 440,667.38, the JSE Main Index shed 2,207.57 points to end at 389,773.53 while the Junior Market fell 37.43 points to 4,185.90.
The market’s PE ratio ended at 22 based on 2021-22 earnings and 12.8 times those for 2022-23 at the close of the Jamaica Stock Exchange.
Investors need a series of measures and pertinent information to successfully navigate the many investment choices in the local stock market. The ICInsider.com PE ratio chart and the more detailed daily report charts provide investors with regularly updated information to help with decision-making.
Investors should make use of the chart to help make rational investment decisions by investing in stocks that are close to the average for the sector and not going too far from it unless there are compelling reasons to do so. This approach helps to take emotions out of the investment decision and put in on fundamentals while at the same time not being too far from the majority of investors. Investors who buy when the price of a stock is close to the average will find that they are not inclined to overpay for a stock.
 The ICInsider.com PE Ratio chart covers all ordinary shares listed on the Jamaica Stock Exchange. It shows companies grouped on an industry basis, allowing easy comparisons between the same sector companies and the overall market.
The net asset value of each company is reported as a guide to assess the value of stocks based on this measure quickly. The chart also shows daily changes in stock prices and the percentage year to date price movement based on the last traded prices. Dividends payable and yields for each company are shown in the Main and Junior Markets’ daily report charts that show closing volume for the bids and offers.
The EPS & PE ratios are based on 2021 and 2022 actual or projected earnings, excluding major one off items. The PE Ratio is the most popular measure used to determine the value of stocks.
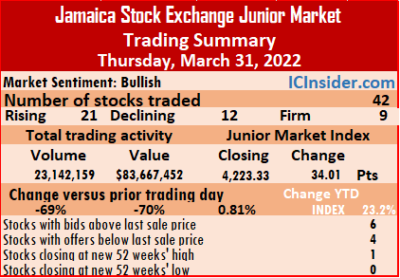
Junior Market Jumps 23%
Trading fell back from Wednesday’s surge at the close of the Junior Market on Thursday, with the volume of stocks traded dropping 69 percent as the value fell 70 percent from Wednesday’s levels, but the market ended with advancing stocks nearly doubling those declining and sent the market index 34.01 points higher to 4,223.33, with 23 percent gains for the year to date.
 Market activity led to 42 securities trading up from 40 on Wednesday with 21 rising, 12 declining and nine closing unchanged.
The PE Ratio, a measure used to compute appropriate stock values, averages 22.8. The PE ratio of each stock in the chart below is based on ICInsider.com earnings forecast for companies with financial years up to August 2022.
A total of 23,142,159 shares traded for $83,667,452 compared to 73,733,908 units at $274,328,558 on Wednesday, Spur Tree Spices led trading with 5.98 million shares for 25.9 percent of total volume, followed by Mailpac Group with 3.56 million units for 15.4 percent of the day’s trade and Future Energy Source with 2.63 million units for 11.4 percent market share, JFP Limited with 2.53 million units for 10.9 percent market share, Jetcon Corporation traded 2.18 million units for 9.4 percent market share and EduFocal ended with 1.63 million units for 7 percent market share.
 Thursday’s trading averaged 551,004 shares at $1,992,082 down from 1,843,348 shares at $6,858,214 on Wednesday with month to date, averaging 719,276 units at $2,636,802 compared to 727,308 units at $2,667,573 on the previous trading day. February closed with an average of 370,064 units at $1,402,517.
Investor’s Choice bid-offer indicator shows six stocks ended with bids higher than their last selling prices and four with lower offers.
At the close, Access Financial advanced 49 cents in closing at $20.50 after trading 319 shares, CAC 2000 fell 45 cents to close at $7.05 in exchanging 2,756 units, Derrimon Trading rallied 13 cents to $2.68 with 194,275 stock units changing hands. Dolphin Cove popped 69 cents to $26.69, with 190,176 stocks clearing the market, Fosrich rose $2.23 to end at a 52 weeks’ high of $18.63 with 100,544 shares changing hands, Future Energy Source declined 33 cents to end at $6.35 after 2,630,785 stock units were traded. Honey Bun gained 29 cents ending at $10.28, with 19,243 stocks crossing the exchange, Indies Pharma increased 9 cents to close at $3.09, trading 236,024 units, Jetcon Corporation shed 15 cents in closing at $1.05 while exchanging 2,182,003 stocks.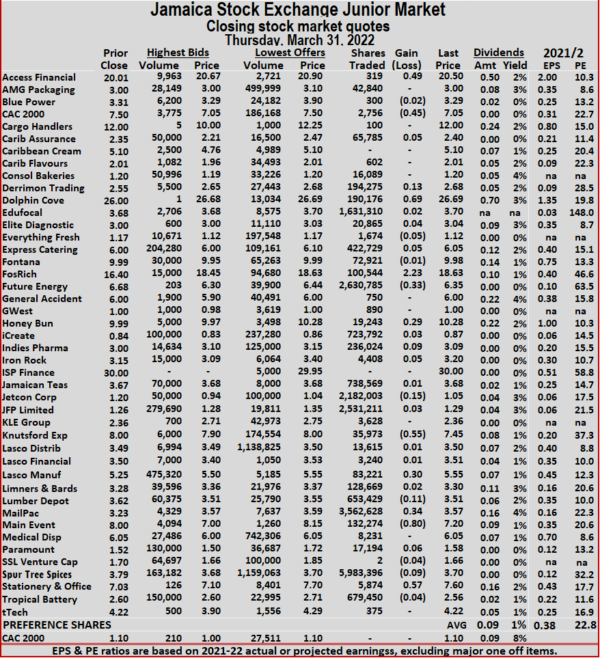 Knutsford Express lost 55 cents to $7.45 with the swapping of 35,973 units, Lasco Manufacturing climbed 30 cents to end at $5.55 in an exchange of 83,221 stock units, Lumber Depot dropped 11 cents to $3.51 with an exchange of 653,429 shares. Mailpac Group climbed 34 cents to close at $3.57 after exchanging 3,562,628 stocks, Main Event fell 80 cents in ending at $7.20 after 132,274 shares changed hands, Spur Tree Spices dropped 9 cents to $3.70 in switching ownership of 5,983,396 stock units and Stationery and Office Supplies gained 57 cents in closing at $7.60 in exchanging 5,874 units.
Prices of securities trading are those for the last transaction of each stock unless otherwise stated.
JSE finishes off March with sharp rally
The Jamaica Stock Exchange ended trading on Thursday with all three Main Market indices rising to close out March. The Combined Index climbed 2,368.79 points to 403.780.72, the All Jamaican Composite Index jumped 3,189.37 points to 442,658.22 and the JSE Main Index climbed 2,207.57 points to end at 391,231.96 while the Junior Market jumped 34.01 points to 4,223.33.
The market’s PE ratio ended at 22.1 based on 2021-22 earnings and 12.8 times those for 2022-23 at the close of the Jamaica Stock Exchange.
Investors need a series of measures and pertinent information to successfully navigate the many investment choices in the local stock market. The ICInsider.com PE ratio chart and the more detailed daily report charts provide investors with regularly updated information to help with decision-making.
Investors should make use of the chart to help make rational investment decisions by investing in stocks that are close to the average for the sector and not going too far from it unless there are compelling reasons to do so. This approach helps to take emotions out of the investment decision and put in on fundamentals while at the same time not being too far from the majority of investors. Investors who buy when the price of a stock is close to the average will find that they are not inclined to overpay for a stock.
 The ICInsider.com PE Ratio chart covers all ordinary shares listed on the Jamaica Stock Exchange. It shows companies grouped on an industry basis, allowing easy comparisons between the same sector companies and the overall market.
The net asset value of each company is reported as a guide to assess the value of stocks based on this measure quickly. The chart also shows daily changes in stock prices and the percentage year to date price movement based on the last traded prices. Dividends payable and yields for each company are shown in the Main and Junior Markets’ daily report charts that show closing volume for the bids and offers.
The EPS & PE ratios are based on 2021 and 2022 actual or projected earnings, excluding major one off items. The PE Ratio is the most popular measure used to determine the value of stocks.
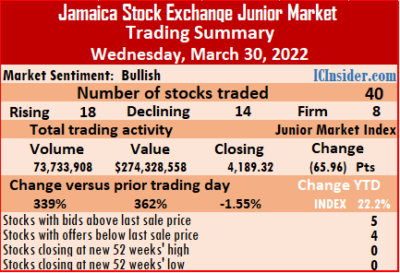
Surge in Junior Market trading but index plunges
Junior Market trading jumped on Wednesday, with the volume of stocks traded surging 339 percent above that Tuesday as the value also jumped 362 percent, but the increased activity failed to prevent the market index from diving 65.96 points to 4,189.32.
 Traded resulted in 73,733,908 shares changing hands at $274,328,558 up from 16,783,104 units at $59,357,222 on Tuesday. Spur Tree Spices led trading with 57.44 million shares for 77.9 percent of total volume, followed by EduFocal, 4.25 million units with 5.8 percent of the day’s trade, JFP Limited accounted for 3.05 million units for 4.1 percent market share, Mailpac Group ended with 1.49 million units for 2 percent market share, Lasco Financial hopped in with 1.45 million units for 2 percent market share and Tropical Battery ended with 1.2 million units for 1.6 percent market share.
Trading averaged 1,843,348 shares at $6,858,214 in contrast to 399,598 shares at $1,413,267 on Tuesday, with month to date, averaging 727,308 units at $2,667,573 ompared to 674,163 units at $2,468,019 on the previous trading day. February closed with an average of 370,064 units at $1,402,517.
Market activity led to 40 securities trading compared to 42 on Tuesday and ended with 18 rising, 14 declining and eight closing unchanged.
The PE Ratio, a measure used to compute appropriate stock values, averages 22.8. The PE ratio of each stock in the chart below is based on ICInsider.com earnings forecast for companies with financial years up to August 2022.
Investor’s Choice bid-offer indicator shows five stocks ended with bids higher than their last selling prices and four with lower offers.
 At the close, Caribbean Assurance Brokers shed 13 cents to end at $2.35 after trading 64,857 shares, Dolphin Cove lost 60 cents in closing at $26, with 149,124 stock units changing hands, EduFocal rose 47 cents to $3.68 in an exchange of 4,247,474 stocks. Elite Diagnostic rallied 8 cents to close at $3 after exchanging 9,883 units, General Accident increased 11 cents in ending at $6 with an exchange of 8,445 units, Honey Bun climbed 19 cents to end at $9.99, with 8,046 shares changing hands. Iron Rock Insurance dropped 25 cents to close at $3.15, with 7,000 stock units crossing the exchange, Jetcon Corporation gained 12 cents to close at $1.20 in trading 347,325 stocks, JFP Limited advanced 11 cents in closing at $1.26 after trading 3,051,640 stocks. Lasco Financial popped 30 cents to $3.50 in exchanging 1,451,000 units, Lasco Manufacturing fell 35 cents to $5.25 while exchanging 90,711 shares, Lumber Depot gained 13 cents to close at $3.62 after exchanging 532,147 stock units.
 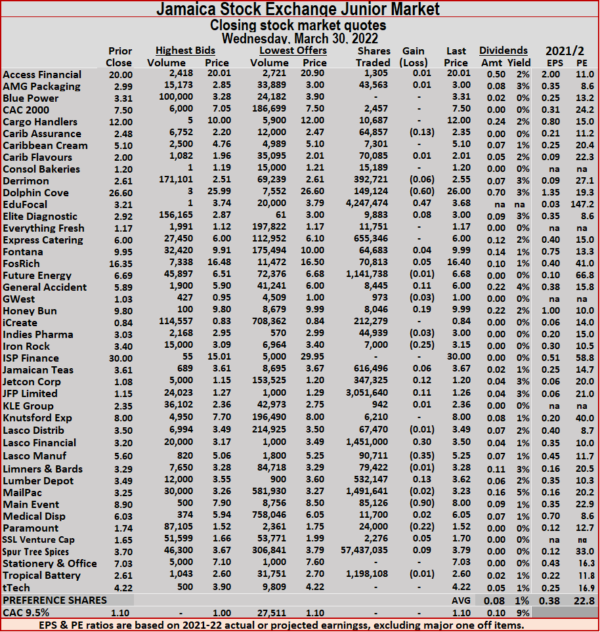 Main Event declined 90 cents to end at $8 with the swapping of 85,126 stocks, Paramount Trading lost 22 cents to end at $1.52, with 24,000 shares clearing the market and Spur Tree Spices popped 9 cents in closing at $3.79 with 57,437,035 units crossing the market.
Prices of securities trading are those for the last transaction of each stock unless otherwise stated.
Junior Market drops & recovery for Main Market
The Jamaica Stock Exchange ended trading on Wednesday with all three Main market gaining indices rising at the close, with the Combined Index climbing 2,582.90 points to close at 401,411.93, the All Jamaican Composite Index Jumped 4,746.65 points to close at 439,468.85 and the JSE Main Index 3,384.50 points to end at 389,024.39 while the Junior Market dived 65.96 points to 4,189.32.
The market’s PE ratio ended at 22.1 based on 2021-22 earnings and 12.7 times those for 2022-23 at the close of the Jamaica Stock Exchange.
Investors need a series of measures and pertinent information to successfully navigate the many investment choices in the local stock market. The ICInsider.com PE ratio chart and the more detailed daily report charts provide investors with regularly updated information to help with decision-making.
Investors should make use of the chart to help make rational investment decisions by investing in stocks that are close to the average for the sector and not going too far from it unless there are compelling reasons to do so. This approach helps to take emotions out of the investment decision and put in on fundamentals while at the same time not being too far from the majority of investors. Investors who buy when the price of a stock is close to the average will find that they are not inclined to overpay for a stock.
 The ICInsider.com PE Ratio chart covers all ordinary shares listed on the Jamaica Stock Exchange. It shows companies grouped on an industry basis, allowing easy comparisons between the same sector companies and the overall market.
The net asset value of each company is reported as a guide to assess the value of stocks based on this measure quickly. The chart also shows daily changes in stock prices and the percentage year to date price movement based on the last traded prices. Dividends payable and yields for each company are shown in the Main and Junior Markets’ daily report charts that show closing volume for the bids and offers.
The EPS & PE ratios are based on 2021 and 2022 actual or projected earnings, excluding major one off items. The PE Ratio is the most popular measure used to determine the value of stocks.