Trading ended on the Jamaica Stock Exchange on Monday with gains in the Main Market primary indices and the Junior Market index with the USD Market closing lower with the volume of and value of stocks exchanged diving from the heightened Caribbean Producers trades on Friday.
 At the close of trading the prices of 41 shares rose, 52 declined and 22 remained firm resulting in the JSE Combined Market Index advancing 731.91 points to 332,821.45, the All Jamaican Composite Index rose 1,165.36 points to 368,572.07, the JSE Main Index increasing 583.08 points to close at 320,366.24, while the Junior Market Index rose 24.31 points to end at 3,690.35, and the JSE USD Market Index dropped 10.20 points to 231.84.
Trading ended with an exchange of 15,377,336 shares in all three markets, well down from 488,159,035 units on Friday, with the value of stocks traded on the Junior and Main markets amounting to $66.96 million, in contrast to $3.43 billion on Friday and the JSE USD market closed with an exchange of 1,136,259 shares for US$40,985 compared with 376,670 units at US$19,813 on Friday.
In Main Market activity, Wigton Energy led trading with 4.0 million stocks followed by Transjamaican Highway with 2.07 million shares and Sterling Investments with 758,035 units.
In Junior Market, Dolla Financial led trading with 706,006 stocks followed by Indies Pharma with 492,394 shares and RA Williams ended with an exchange of 469,363 units.
In the preference segment, 138 Student Living preference share sank $34.19 to finish at $220. The market’s PE ratio, the most popular measure used to value stocks, ended at 13.9 based on 2024-25 earnings and 20.3 based on 2023-24 historical earnings. The ICInsider.com PE ratio chart and other more detailed daily charts provide investors with regularly updated information to help with decision-making. The PE ratio chart covers all ordinary shares on the Jamaica Stock Exchange, grouped by industry, allowing for easy comparisons within a sector and the overall market. The earnings per share (EPS) and PE ratios are based on 2023 and 2024 actual or projected earnings, excluding major one time income or expense.
Pertinent information is required to navigate numerous investment options successfully in the stock market. The chart should be used in making rational decisions when investing in stocks close to the sector average, not going too far from it unless there are compelling reasons to do so. This approach helps in removing emotions from investment decisions and place them on fundamentals while not being too far from the majority of investors. Investors who buy when the price of a stock is close to the average will find that they are not inclined to overpay for a stock. 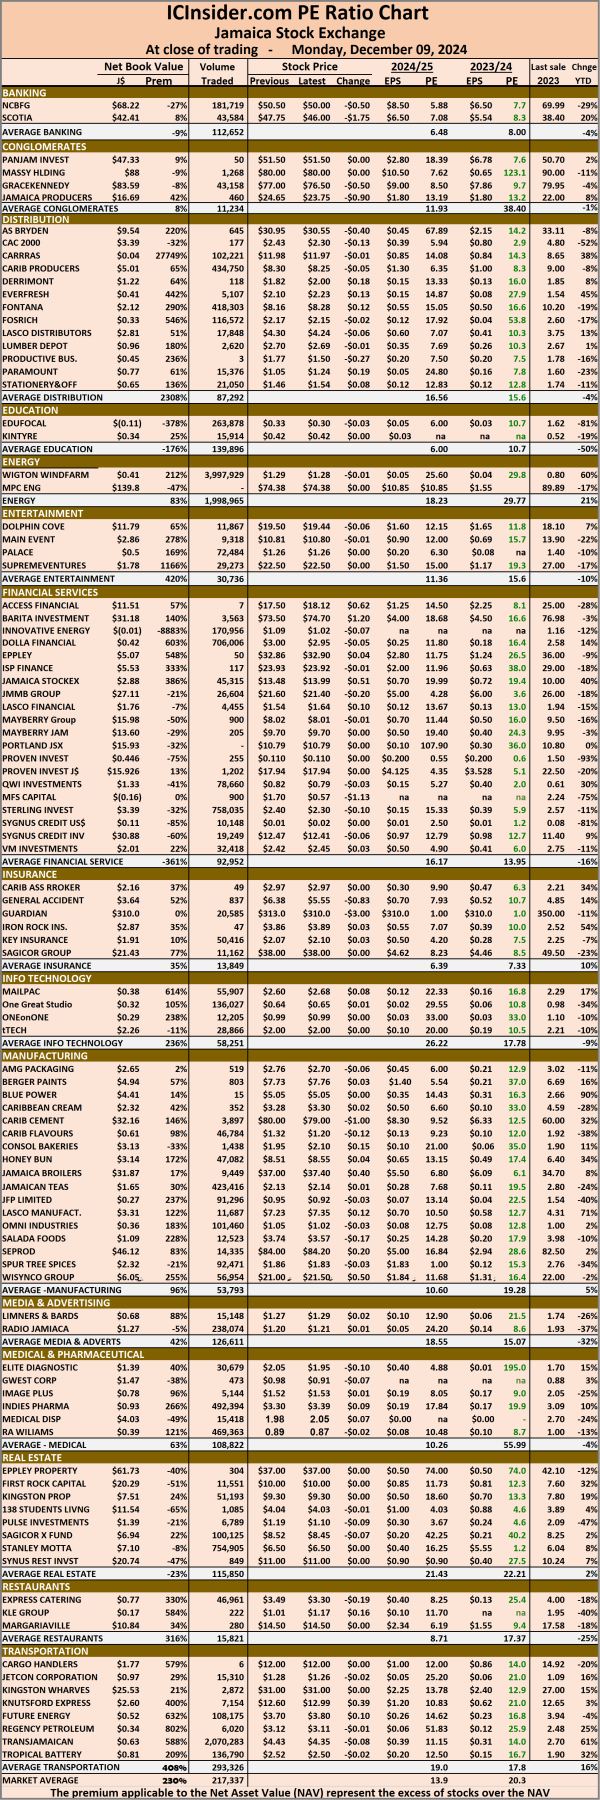 The net asset value of each company is incorporated into the chart. Investors can use this measure to assess stock values. The chart also shows daily changes in stock prices and the percentage year to date price movement based on the last traded prices. Dividends that are paid or are due to be paid and yields for each company are shown in the Main and Junior Markets’ daily report charts, along with the closing volume of the highest bid and the lowest offer for each company.
 Four stocks gained and five fell in the Junior Market TOP10 and the Main Market TOP10 had only one stock gaining and 8 declined.
 The average PE for the JSE Main Market ICTOP 10 stands at 4.8, well below the market average of 14.4 and the Junior Market TOP10 sits at 7.6, more than half the market, with an average of 12.9.
 ICTOP10 focuses on likely yearly winners, accordingly, the list includes some of the best companies in the market, but this is not always so. ICInsider.com ranks stocks based on projected earnings, allowing investors to focus on the most undervalued stocks and helping to remove emotions in selecting stocks for investments that often result in costly mistakes.
 Trading averaged 5,914,291 shares for $49,138,439 up from 262,025 stocks at $3,263,205 on Thursday and month to date, an average of 1,480,131 stocks for $11,669,103 compared with 343,645 shares at $2,065,618 on the previous day and November ending with an average of 286,669 stocks at $2,555,172.
 The Main Market ended trading with an average PE Ratio of 14.5. The JSE Main and USD Market PE ratios are based on last traded prices and earnings forecasts by ICInsider.com for companies with the financial year ending around August 2025.
 Kingston Wharves shed 95 cents to close at $31 after a transfer of 1,102,481 units, Scotia Group increased $1.25 to finish at $47.75 with investors ending with trading in 146,814 shares, ahead of full year results next week and with precious limited supply of stocks on offer at the close. Stanley Motta dropped 42 cents and ended at $6.50 in an exchange of 4,700 stock units and Wisynco Group sank 80 cents to end at $21 trading 1,153,869 units.
 Prices of securities trading are those for the last transaction of each stock unless otherwise stated.
 The market closed with trading of 127,010,636 shares with a value of $430,363,473 well above 9,196,916 units at $27,433,897 on Thursday. Trading averaged 2,822,459 shares at $9,563,633 up from 204,376 units at $609,642 on Thursday with the month to date, averaging 704,140 stock units at $2,243,278 compared to 188,874 stock units at $462,652 on the previous day and November with an average of 309,920 shares at $766,307.
 The Investor’s Choice bid-offer indicator shows four stocks ended with bids higher than their last selling prices and five with lower offers.
 Indies Pharma rose 12 cents to $3.30 in an exchange of 41,303 stocks, Iron Rock Insurance advanced 38 cents to finish at $3.86 with investors dealing in 11 stock units, KLE Group shed 15 cents and ended at $1.01 after a transfer of 12,000 shares. Lumber Depot fell 8 cents to close at $2.70 with 38,000 units crossing the exchange, Medical Disposables increased 28 cents to close at $1.98 with a transfer of 1,201 stocks, Paramount Trading slipped 19 cents to end at $1.05 with investors swapping 403 stock units and Regency Petroleum gained 16 cents to $3.12 with 262,451 shares switching owners.
 Prices of securities trading are those for the last transaction of each stock unless otherwise stated.
 At the close of trading, 488,159,035 shares were exchanged in all three markets, up from 26,160,587 units on Thursday, with the value of stock units traded on the Junior and Main markets amounted to $3.43 billion, which is greater than the $210.17 million on the previous day and the JSE USD market closed with an exchange of 376,670 shares for US$19,813 down from 2,290,277 units at US$68,443 on Thursday.
 The market’s PE ratio, the most popular measure used in valuing stocks, ended at 13.8 based on 2024-25 projected earnings and 20.6 based on 2023-24 historical earnings. The ICInsider.com PE ratio chart and other more detailed daily charts provide investors with regularly updated information to help decision-making. The PE ratio chart covers all the Jamaica Stock Exchange listed ordinary shares, grouped by industry, thus allowing for easy comparisons within a sector and the overall market. The earnings per share (EPS) and PE ratios are based on 2024 and 2024 actual or projected earnings, excluding major one time income or expense.
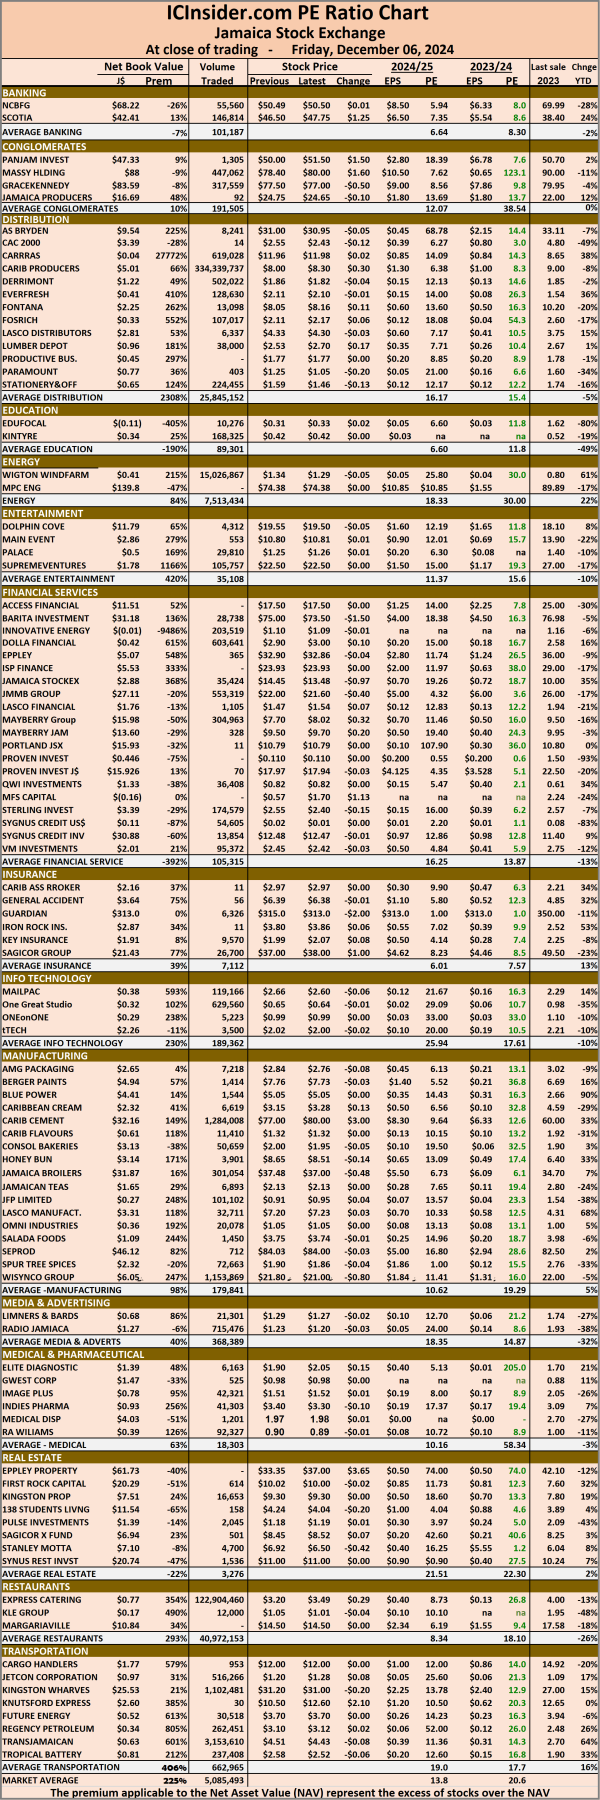 Investors can use this measure to assess stock values. The chart also shows daily changes in stock prices and the percentage year to date price movement based on the last traded prices. Dividends that are paid or are due to be paid and yields for each company are shown in the Main and Junior Markets’ daily report charts, along with the closing volume of the highest bid and the lowest offer for each company.
 The average PE ratio of the market rose to 8, compared to 5.34 based on the current year’s earnings. The difference between the two graphically illustrates the market’s current undervalued level and by extension the upside potential ahead.
 Investors should keep an eye on Prestige Holdings with the potential to gain 80 percent and Trinidad and Tobago NGL with a potential gain of 240 percent.
 The market closed after 14,673,394 shares were traded at $182,739,456 compared with 14,504,716 stocks at $68,895,426 on Wednesday. The average trade amounted to 262,025 stock units at $3,263,205 compared with 230,234 stocks at $1,093,578 on Wednesday and for the month to date, an average of 343,645 stock units at $2,065,618 compared with 368,759 shares at $1,697,130 on the previous day and November ending with an average of 286,669 units at $2,555,172.
 the JSE Main Index dropped by 718.62 points to close at 320,088.81 and the JSE Financial Index advanced 0.28 points to end the day at 64.78. The Investor’s Choice bid-offer indicator shows 14 stocks ended with bids higher than their last selling prices and none with a lower offer.
 Jamaica Stock Exchange
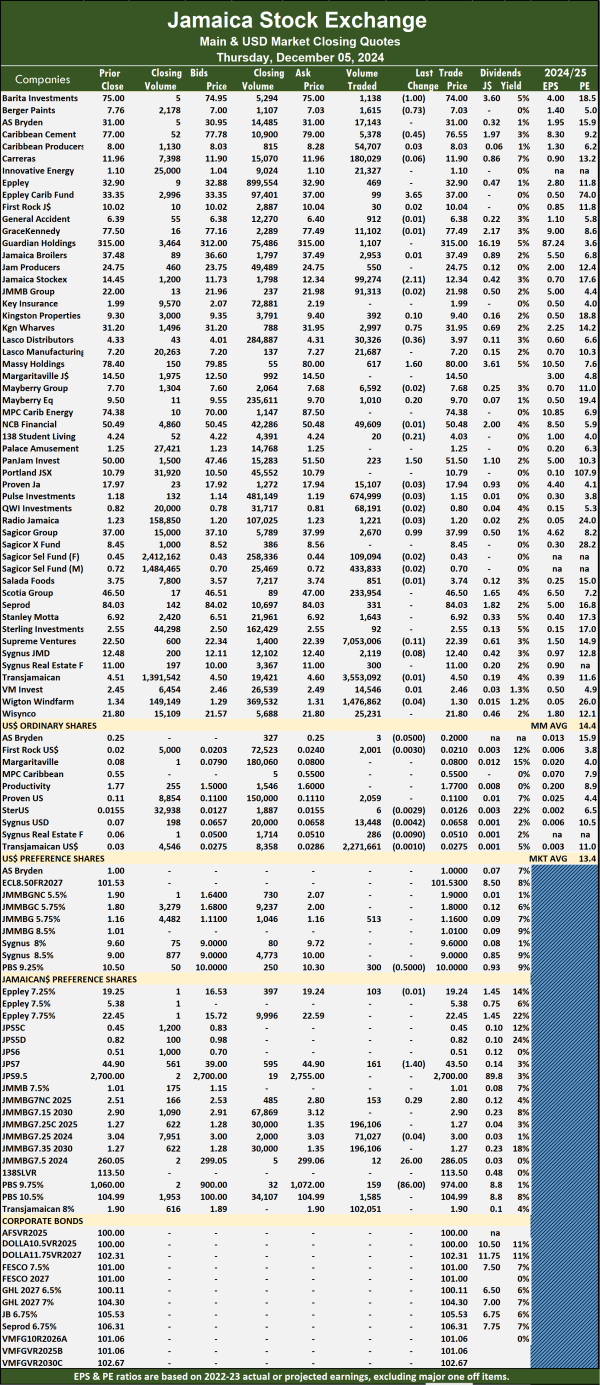 Prices of securities trading are those for the last transaction of each stock unless otherwise stated.
 Trading ended on Thursday with an exchange of 9,196,916 shares for $27,433,897 down from 13,162,541 stock units at $33,001,212 on Wednesday.
 The Junior Market ended trading with an average PE Ratio of 13, based on last traded prices in conjunction with earnings that are projected by ICInsider.com for financial years ending around August 2025.
 Jetcon Corporation increased 8 cents to $1.28 with investors dealing in just 625 units, KLE Group popped 11 cents to end at $1.16 with 153 stock units clearing the market, Knutsford Express advanced $2.10 to close at $12.60 with traders dealing in 220 units. Lasco Financial rallied 7 cents and ended at $1.54 with 572 stocks switching owners, Lumber Depot rose 25 cents to close at $2.78 with 21,865 shares crossing the market, Medical Disposables fell 27 cents to finish at $1.70 with an exchange of 26,500 stock units. Regency Petroleum shed 14 cents and ended at $2.96 with 246,410 shares changing hands and Stationery and Office Supplies declined 12 cents to $1.47 after a transfer of 18,377 units.
 Prices of securities trading are those for the last transaction of each stock unless otherwise stated.
 At the close of the market, the JSE Combined Market Index dropped 659.81 points to 332,409.97, the All Jamaican Composite Index sank 1,110.73 points to 367,813.65, the JSE Main Index declined 718.62 points to close at 320,088.81, the Junior Market Index popped 3.82 points to close at 3,669.96, and the JSE USD Market Index lost 6.66 points to end the day at 259.86.
 The market’s PE ratio, the most popular measure used to value stocks, ended at 13.8 based on 2024-25 earnings and 20.4 based on 202-24 historical earnings. The ICInsider.com PE ratio chart and other more detailed daily charts provide investors with regularly updated information to help decision-making. The PE ratio chart covers all ordinary shares on the Jamaica Stock Exchange, grouped by industry, allowing for easy comparisons within a sector and the overall market. The earnings per share (EPS) and PE ratios are based on 2024 and 2024 actual or projected earnings, excluding one-time major time income or expense.
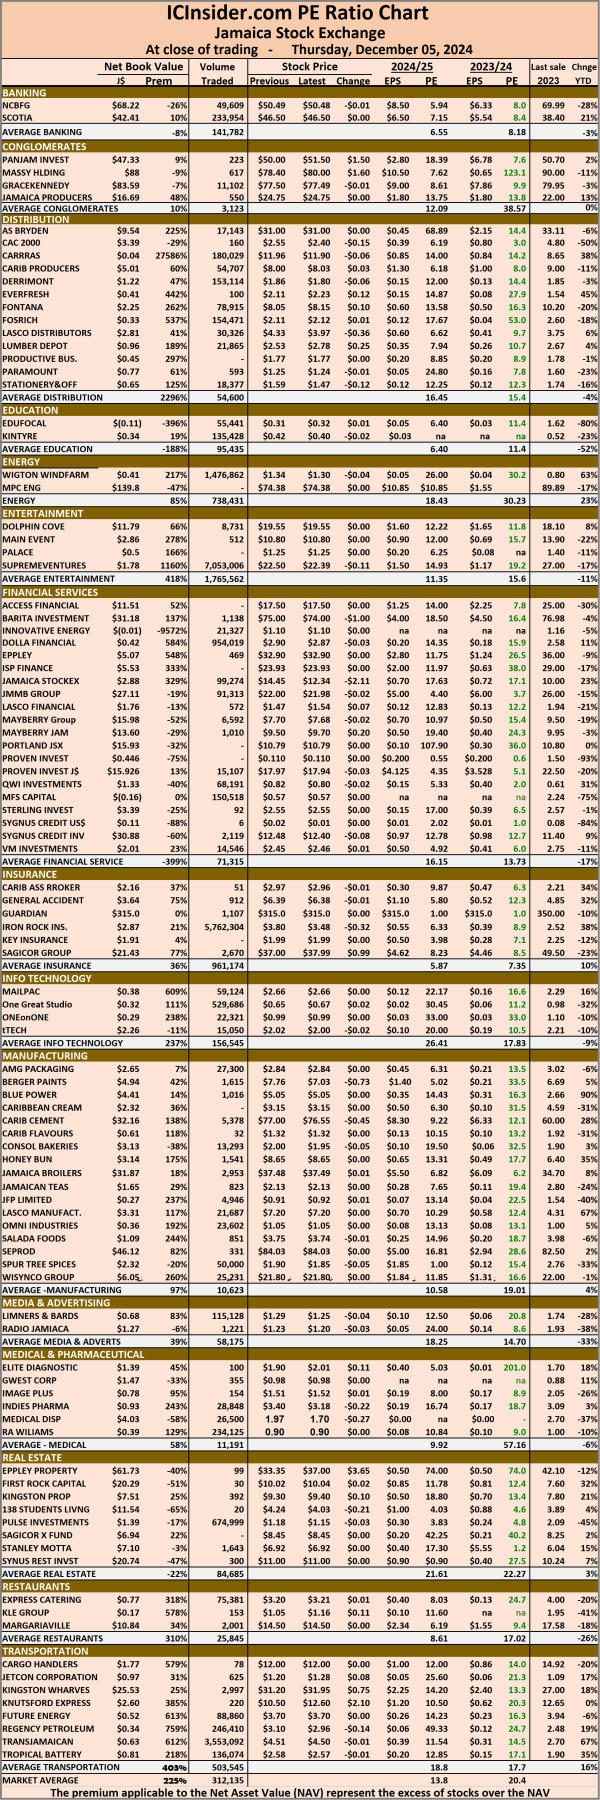 The net asset value of each company is incorporated into the chart. Investors can use this measure in assessing stock values. The chart also shows daily changes in stock prices and the percentage year to date price movement based on the last traded prices. Dividends that are paid or are due to be paid and yields for each company are shown in the Main and Junior Markets’ daily report charts, along with the closing volume of the highest bid and the lowest offer for each company.by
 The market closed, with trading of 13,162,541 shares for $33,001,212 up solidly from 4,036,639 stock units at $8,176,246 on Tuesday. Trading ended with an average of 292,501 shares at $733,360 up from 85,886 stocks at $173,963 on Tuesday with the month to date, averaging 183,891 stock units at $415,405 compared with 132,444 stock units at $264,794 on the previous day and with an average of 309,920 shares at $766,307 in November.
 At the close of the market, CAC 2000 climbed 12 cents in closing at $2.55 with 66 stock units crossing the market, Cargo Handlers dipped 39 cents to $12 after an exchange of 1,641 shares, while Consolidated Bakeries lost 19 cents to close at $2 with 7,165 stocks changing hands. Derrimon Trading skidded 10 cents to end at $1.86 with 17,153 units passing through the market, Dolla Financial sank 10 cents to $2.90 after 7,780,944 shares were traded, Dolphin Cove fell 12 cents and ended at $19.55 with investors trading 4,408 stock units. Elite Diagnostic shed 11 cents in closing at $1.90 after an exchange of 100 stocks, Everything Fresh declined 12 cents and ended at $2.11 with investors dealing in 204,416 units, Express Catering sank 9 cents to $3.20 after a transfer of 29,728 stocks. Fontana slipped 14 cents to end at $8.05 with 36,063 units clearing the market,
 Fosrich dipped 9 cents to finish at $2.11 as 267,286 shares switched owners, Indies Pharma popped 21 cents to close at $3.40 with investors trading 14,202 stocks. Jetcon Corporation rallied 10 cents to $1.20 in an exchange of 18,927 shares, Knutsford Express sank $1 to finish at $10.50 in the trading of 11,557 stock units, Lasco Financial slipped 7 cents to $1.47 after investors exchanged 1,416 stocks. Lumber Depot fell 16 cents in closing at $2.53 with a transfer of 13,291 units, Regency Petroleum skidded 8 cents to close at $3.10 and closed after an exchange of 503,789 shares, Tropical Battery rose 7 cents to end at $2.58 with 62,433 units changing hands and tTech sank 18 cents in closing at $2.02 with 6,082 stocks crossing the market.
 Prices of securities trading are those for the last transaction of each stock unless otherwise stated.