Trading surged on the Jamaica Stock Exchange Main Market on Friday, with a 240 percent surge in the volume of stocks traded following a 417 percent and a jump in value over Thursday, as Transjamaican Highway traded more than 36 million shares with a value of $114 million as the market closed with 62 securities trading compared with 54 on Thursday and resulted in prices of 26stocks rising, 13 declining and 23 ending unchanged.
 Trading closed with 49,321,891 shares for $163,817,114 up from 14,522,075 units at just $31,656,097 on Thursday.
Trading averaged 795,514 shares at $2,642,212 compared to 268,927 units at $586,224 on Thursday and month to date, an average of 729,589 units at $3,850,69 compared to 725,808 units at $3,920,010 on the previous day and March with an average of 828,473 units at $2,341,254.
Transjamaican Highway led trading with 36.12 million shares for 73.2 percent of total volume followed by Sagicor Select Financial Fund with 4.29 million units for 8.7 percent of the day’s trade, Wigton Windfarm with 2.72 million units for 5.5 percent market share and Sagicor Select Manufacturing & Distribution Fund with 2.31 million units for 4.7 percent of total volume.
The All Jamaican Composite Index lost 592.66 points to lock up trading at 355,522.73, the JSE Main Index declined 152.35 points to 319,451.54 and the JSE Financial Index sank 0.34 points to lock up trading at 68.06.
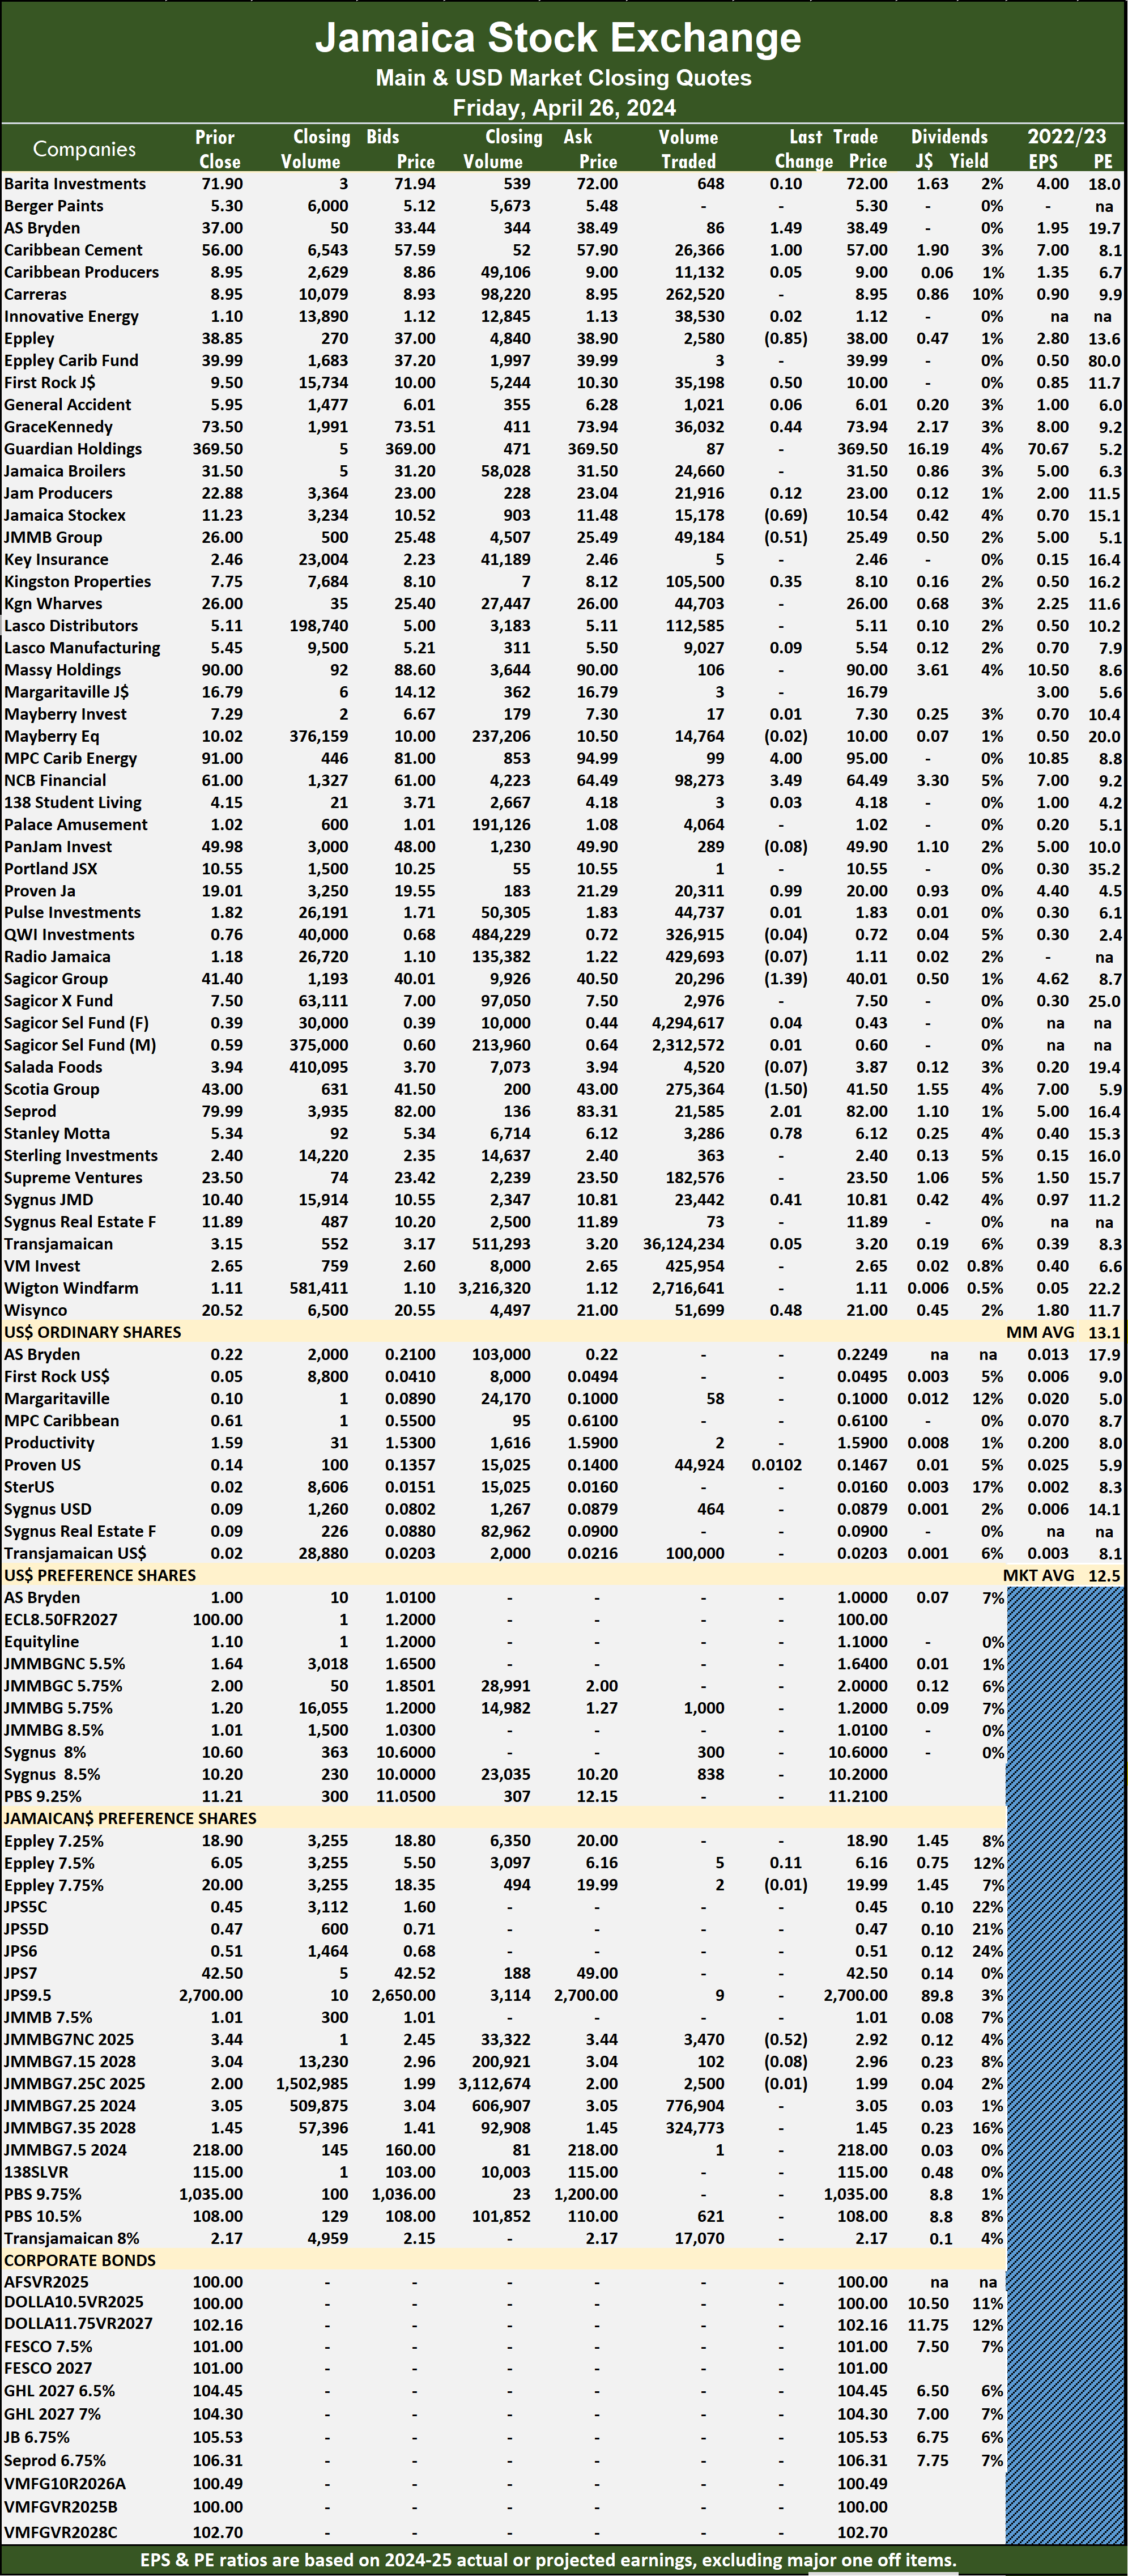
 The Main Market ended trading with an average PE Ratio of 13.7. The JSE Main and USD Market PE ratios are based on the last traded prices and earnings forecasts by ICInsider.com for companies with financial year, ending around August 2025.
Investor’s Choice bid-offer indicator shows seven stocks ended with bids higher than their last selling prices and two with lower offers.
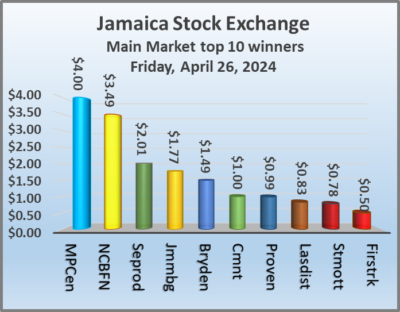
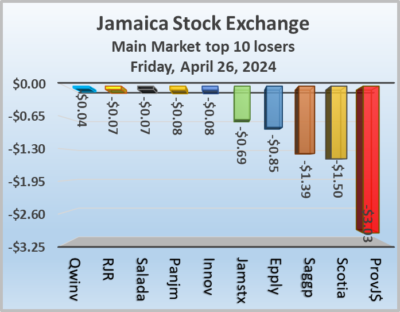
At the close, AS Bryden rose $1.49 and ended at $38.49, with 86 shares crossing the market, Caribbean Cement climbed $1 to $57 with an exchange of 26,366 stocks, Eppley fell 85 cents in closing at $38 and closed after an exchange of 2,580 shares. First Rock Real Estate rallied 50 cents to finish at $10 with traders dealing in 35,198 stock units, GraceKennedy popped 44 cents to close at $73.94 in switching ownership of 36,032 shares, Jamaica Stock Exchange sank 69 cents to end at $10.54, with 15,178 stock units changing hands. JMMB Group rallied $1.77 to $25.49 in an exchange of 49,184 units, Kingston Properties advanced 35 cents to finish at $8.10 after 105,500 stocks passed through the market, MPC Caribbean Clean Energy gained $4 and ended at $95 with a transfer of 99 units. 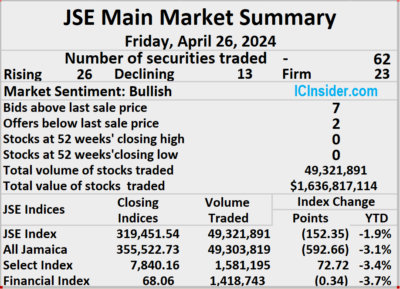 NCB Financial rose $3.49 in closing at $64.49, with 98,273 stocks crossing the exchange, Proven Investments gained 99 cents to end at $20 in trading 20,311 shares, Sagicor Group declined $1.39 to close at $40.01 after a transfer of 20,296 units. Scotia Group shed $1.50 to $41.50 with investors exchanging 275,364 shares, Seprod popped $2.01 to end at $82 in an exchange of 21,585 stocks, Stanley Motta gained 78 cents to close at $6.12 with investors trading 3,286 units. Sygnus Credit Investments climbed 41 cents to close at $10.81 after an exchange of 23,442 stock units and Wisynco Group advanced 48 cents and ended at $21 with investors dealing in 51,699 shares.
In the preference segment, JMMB Group 7% preference share dropped 52 cents to finish at $2.92 after an exchange of 3,470 stock units.
 Prices of securities trading are those for the last transaction of each stock unless otherwise stated.
JSE Main Market rises but losers beat winners
Trading remained low keyed on the Jamaica Stock Exchange Main Market ended on Thursday, with the volume of stocks traded rising 9 percent and the value 31 percent lower than Wednesday’s, following trading of 54 securities compared with 57 on Wednesday, with prices of 16 stocks rising, 20 declining and 18 ending unchanged.
 The market closed with the trading of 14,522,075 shares for $31,656,097 compared with 13,267,148 stocks at $45,775,484 on Wednesday.
Trading averaged 268,927 shares at $586,224 compared to 232,757 units at $803,079 on Wednesday and month to date, an average of 725,808 units at $3,920,010 compared to 749,831 units at $4,095,302 on the previous day and March that closed with an average of 828,473 units at $2,341,254.
JMMB 9.5% preference share led trading with 9.03 million shares for 62.2 percent of total volume followed by Sagicor Select Financial Fund with 2.27 million units for 15.7 percent of the day’s trade and Wigton Windfarm with 1.48 million stocks for 10.2 percent of the day’s trade.
The All Jamaican Composite Index popped 3,179.32 points to close at 356,115.39, the JSE Main Index advanced 2,452.20 points to 319,603.89 and the JSE Financial Index gained 0.79 points to end at 68.40.
 The Main Market closed with an average PE Ratio of 13. The JSE Main and USD Market PE ratios are based on the last traded prices and earnings forecasts by ICInsider.com for companies with the financial year ending around August 2025.
Investor’s Choice bid-offer indicator shows nine stocks ended with bids higher than their last selling prices and three with lower offers.
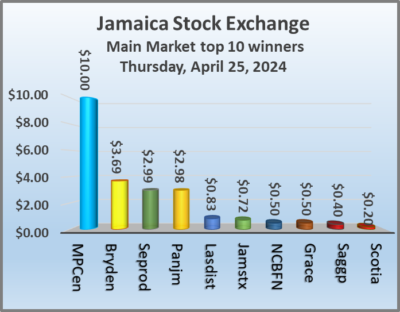
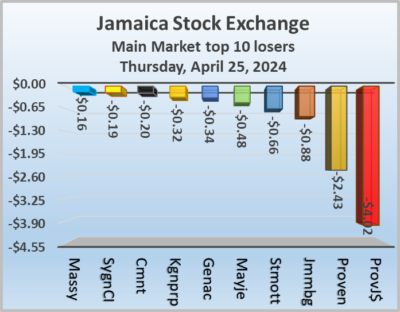
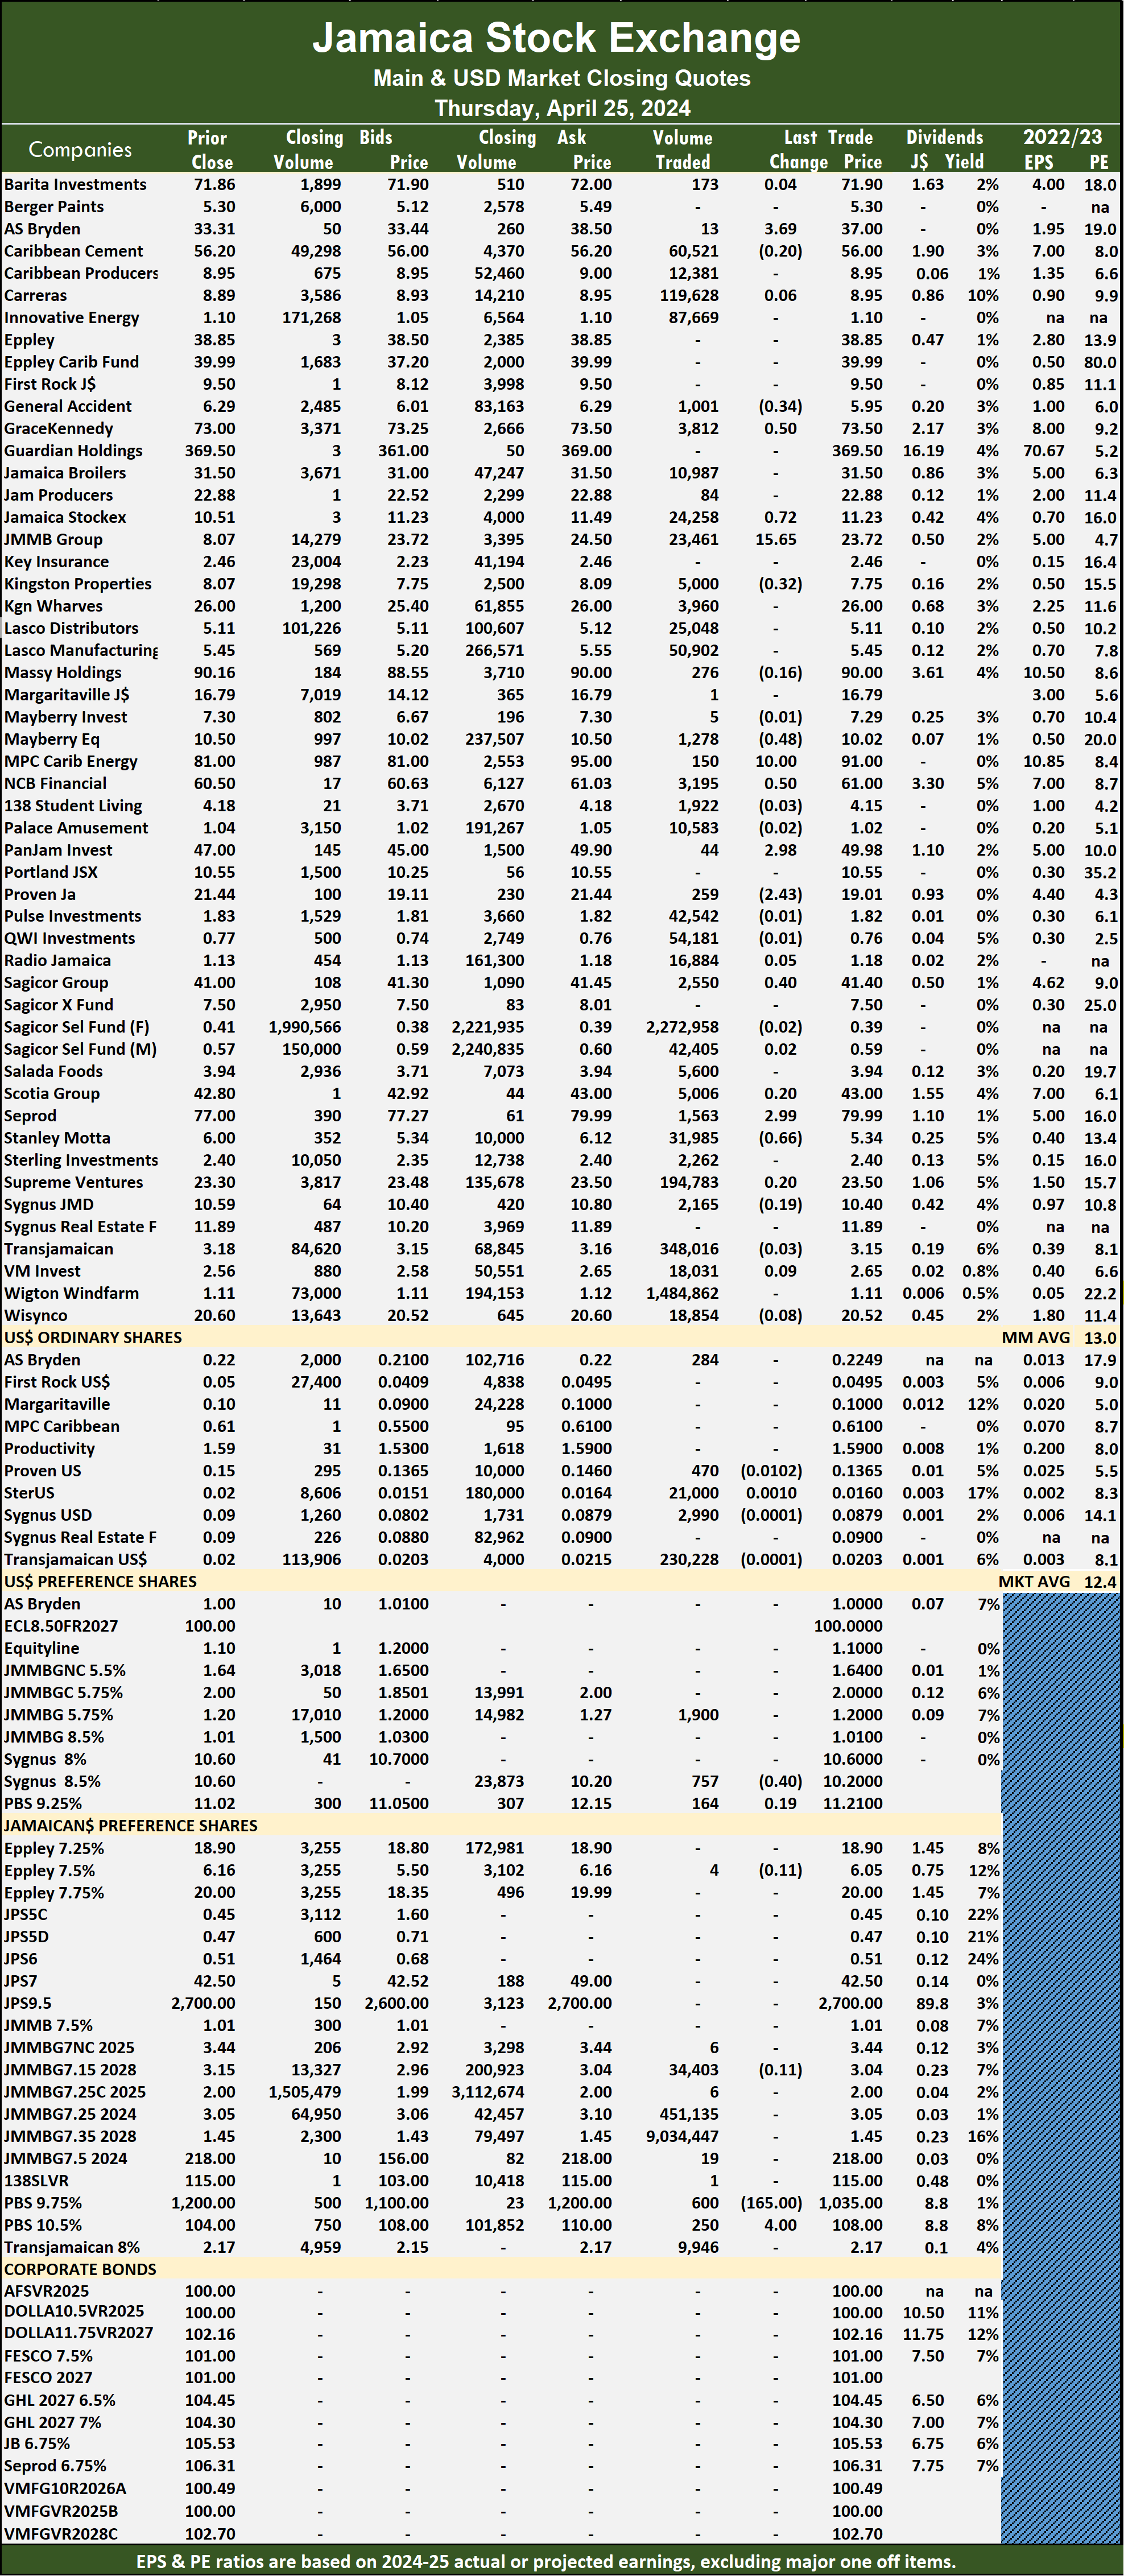
At the close, AS Bryden rose $3.69 to finish at $37, with 13 shares changing hands 13, General Accident sank 34 cents and ended at $5.95 in trading 1,001 stocks, GraceKennedy climbed 50 cents to $73.50 after an exchange of 3,812 shares. Jamaica Stock Exchange increased 72 cents to end at $11.23 and closed with an exchange of 24,258 stock units, JMMB Group dipped 88 cents in closing at $23.72 trading 23,461 shares, Kingston Properties fell 32 cents to close at $7.75 with an exchange of 5,000 stocks. Mayberry Jamaican Equities shed 48 cents to end at $10.02 after 1,278 units passed through the market, 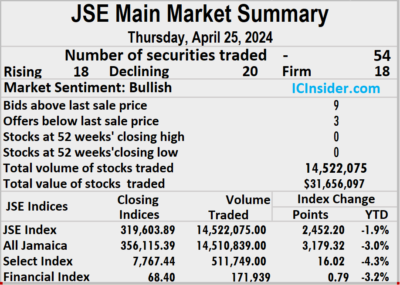 MPC Caribbean Clean Energy popped $10 to close at $91 after a transfer of 150 stocks, NCB Financial rallied 50 cents to end at $61 with investors trading 3,195 shares. Pan Jamaica rallied $2.98 in closing at $49.98 in switching ownership of 44 units, Proven Investments lost $2.43 to finish at $19.01 as investors traded 259 stocks, Sagicor Group gained 40 cents and ended at $41.40 with 2,550 stock units clearing the market. Seprod rose $2.99 to $79.99 after an exchange of 1,563 shares and Stanley Motta skidded 66 cents to $5.34 with investors swapping 31,985 stocks.
In the preference segment, Productive Business Solutions 10.5% preference share declined $165 and ended at $1,035 in an exchange of 600 units and Sygnus Credit Investments C10.5% advanced $4 in closing at $108 with traders dealing in 250 stock units.
 Prices of securities trading are those for the last transaction of each stock unless otherwise stated.
Moderate Main Market activity
Lacklustre trading on the Jamaica Stock Exchange Main Market ended with more shares rising than falling, resulting in moderate movement in the market Indices on Wednesday, with the volume of stocks traded rising marginally and the value 14 percent lower than on Tuesday, resulting from trading in 57 securities compared with 55 on Tuesday, with prices of 23 stocks rising, 14 declining and 20 ending unchanged.
 The market closed on Wednesday with trading of 13,267,148 shares carrying a value of $45,775,484 compared with 13,015,565 units at $53,310,714 on Tuesday.
Trading averaged 232,757 shares for $803,079 compared to 236,647 units at $969,286 on Tuesday and month to date, an average of 749,831 stocks at $4,095,302 compared to 780,216 units at $4,288,763 on the previous day and March that closed with an average of 828,473 units at $2,341,254.
JMMB Group 7.35% – 2028 led trading with 5.56 million shares for 41.9 percent of total volume followed by Wigton Windfarm with 2.37 million units for 17.9 percent of the day’s trade, Sagicor Select Financial Fund with 2.05 million stocks for 15.5 percent market share and Transjamaican Highway with 1.48 million stock units for 11.1 percent of total volume.
The All Jamaican Composite Index slipped 967.20 points to wrap up trading at 352,936.07, the JSE Main Index skidded 87.43 points to conclude trading at 317,151.69 and the JSE Financial Index dipped 0.11 points to end the day at 67.61.
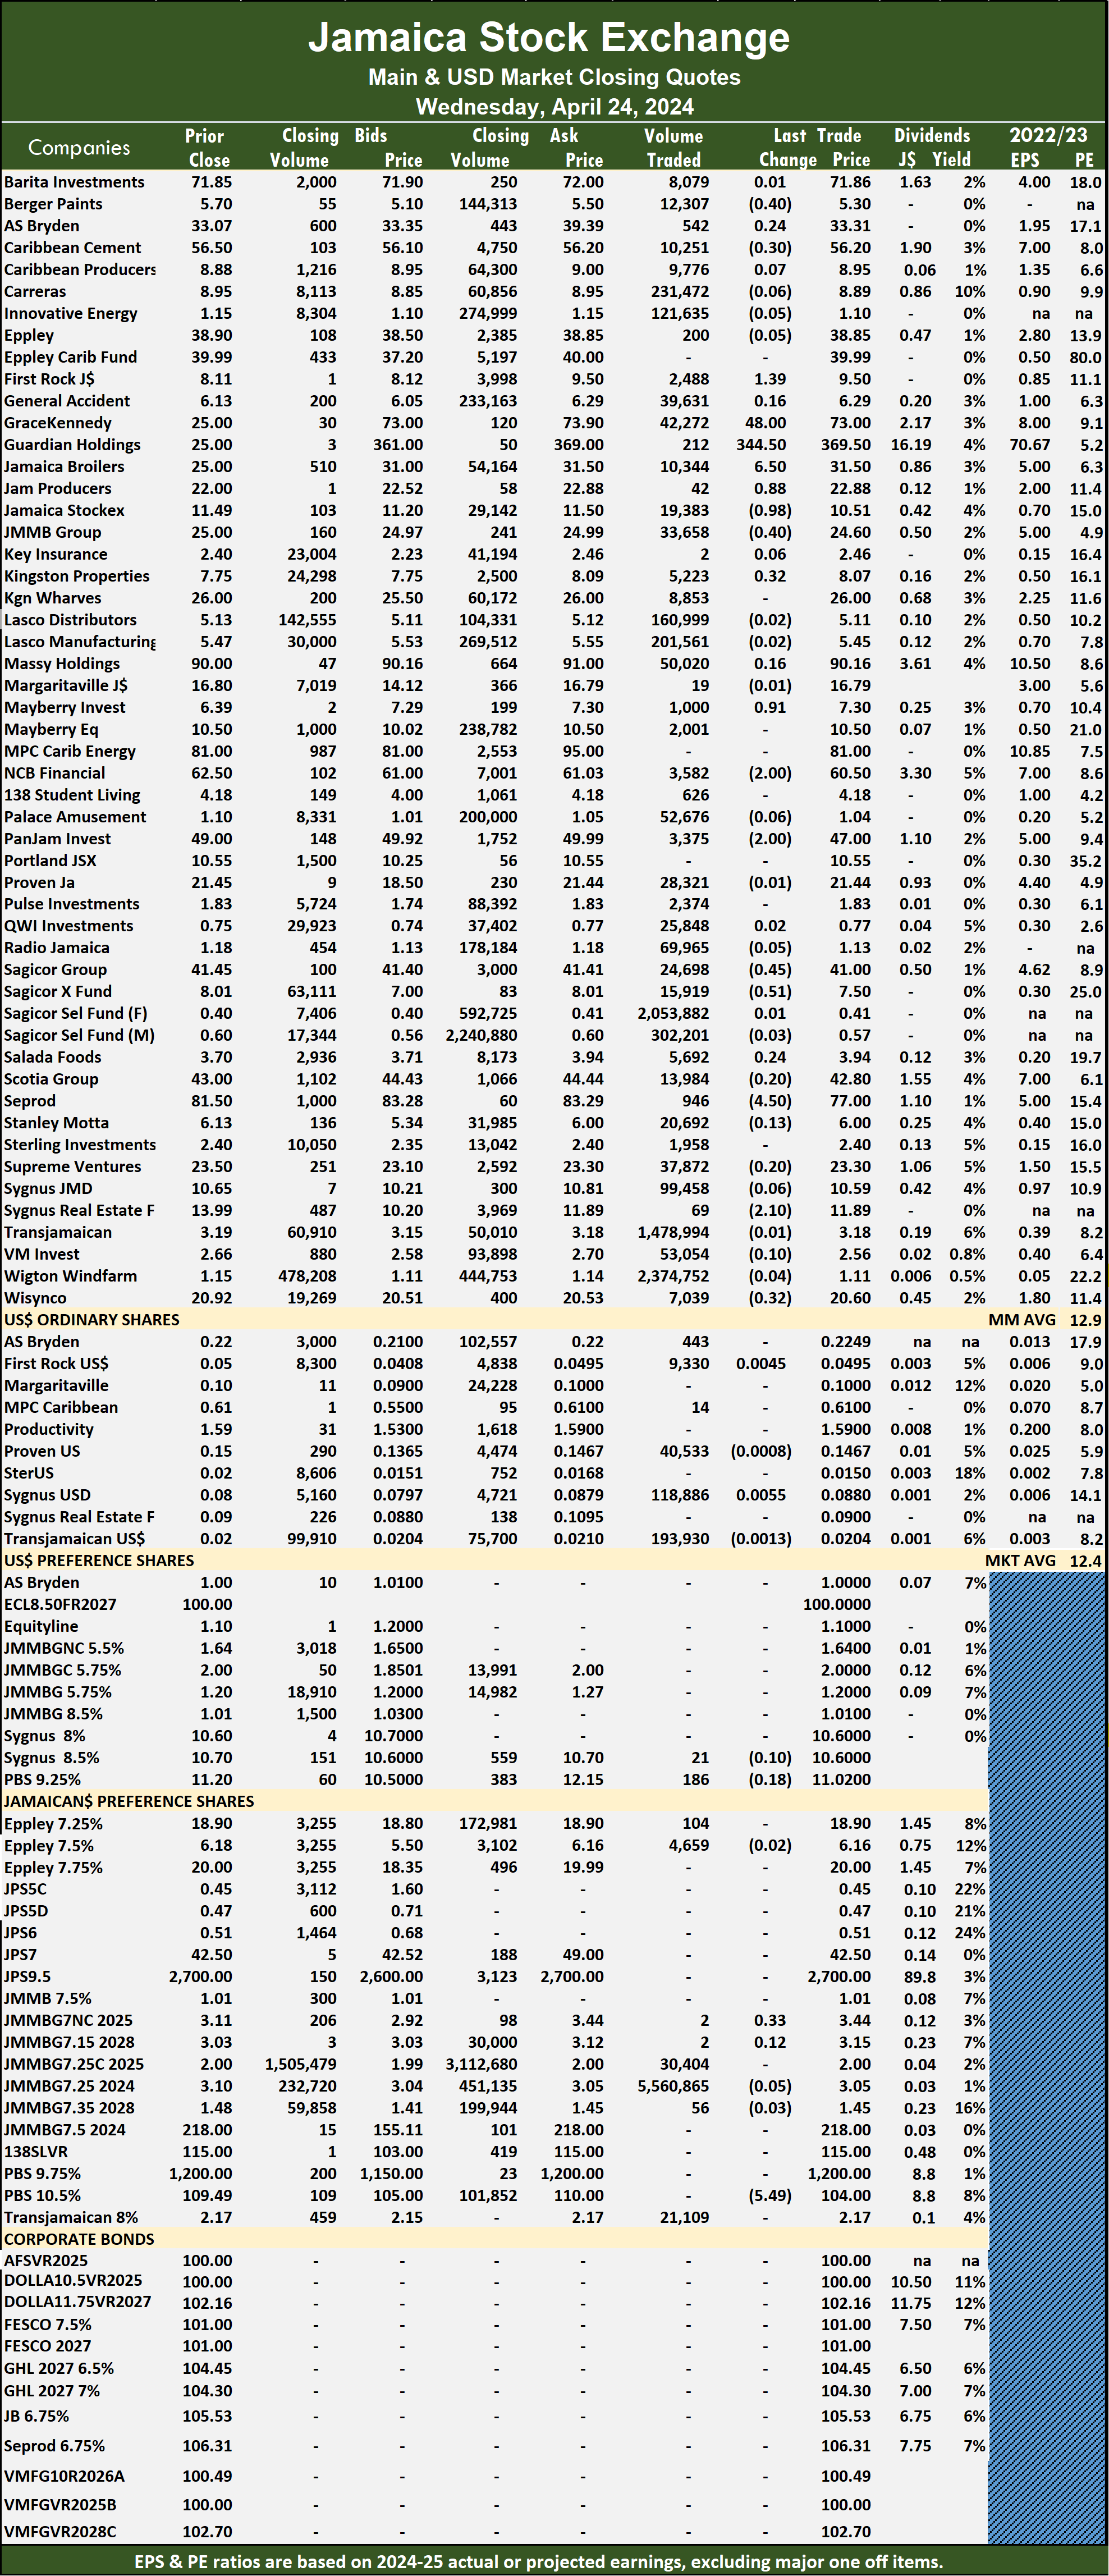
 The Main Market ended trading with an average PE Ratio of 12.9. The JSE Main and USD Market PE ratios are based on the last traded prices and earnings forecasts by ICInsider.com for companies with the financial year ending around August 2025.
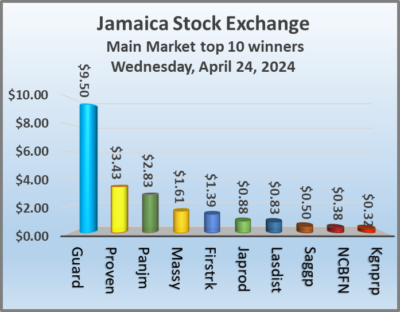
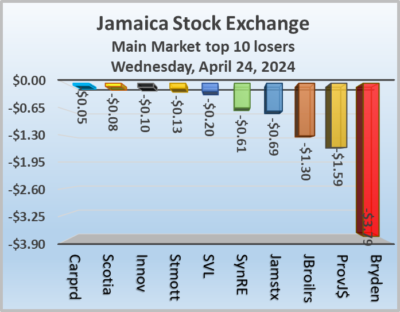
Investor’s Choice bid-offer indicator shows 17 stocks ended with bids higher than their last selling prices and four with lower offers.
At the close, AS Bryden sank $3.79 and ended at $33.31 in switching ownership of 542 shares, First Rock Real Estate gained $1.39 to close at $9.50 with traders dealing in 2,488 shares, Guardian Holdings rose $9.50 to finish at $369.50 in an exchange of 212 stocks. Jamaica Broilers slipped $1.30 to end at $31.50 with 10,344 units clearing the market, Jamaica Producers climbed 88 cents in closing at $22.88 with a transfer of 42 shares, Jamaica Stock Exchange fell 69 cents to close at $10.51 after an exchange of 19,383 stock units. 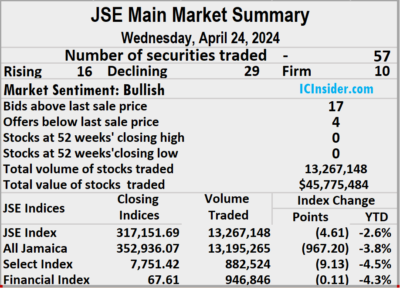 Kingston Properties increased 32 cents to $8.07 in trading 5,223 stock units, Massy Holdings popped $1.61 to end at $90.16, with 50,020 units crossing the exchange, NCB Financial rallied 38 cents in closing at $60.50, with 3,582 shares changing hands. Pan Jamaica rallied $2.83 to finish at $47 after investors ended trading 3,375 stock units, Proven Investments rose $3.43 and ended at $21.44 with 28,321 stocks changing hands, Sagicor Group rallied 50 cents to close at $41 after an exchange of 24,698 units and Sygnus Real Estate Finance shed 61 cents to close at $11.89 with investors swapping 69 shares.
 Prices of securities trading are those for the last transaction of each stock unless otherwise stated.
Main Market loses ground
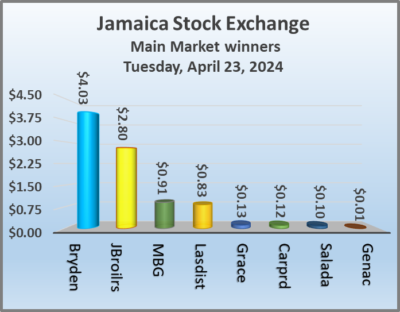
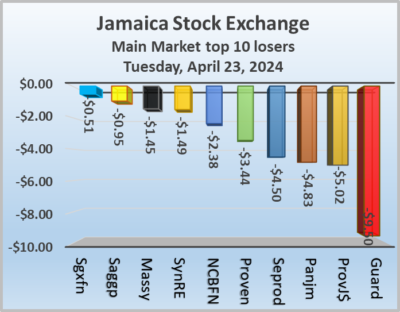
Falling stocks were the dominant element in trading on the Jamaica Stock Exchange Main Market on Tuesday, following a 63 percent decline in the volume of stocks traded and a 95 percent lower value than on Monday, following trading in 55 securities compared with 63 on Monday, with prices of nine stocks rising, 33 declining and 13 ending unchanged.
 The market closed with the trading of 13,015,565 shares for $53,310,714 compared with 35,464,663 units at $1,090,378,097 on Monday.
Trading averaged 236,647 shares at $969,286 compared to 562,931 units at $17,307,589 on Monday. Trading for the month to date averages 780,216 units at $4,288,763 down from 812,889 units at $4,488,294 on the previous day and March that closed with an average of 828,473 units at $2,341,254.
Palace Amusement led trading with 5.33 million shares for 40.9 percent of total volume followed by JMMB 9.5% preference share with 2.27 million units for 17.4 percent of the day’s trade and Wigton Windfarm with 1.34 million units for 10.3 percent of the day’s trade.
The All Jamaican Composite Index declined 2,409.12 points to close at 353,903.27, the JSE Main Index slipped 1,015.63 points to end at 317,239.12 and the JSE Financial Index shed 0.60 points to close at 67.72.
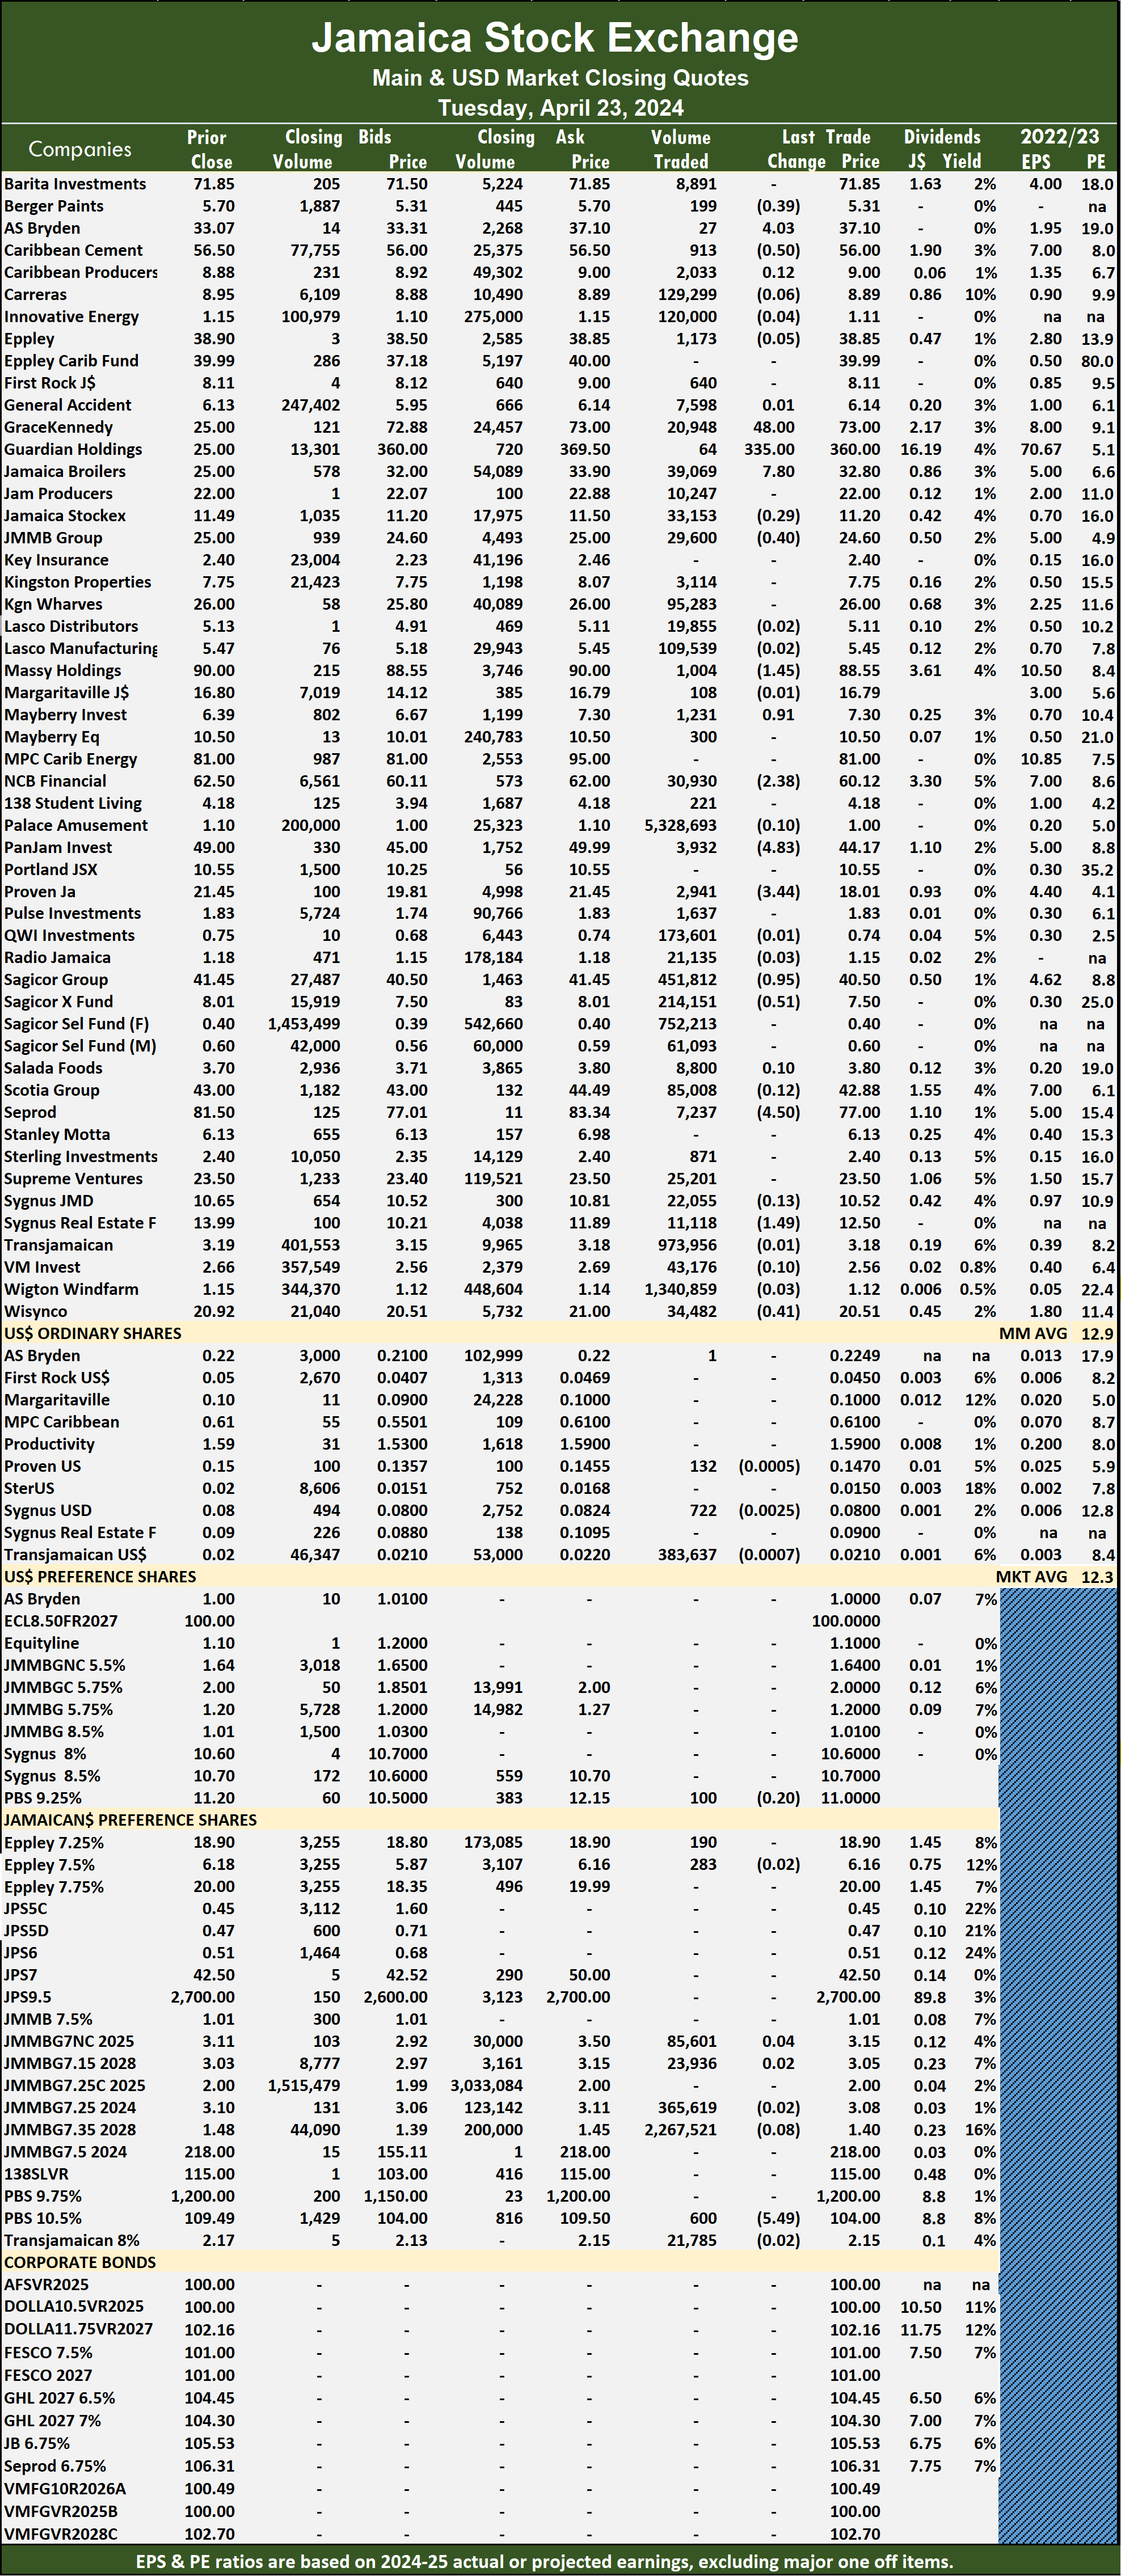
 The Main Market ended trading with an average PE Ratio of 12.9. The JSE Main and USD Market PE ratios are based on the last traded prices and earnings forecasts by ICInsider.com for companies with the financial year ending around August 2025.
Investor’s Choice bid-offer indicator shows 11 stocks ended with bids higher than their last selling prices and three with lower offers.
At the close, AS Bryden rose $4.03 to close at $37.10, with 27 shares crossing the exchange, Berger Paints dipped 39 cents to $5.31 with traders dealing in 199 units, Caribbean Cement fell 50 cents to end at $56 after an exchange of 913 shares. Guardian Holdings shed $9.50 in closing at $360 with investors dealing in 64 stock units, Jamaica Broilers gained $2.80 to finish at $32.80 in an exchange of 39,069 shares, JMMB Group sank 40 cents and ended at $24.60 with investors transferring 29,600 stock units. Massy Holdings slipped $1.45 to $88.55 after 1,004 units passed through the market, 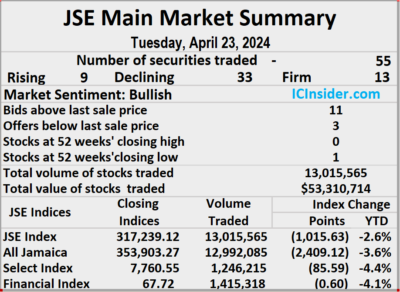 Mayberry Group popped 91 cents to close at $7.30 in trading 1,231 stocks, NCB Financial lost $2.38 in closing at $60.12 after exchanging 30,930 shares. Pan Jamaica dropped $4.83 to end at $44.17 with investors swapping 3,932 stocks, Proven Investments skidded $3.44 and ended at a 52 weeks’ low of $18.01 in an exchange of 2,941 units, Sagicor Group declined 95 cents to finish at $40.50 with investors trading 451,812 stock units. Sagicor Real Estate Fund dropped 51 cents to $7.50 after a transfer of 214,151 shares, Seprod dipped $4.50 to finish at $77, with 7,237 stocks crossing the market, Sygnus Real Estate Finance sank $1.49 and ended at $12.50 with an exchange of 11,118 units and Wisynco Group declined 41 cents to close at $20.51, with 34,482 stock units crossing the market.
In the preference segment, Sygnus Credit Investments C10.5% shed $5.49 in closing at $104 with a transfer of 600 shares.
 Prices of securities trading are those for the last transaction of each stock unless otherwise stated.
Trading surges on JSE Main Market
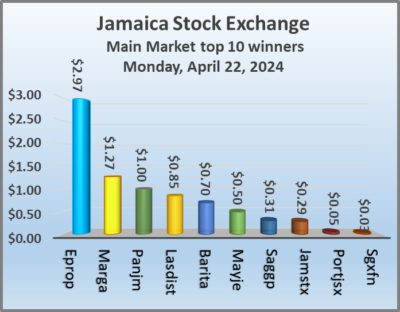
Sagicor Group ended with trading of 12.07 million shares with a value of $500 million and Jamaica Broilers with 12.1 million shares for $388 million and lifted trading to over $1.1 billion on the Main Market of the Jamaica Stock Exchange on Monday, with the volume of stocks traded rising 663 percent and the value 1,272 percent more than on Friday. As was the case on Friday trading ended with activity in 63 securities, with prices of 16 stocks rising, 25 declining and 22 ending unchanged.
 The market closed on Monday with 35,464,663 shares being traded for $1,090,378,097 in comparison to just 4,649,405 units at $79,455,741 on Friday.
Trading averaged 562,931 shares at $17,307,589 up sharply from 73,800 units at $1,261,202 on Friday and month to date, an average of 812,889 stock units at $4,488,294, compared with 831,372 units at $3,540,388 on the prior trading day and March that ended with an average of 828,473 units at $2,341,254.
Jamaica Broilers led trading with 12.13 million shares for 34.2 percent of total volume followed by Sagicor Group with 12.07 million units for 34 percent of the day’s trade, Scotia Group chipped in with 3.05 million stocks for 8.6 percent market share, Wisynco Group ended with 2.56 million units for 7.2 percent share of the stocks traded, Wigton Windfarm closed with 1.84 million stock units for 5.2 percent of the trading and Transjamaican Highway with 1.15 million shares for 3.2 percent of total volume.
 The All Jamaican Composite Index sank by 2,565.76 points to end trading at 356,312.39, the JSE Main Index dropped 3,787.12 points to 318,254.75 and the JSE Financial Index slipped by 0.42 points to end at 68.32.
The Main Market ended trading with an average PE Ratio of 13. The JSE Main and USD Market PE ratios are based on the last traded prices and earnings forecasts done by ICInsider.com for companies with the financial year ending around August 2025.
Investor’s Choice bid-offer indicator shows 13 stocks ended with bids higher than their last selling prices and four with lower offers.
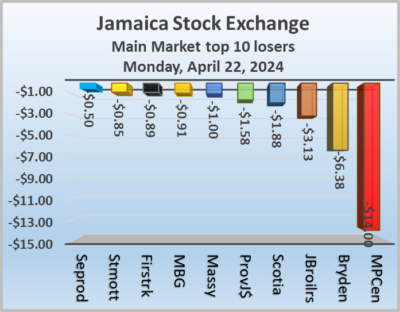
At the close, AS Bryden fell $6.38 to finish at $33.07 after trading of 441 stocks, Barita Investments rallied 70 cents to $71.85 in switching ownership of 313 units, Eppley Caribbean Property Fund rose $2.97 in closing at $39.99 after investors cleared the market of 7 shares. First Rock Real Estate dropped 89 cents to close at $8.11 with a transfer of 3,170 stock units, Jamaica Broilers sank $3.13 and ended at $30 with an exchange of 12,133,266 shares, 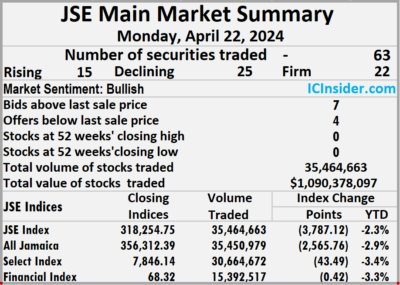 Kingston Properties dropped 32 cents to $7.75, with 4,939 stocks changing hands. Margaritaville rallied $1.27 in closing at $16.80 as investors exchanged 13 units, Massy Holdings shed $1 to end at $90 after 1,818 stock units crossed the market, Mayberry Group declined 91 cents to finish at $6.39 in an exchange of 5,013 shares. Mayberry Jamaican Equities popped 50 cents and ended at $10.50 with investors trading 104,857 units, MPC Caribbean Clean Energy lost $14 to close at $81 with an exchange of 101 stocks, Pan Jamaica popped $1 to end at $49 after 4,016 stock units passed through the market. Sagicor Group increased 31 cents to $41.45 after a transfer of 12,073,955 shares, Scotia Group skidded $1.88 to end at $43 with investors dealing in 3,046,756 units, Seprod dipped 50 cents in closing at $81.50 after an exchange of 1,582 stocks and Stanley Motta sank 85 cents and ended at $6.13 closed at 305 stock units.
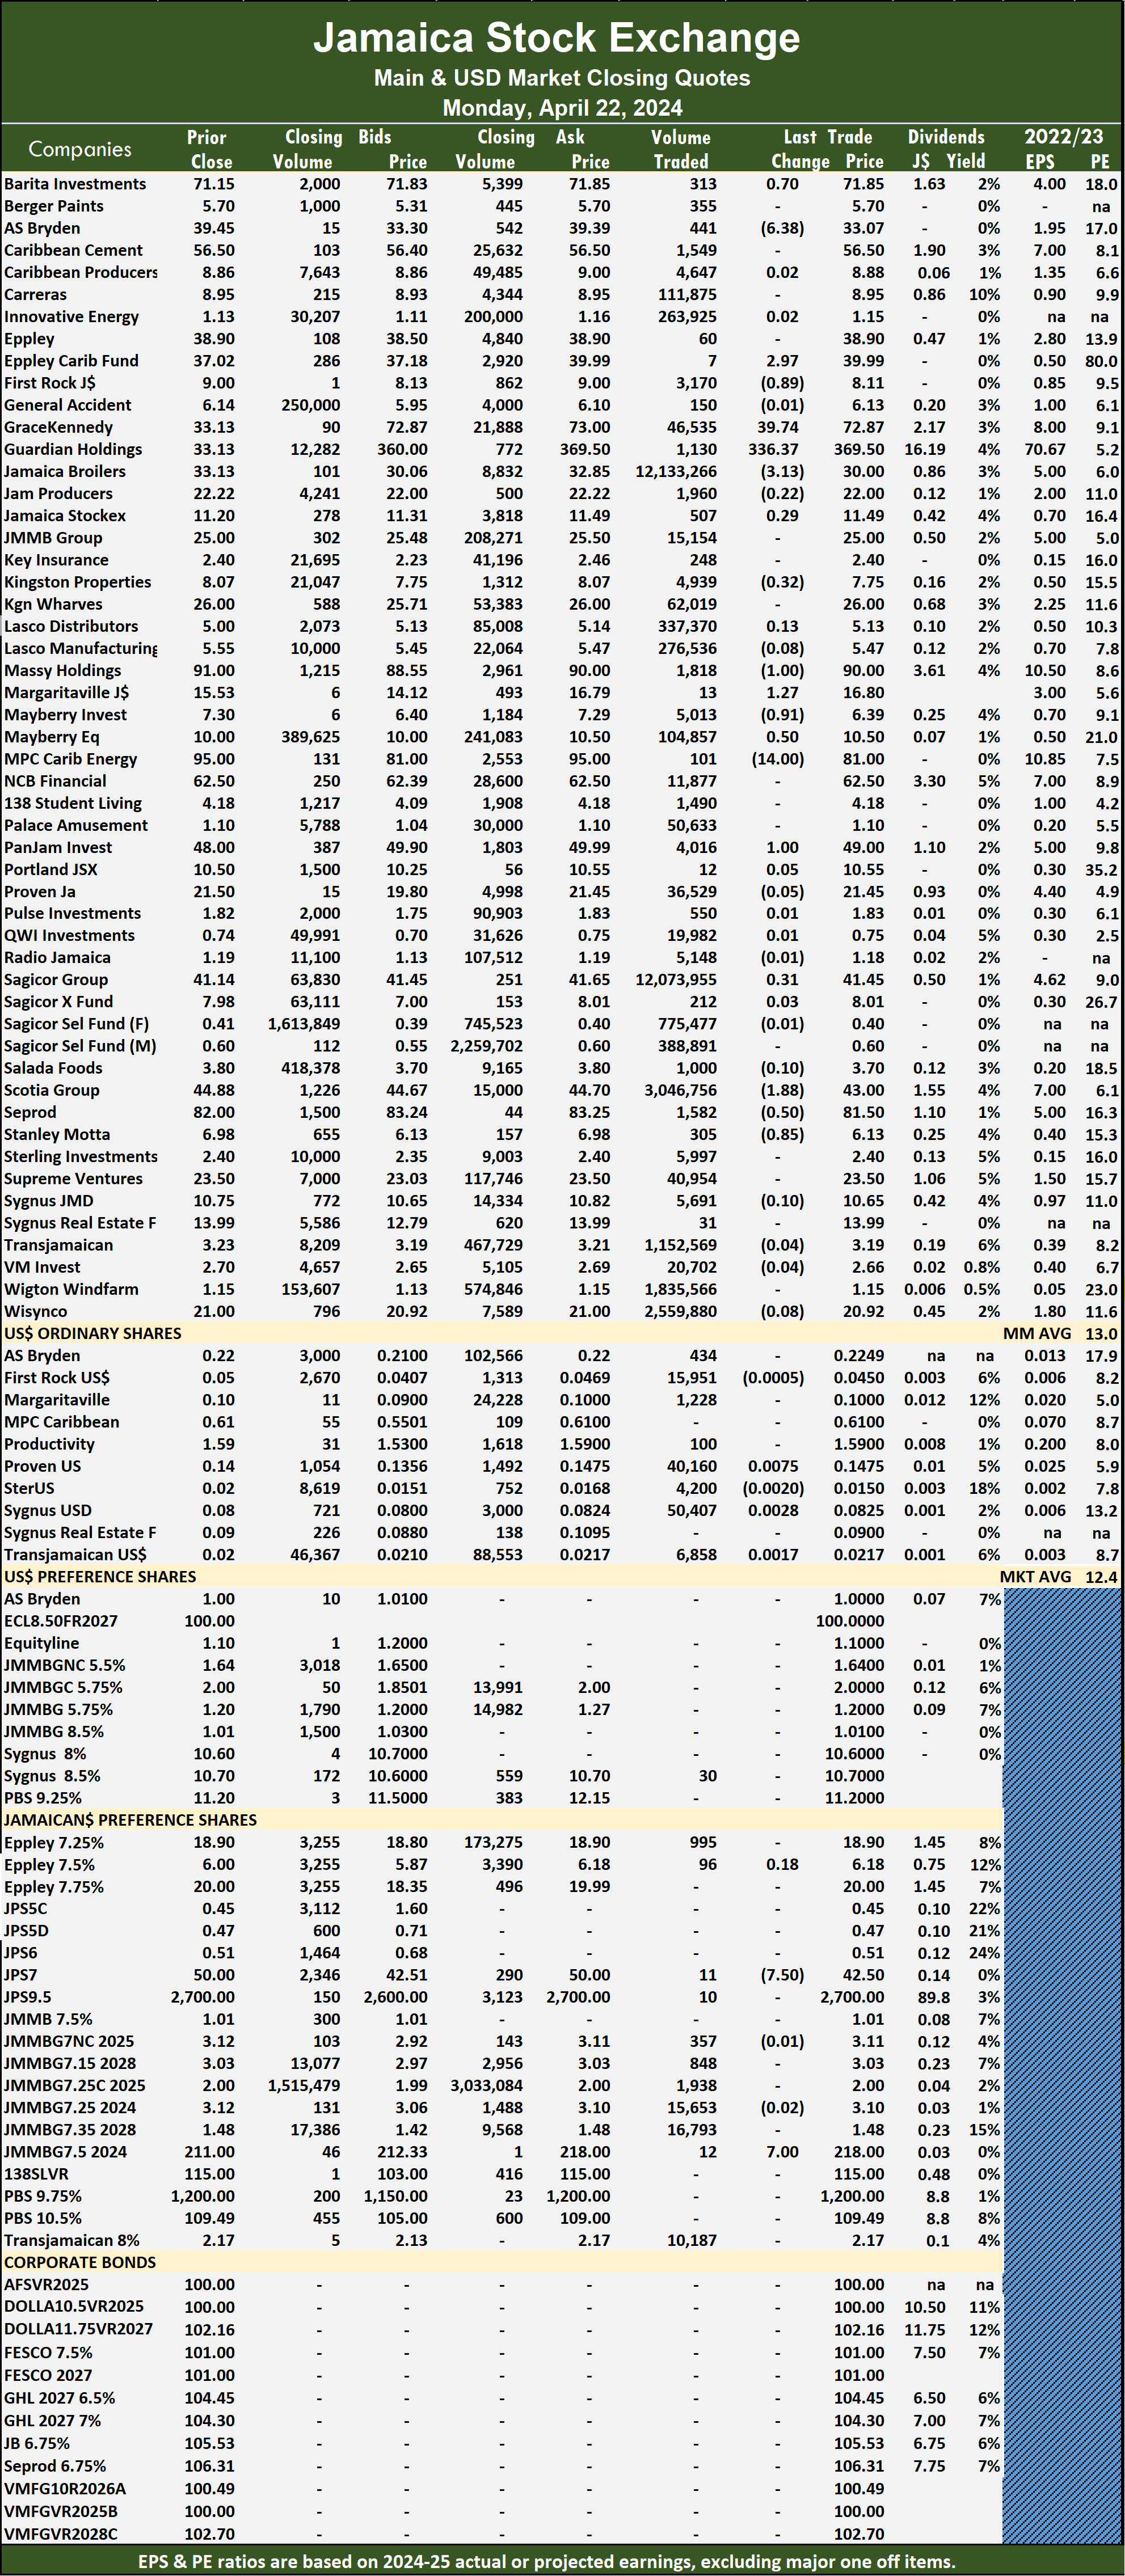 In the preference segment, Jamaica Public Service 7% declined $7.50 to finish at $42.50 after exchanging 11 shares and 138 Student Living preference share advanced $7 to close at $218 with investors transferring 12 units.
Prices of securities trading are those for the last transaction of each stock unless otherwise stated.
Main Market faded into the weekend
Rising stocks edged out decliners in trading on the Jamaica Stock Exchange Main Market on Friday, but stock trading firm beat out all of the above, following a 47 percent fall in the volume of stocks traded at 40 percent lower value than on Thursday, with trading in 63 securities compared to 61 on Thursday, with prices of 21 stocks rising, 19 declining and 23 ending unchanged.
 The market closed with 4,649,405 shares trading for $79,455,741 down from 8,718,855 units at $132,519,420 on Thursday.
Trading averaged 73,800 shares at $1,261,202 compared with 142,932 units at $2,172,450 on Thursday and month to date, an average of 831,372 units at $3,540,38 from 891,863 units at $3,722,377 on the previous day and March that averaged 828,473 units at $2,341,254.
Kingston Wharves led trading with 890,307 shares for 19.1 percent of total volume followed by JMMB 9.5% preference share with 810,423 units for 17.4 percent of the day’s trade and Transjamaican Highway with 672,372 stocks for 14.5 percent market share.
The All Jamaican Composite Index lost 3,372.85 points to end the day at 358,878.15, the JSE Main Index fell 2,142.25 points to lock up trading at 322,041.87 and the JSE Financial Index slipped 1.09 points to conclude trading at 68.74.
 The Main Market ended trading with an average PE Ratio of 13. The JSE Main and USD Market PE ratios are based on the last traded prices and earnings forecasts by ICInsider.com for companies with the financial year ending around August 2025.
Investor’s Choice bid-offer indicator shows five stocks ended with bids higher than their last selling prices and four with lower offers.
At the close, AS Bryden popped $1.45 and ended at $39.45 with investors transferring 9 shares, Barita Investments slipped 85 cents to $71.15 after an exchange of 18,855 stocks, Berger Paints rallied 36 cents in closing at $5.70 with a transfer of 7,753 units. Caribbean Cement sank $1.40 to finish at $56.50 with 446,118 stock units crossing the market, Eppley lost $1.09 to end at $38.90 as investors exchanged 300 shares, Eppley Caribbean Property Fund shed $2.97 to close at $37.02 in switching ownership of 529 units. GraceKennedy dropped 94 cents to end at $73 with traders dealing in 187,546 stocks, Guardian Holdings fell 50 cents and ended at $369.50 after 98 stock units passed through the market, Jamaica Producers dipped 67 cents to end at $22.22 with 1,082 shares changing hands.  Margaritaville increased $1.42 in closing at $15.53 in an exchange of 4 stocks, Massy Holdings climbed $1 to finish at $91 with investors swapping 24,992 stock units, Mayberry Jamaican Equities declined 50 cents to close at $10 in an exchange of 100,402 stock units. NCB Financial skidded 50 cents to $62.50 after investors traded 11,015 shares, Pan Jamaica rose 50 cents to close at $48 with an exchange of 12 stocks, Sagicor Group gained 64 cents in closing at $41.14 with 4,040 units clearing the market. Seprod advanced 80 cents to end at $82 and closed with 6,857 stock units changing hands and Wisynco Group rose 32 cents and ended at $21 with an exchange of 32,814 shares.
In the preference segment, Productive Business Solutions 9.75% preference share gained $4.99 to finish at $115 with investors trading just one stock unit.
 Prices of securities trading are those for the last transaction of each stock unless otherwise stated.
Gains for JSE Main Market
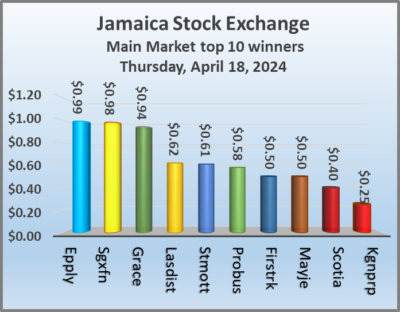
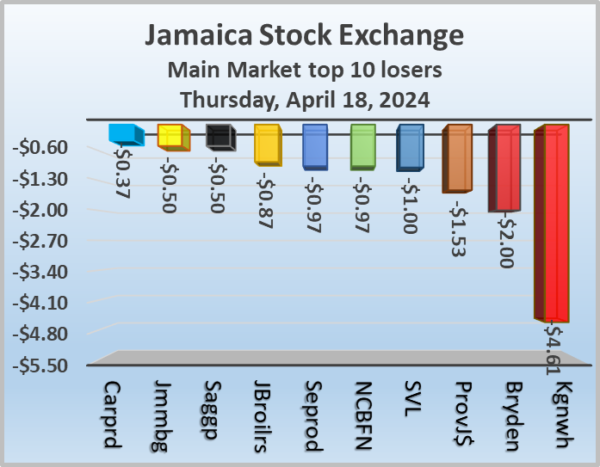
Investors pushed the Jamaica Stock Exchange Main Market up at the close on Thursday, with increased trading as the volume of stocks traded rose 23 percent and the value jumped 253 percent higher than on Wednesday, with trading in 61 securities as was the case on Wednesday and ended with prices of 17 stocks rising, 22 declining and 22 ending unchanged.
 The market closed with 8,718,855 shares being traded at $132,519,420 up from 7,107,320 units at $37,509,746 on Wednesday.
Trading averaged 142,932 shares at $2,172,450 compared to 116,513 units at $614,914 on Wednesday and month to date, an average of 891,863 units at $3,722,377 compared with 954,617 units at $3,852,247 on the previous day and March with an average of 828,473 units at $2,341,254.
Kingston Wharves led trading with 2.51 million shares for 28.8 percent of total volume followed by Wigton Windfarm with 1.80 million stocks for 20.6 percent of the day’s trade and Pan Jamaica with 802,202 units for 9.2 percent market share.
The All Jamaican Composite Index popped 2,030.08 points to 362,251.00, the JSE Main Index climbed 1,240.26 points to finish at 324,184.12 and the JSE Financial Index gained 1.11 points to 69.83.
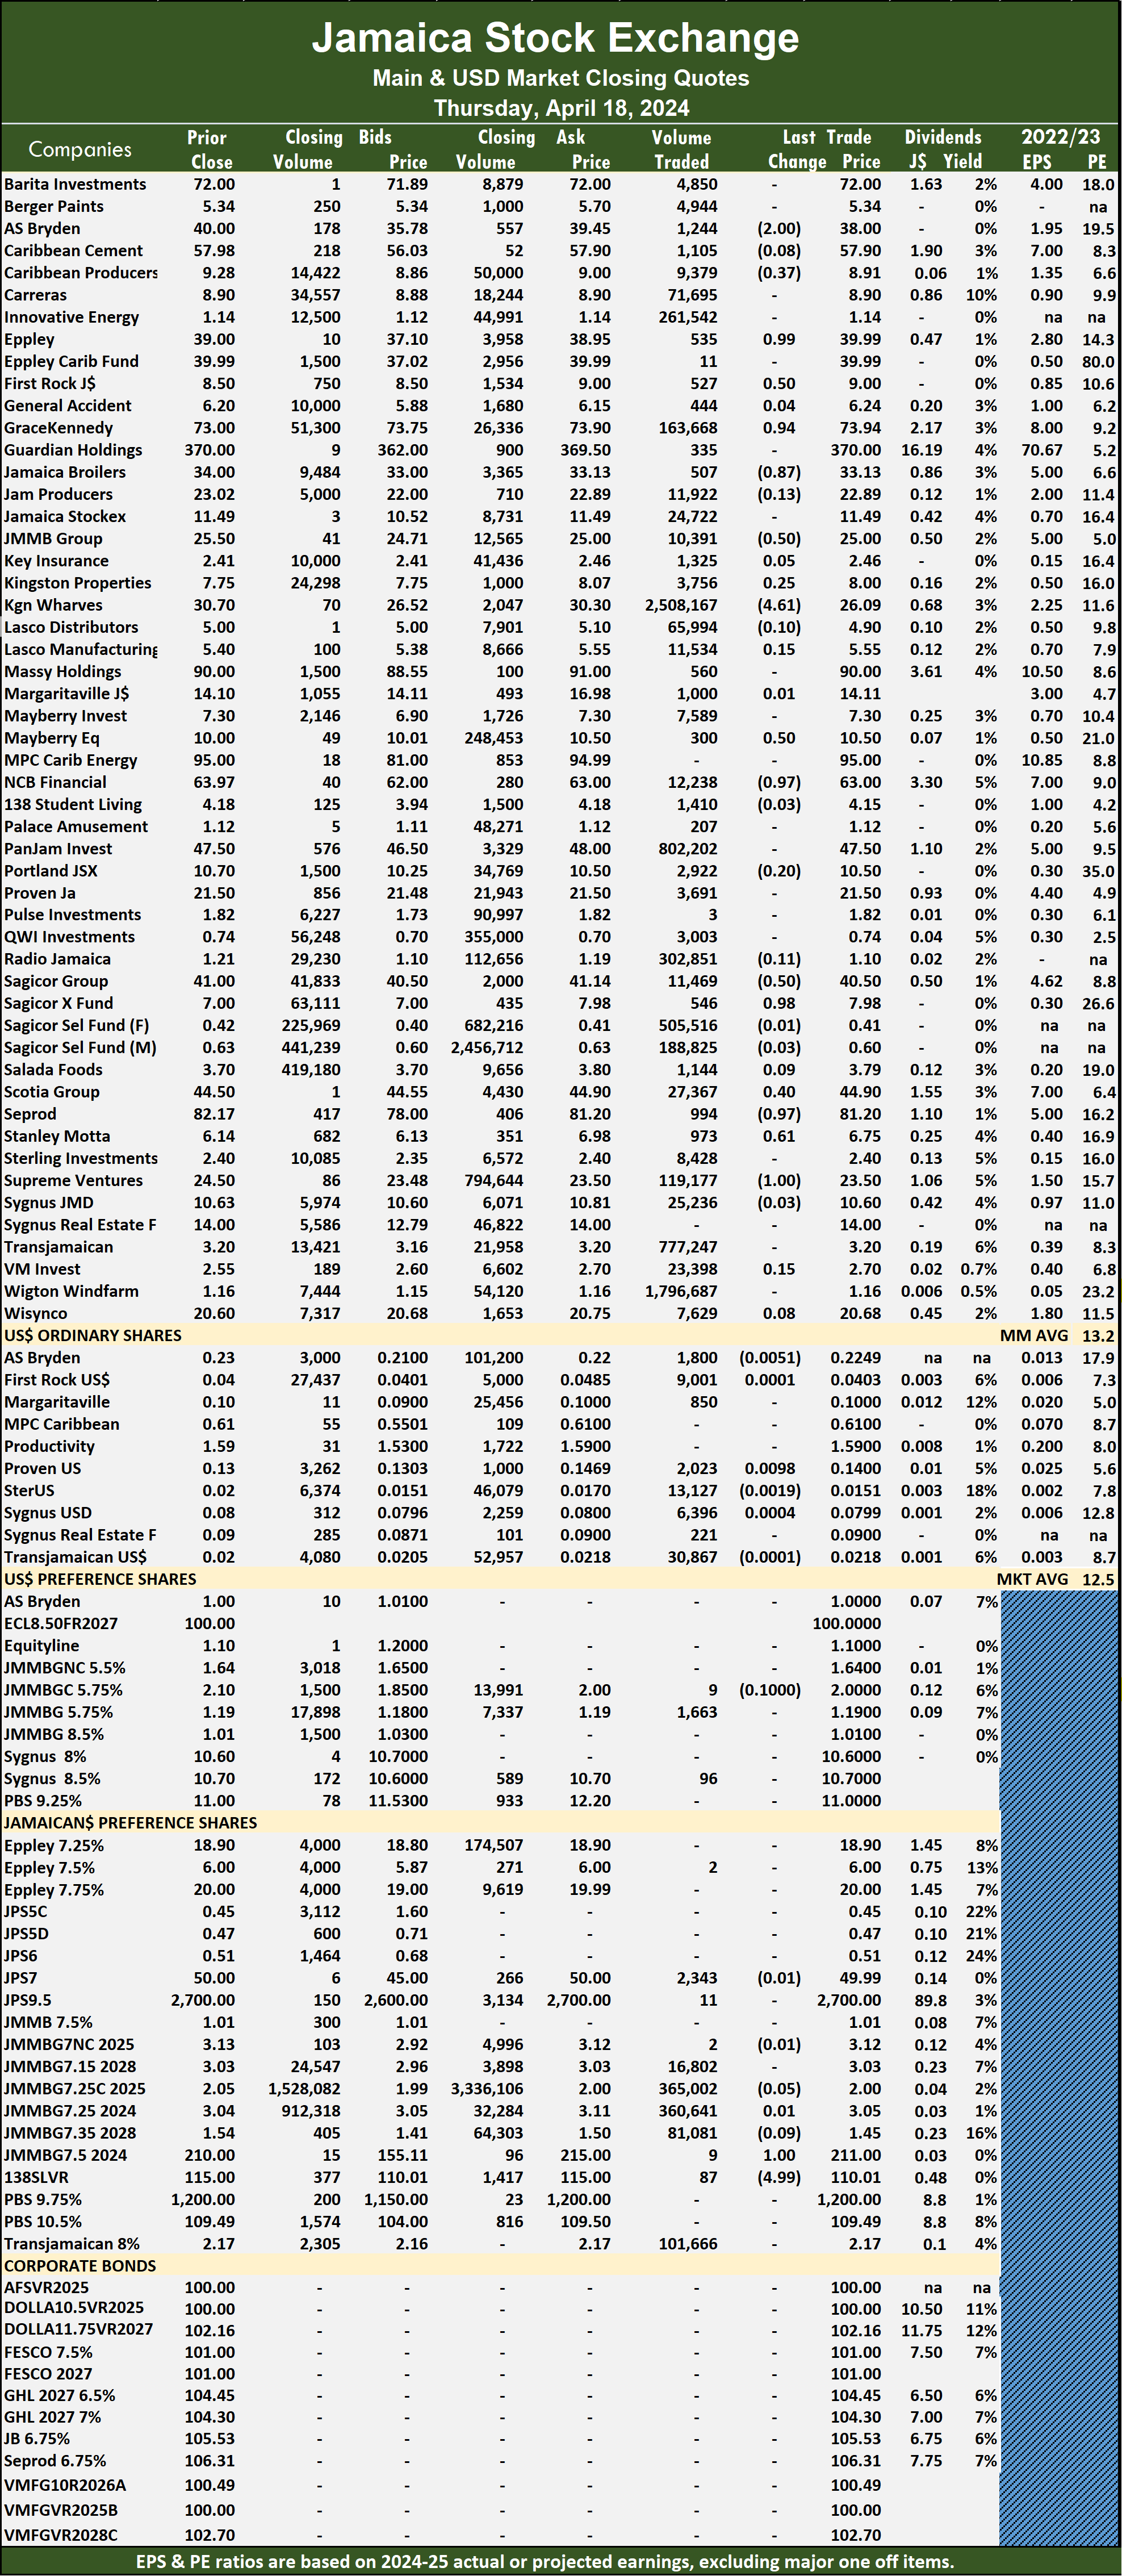
 The Main Market ended trading with an average PE Ratio of 13.2. The JSE Main and USD Market PE ratios are based on the last traded prices and earnings forecasts by ICInsider.com for companies with the financial year ending around August 2025.
Investor’s Choice bid-offer indicator shows six stocks ended with bids higher than their last selling prices and seven with lower offers.
At the close, AS Bryden skidded $2 to finish at $38 with 1,244 units changing hands, Caribbean Producers sank 37 cents to close at $8.91 in an exchange of 9,379 stocks, Eppley rose 99 cents to end at $39.99 with 535 shares crossing the market. First Rock Real Estate climbed 50 cents in closing at $9 in an exchange of 527 stock units, General Accident increased by 4 cents to end at $6.24 with traders dealing in 444 shares, GraceKennedy popped 94 cents to close at $73.94 after 163,668 stocks passed through the exchange. Jamaica Broilers shed 87 cents to end at $33.13 with a transfer of 507 units, JMMB Group declined 50 cents and ended at $25 with 10,391 stock units clearing the market,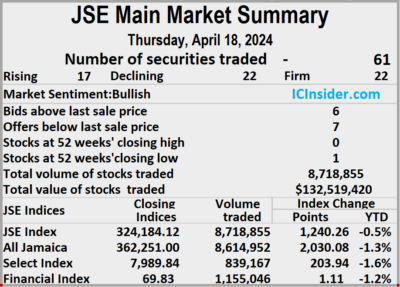 Kingston Wharves fell $4.61 to $26.09 with an exchange of 2,508,167 shares. Mayberry Jamaican Equities rallied 50 cents to end at $10.50 with 300 stocks crossing the market, NCB Financial dipped 97 cents in closing at $63 as investors exchanged 12,238 units, Sagicor Group lost 50 cents to close at $40.50 in trading 11,469 stock units. Sagicor Real Estate Fund rallied 98 cents to $7.98 after exchanging 546 shares, Scotia Group advanced 40 cents to finish at $44.90 with investors swapping 27,367 stocks, Seprod dropped 97 cents and ended at $81.20 after an exchange of 994 units. Stanley Motta rose 61 cents to close at $6.75 with investors transferring 973 stock units and Supreme Ventures slipped $1 in closing at $23.50 with 119,177 shares changing hands.
 In the preference segment, 138 Student Living preference share rallied $1 to end at $211 with investors dealing in 9 units and Productive Business Solutions 9.75% preference share sank $4.99 to $110.01 after trading 87 stocks.
Prices of securities trading are those for the last transaction of each stock unless otherwise stated.
Main Market slides on thin trading
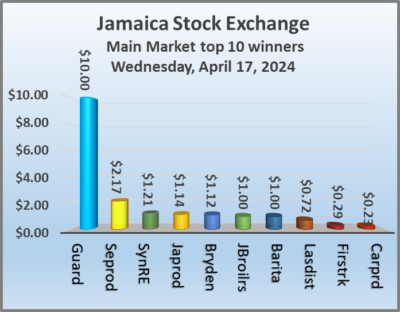
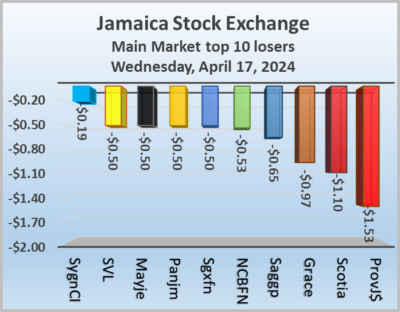
Trading dropped on the Jamaica Stock Exchange Main Market on Wednesday, with the volume of stocks traded declining 15 percent and the value 76 percent lower than on Tuesday, with trading in 61 securities compared with 59 on Tuesday, with prices of 21 stocks rising, 18 declining and 22 ending unchanged.
 Trading netted 7,107,320 shares for $37,509,746 compared with 8,349,044 units at $156,852,014 on Tuesday.
Trading averaged 116,513 shares at $614,914 compared to 141,509 units at $2,658,509 on Tuesday and month to date, an average of 954,617 units at $3,852,247, down from 1,031,265 units at $4,148,315 on the previous day and March with an average of 828,473 units at $2,341,254.
Wigton Windfarm led trading with 1.49 million shares for 20.9 percent of total volume followed by General Accident with 1.35 million units for 19 percent of the day’s trade in closing at a 52 weeks’ high of $6.20 and Lasco Distributors with 1.17 million units for 16.5 percent of the day’s trade.
The All Jamaican Composite Index sank 1,794.74 points to lock up trading at 360,220.92, the JSE Main Index dropped 1,004.10 points to lock up trading at 322,943.86 and the JSE Financial Index shed 0.36 points to cease trading at 68.72.
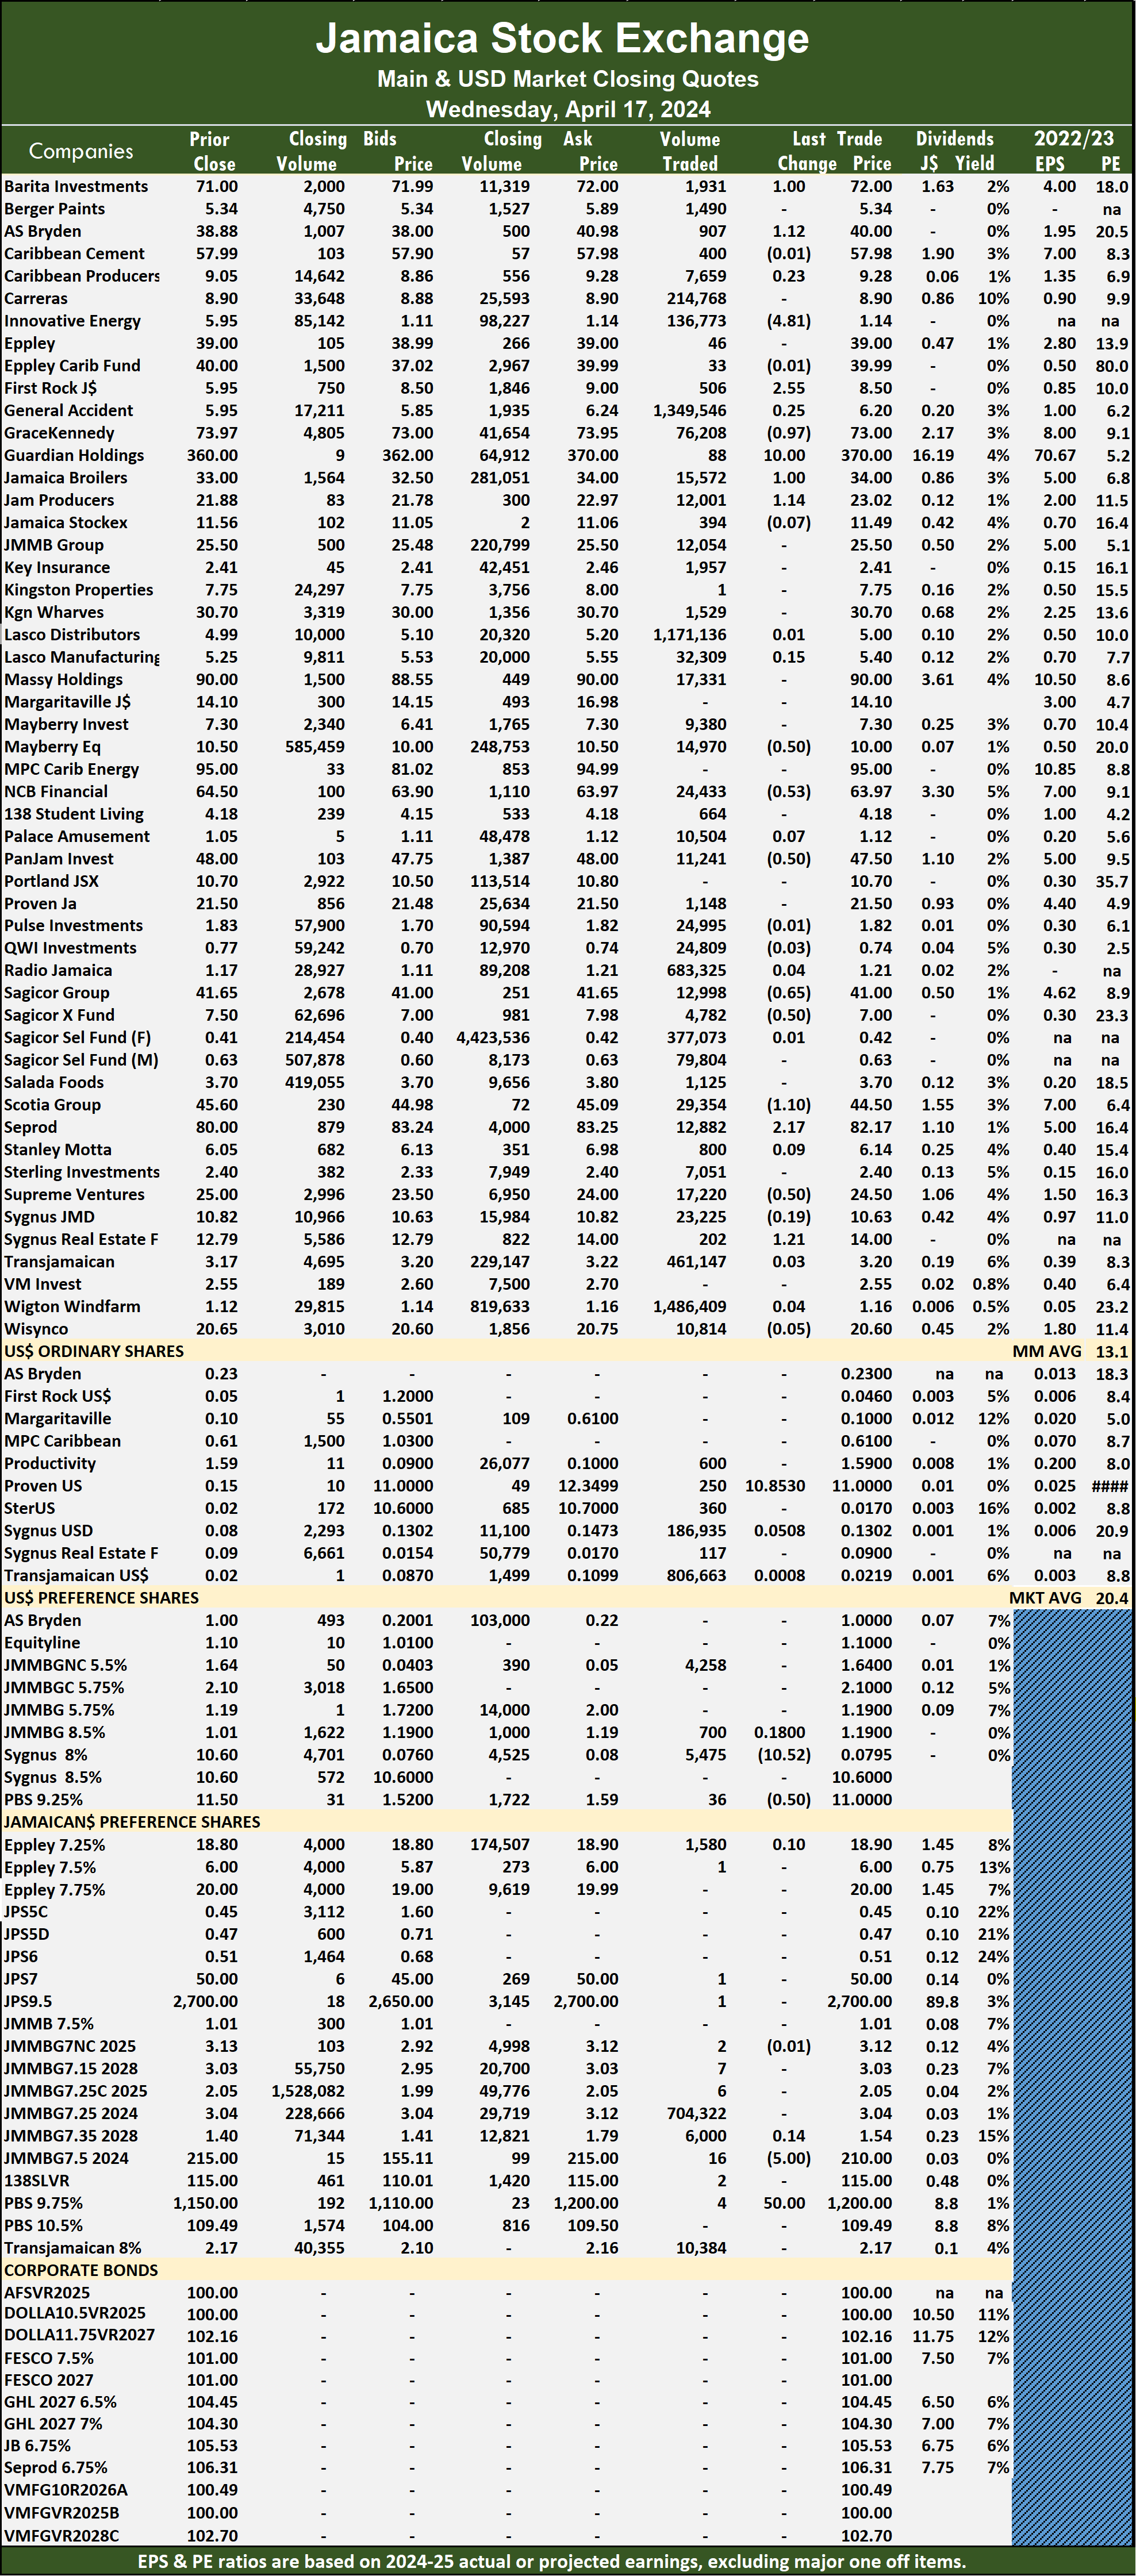
 The Main Market ended trading with an average PE Ratio of 13.8. The JSE Main and USD Market PE ratios are based on the last traded prices and earnings forecasts by ICInsider.com for companies with the financial year ending around August 2025.
Investor’s Choice bid-offer indicator shows 11 stocks ended with bids higher than their last selling prices and six with lower offers.
At the close, AS Bryden climbed $1.12 to $40 after a transfer of 907 units, Barita Investments increased $1 to finish at $72 with investors swapping 1,931 stocks, GraceKennedy slipped 97 cents and ended at $73 with a transfer of 76,208 shares. Guardian Holdings popped $10 in closing at $370 after trading 88 stock units, Jamaica Broilers gained $1 to close at $34 after an exchange of 15,572 shares, Jamaica Producers rose $1.14 to end at $23.02, with 12,001 stock units crossing the market. Mayberry Jamaican Equities sank 50 cents to $10 with traders dealing in 14,970 stocks, NCB Financial declined 53 cents and ended at $63.97 after 24,433 units crossed the exchange, Pan Jamaica lost 50 cents to finish at $47.50 with investors trading 11,241 stocks. 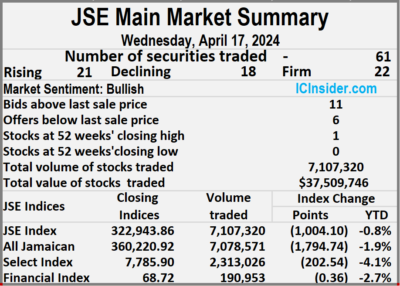 Sagicor Group fell 65 cents to close at $41 as 12,998 units passed through the market, Sagicor Real Estate Fund dipped 50 cents in closing at $7 after an exchange of 4,782 shares, Scotia Group shed $1.10 to end at $44.50 with investors dealing in 29,354 stock units. Seprod rallied $2.17 to close at $82.17 in an exchange of 12,882 shares, Supreme Ventures dropped 50 cents to close at $24.50 with investors transferring 17,220 stock units and Sygnus Real Estate Finance advanced $1.21 and ended at $14 in an exchange of 202 stocks.
In the preference segment, 138 Student Living preference share skidded $5 in closing at $210 with an exchange of 16 units and Productive Business Solutions 10.5 % preference share rose $50 to end at $1200 in trading 4 shares.
 Prices of securities trading are those for the last transaction of each stock unless otherwise stated.
Trading jumps on the JSE Main Market
Trading climbed on the Jamaica Stock Exchange Main Market on Tuesday, with 36 percent rise in the volume and after a 429 percent surge in value over Monday, with trading in 59 securities compared with 61 on Monday, with prices of 20 stocks rising, 18 declining and 21 ending unchanged.
 The market closed with 8,349,044 shares trading for $156,852,014 up from 6,145,603 units at $29,633,029 on Monday.
Trading averaged 141,509 shares at $2,658,509 compared to 100,748 units at $485,787 on Monday and month to date, an average of 1,031,265 units at $4,148,315, in comparison with 1,117,606 units at $4,292,885 on the previous day and March that closed with an average of 828,473 units at $2,341,254.
Sagicor Group led trading with 3.04 million shares for 36.4 percent of total volume followed by Wigton Windfarm with 1.63 million units for 19.5 percent of the day’s trade, Transjamaican Highway with 1.13 million units for 13.5 percent market share and General Accident with 1.08 million units for 12.9 percent of total volume.
The All Jamaican Composite Index sank 4,420.59 points to culminate at 362,015.66, the JSE Main Index skidded 3,062.56 points to lock up trading at 323,947.96 and the JSE Financial Index dipped 1.00 point to 69.08.
 The Main Market ended trading with an average PE Ratio of 13.1. The JSE Main and USD Market PE ratios are based on the last traded prices and earnings forecasts by ICInsider.com for companies with the financial year ending around August 2025.
Investor’s Choice bid-offer indicator shows 10 stocks ended with bids higher than their last selling prices and five with lower offers.
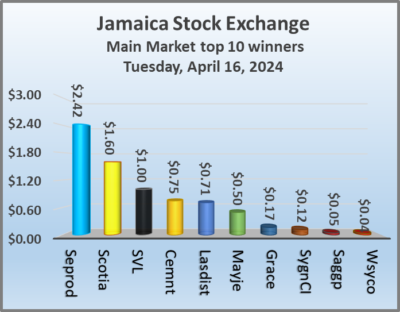
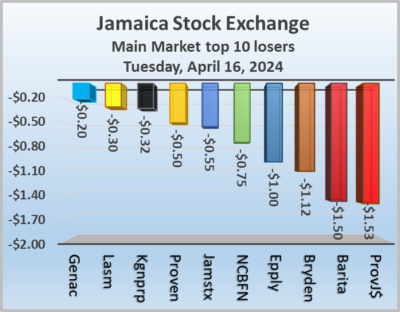
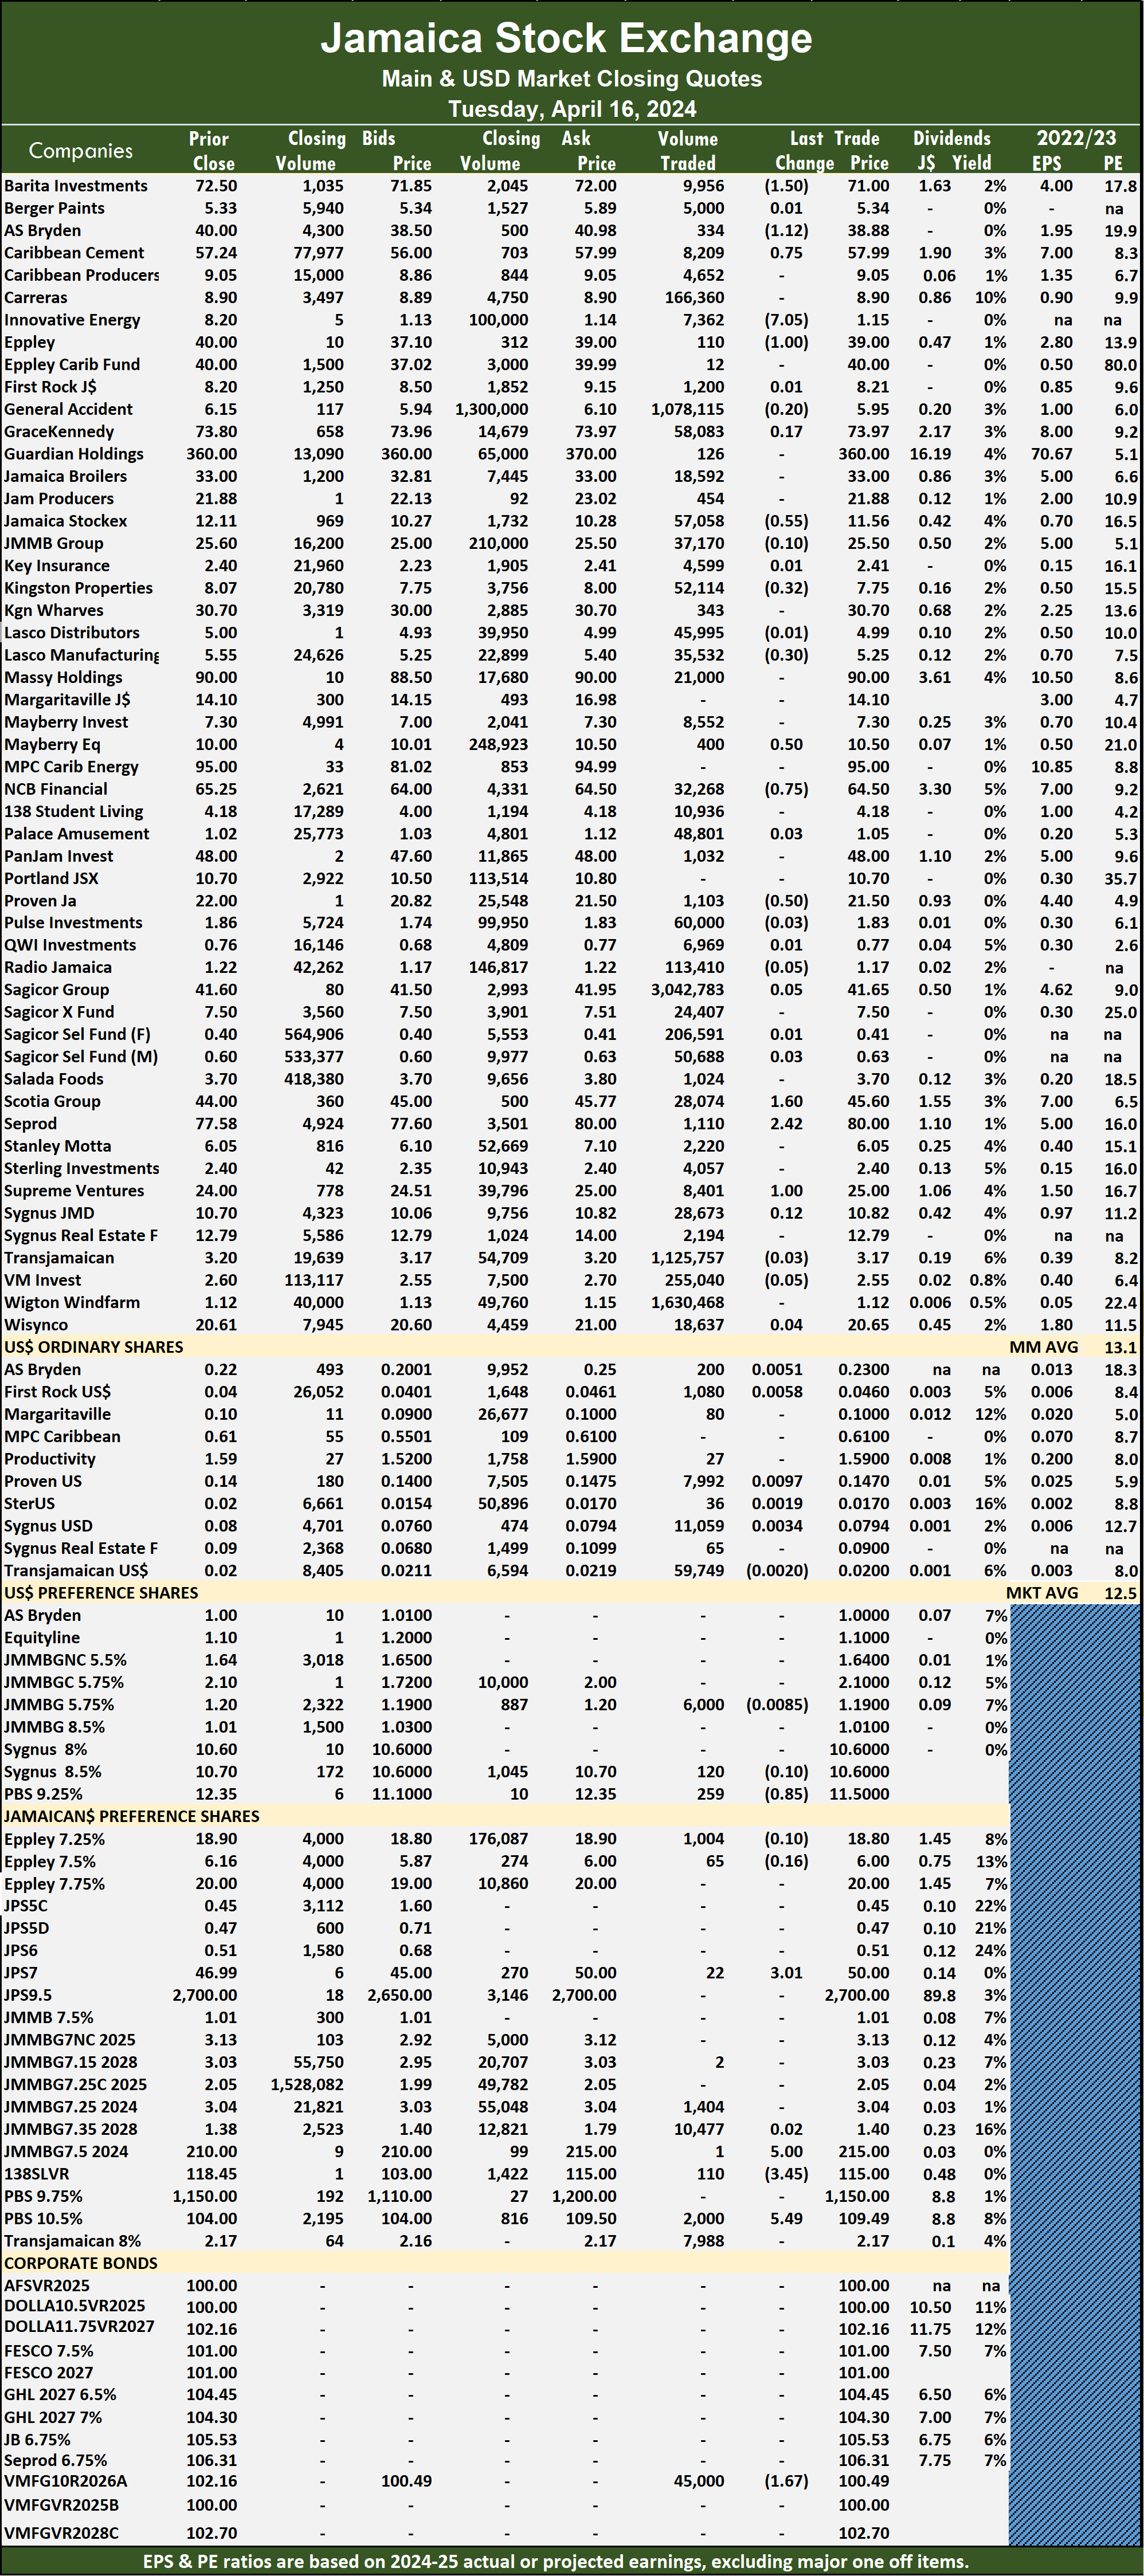
At the close, AS Bryden lost $1.12 to close at $38.88 after 334 shares were traded, Barita Investments slipped $1.50 and ended at $71 after 9,956 stocks passed through the market, Caribbean Cement gained 75 cents to close at $57.99 after a transfer of 8,209 shares. Eppley sank $1 to end at $39, with 110 stock units crossing the market, Jamaica Stock Exchange dropped 55 cents in closing at $11.56 with investors trading 57,058 shares, Kingston Properties shed 32 cents to finish at $7.75, with 52,114 stocks crossing the market. Lasco Manufacturing declined by 30 cents and ended at $5.25 after an exchange of 35,532 units, Mayberry Jamaican Equities rose 50 cents to $10.50 with 400 stock units clearing the market, 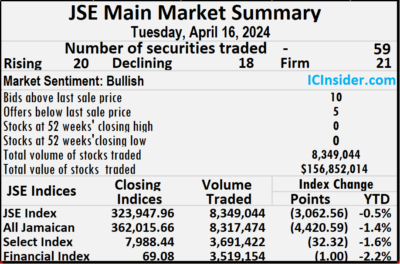 NCB Financial fell 75 cents to end at $64.50 with an exchange of 32,268 shares. Proven Investments dipped 50 cents to close at $21.50 after investors traded 1,103 stock units, Scotia Group rallied $1.60 to finish at $45.60 after an exchange of 28,074 stocks, Seprod increased $2.42 to end at $80 with traders dealing in 1,110 units and Supreme Ventures popped $1 to $25, with 8,401 stocks crossing the exchange.
In the preference segment, Jamaica Public Service 7% gained $3.01 to finish trading 22 units at $50, 138 Student Living preference share climbed $5 in closing at $215 after exchanging one share, Productive Business Solutions 9.75% preference share skidded $3.45 and ended at $115 with a transfer of 110 stock units and Sygnus Credit Investments C10.5% popped $5.49 to finish at $109.49 with investors dealing in 2,000 shares.
 Prices of securities trading are those for the last transaction of each stock unless otherwise stated.
Tepid Main Market trading
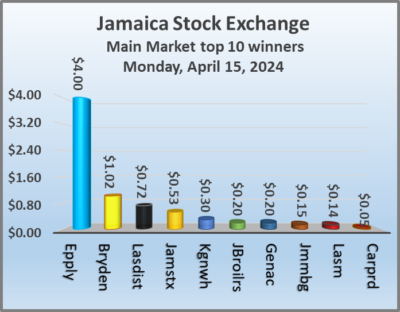
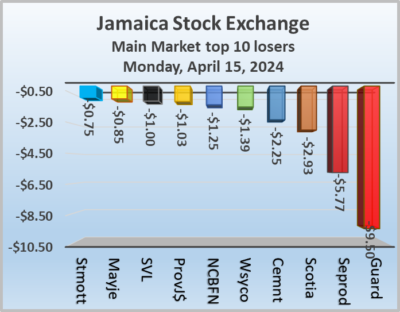
Trading activity dipped on the Jamaica Stock Exchange Main Market on Monday, with a 44 percent drop in the volume of stocks traded, with an 82 percent lower value than on Friday, following trading in 61 securities as was the case on Friday, with prices of 15 stocks rising, 28 declining and 18 unchanged.
 The market ended trading of 6,145,603 shares at $29,633,029 compared to 10,926,398 units at $160,297,742 on Friday.
Trading averaged 100,748 shares at $485,787 compared to 179,121 units at $2,627,832 on Friday and month to date, an average of 1,117,606 units at $4,292,885 compared with 1,231,003 units at $4,717,442 on the previous day and March with an average of 828,473 units at $2,341,254.
Transjamaican Highway led trading with 2.33 million shares for 37.9 percent of total volume followed by Wigton Windfarm with 1.53 million units for 25 percent of the day’s trade and Sagicor Select Manufacturing & Distribution Fund with 541,191 stocks for 8.8 percent market share.
The All Jamaican Composite Index lost 64.70 points to close at 366,436.25, the JSE Main Index rose 255.28 points to end the day at 327,010.52 and the JSE Financial Index shed 0.11 points to end at 70.08.
 The Main Market ended trading with an average PE Ratio of 13.1. The JSE Main and USD Market PE ratios are based on the last traded prices and earnings forecasts by ICInsider.com for companies with the financial year ending around August 2025.
Investor’s Choice bid-offer indicator shows 10 stocks ended with bids higher than their last selling prices and eight with lower offers.
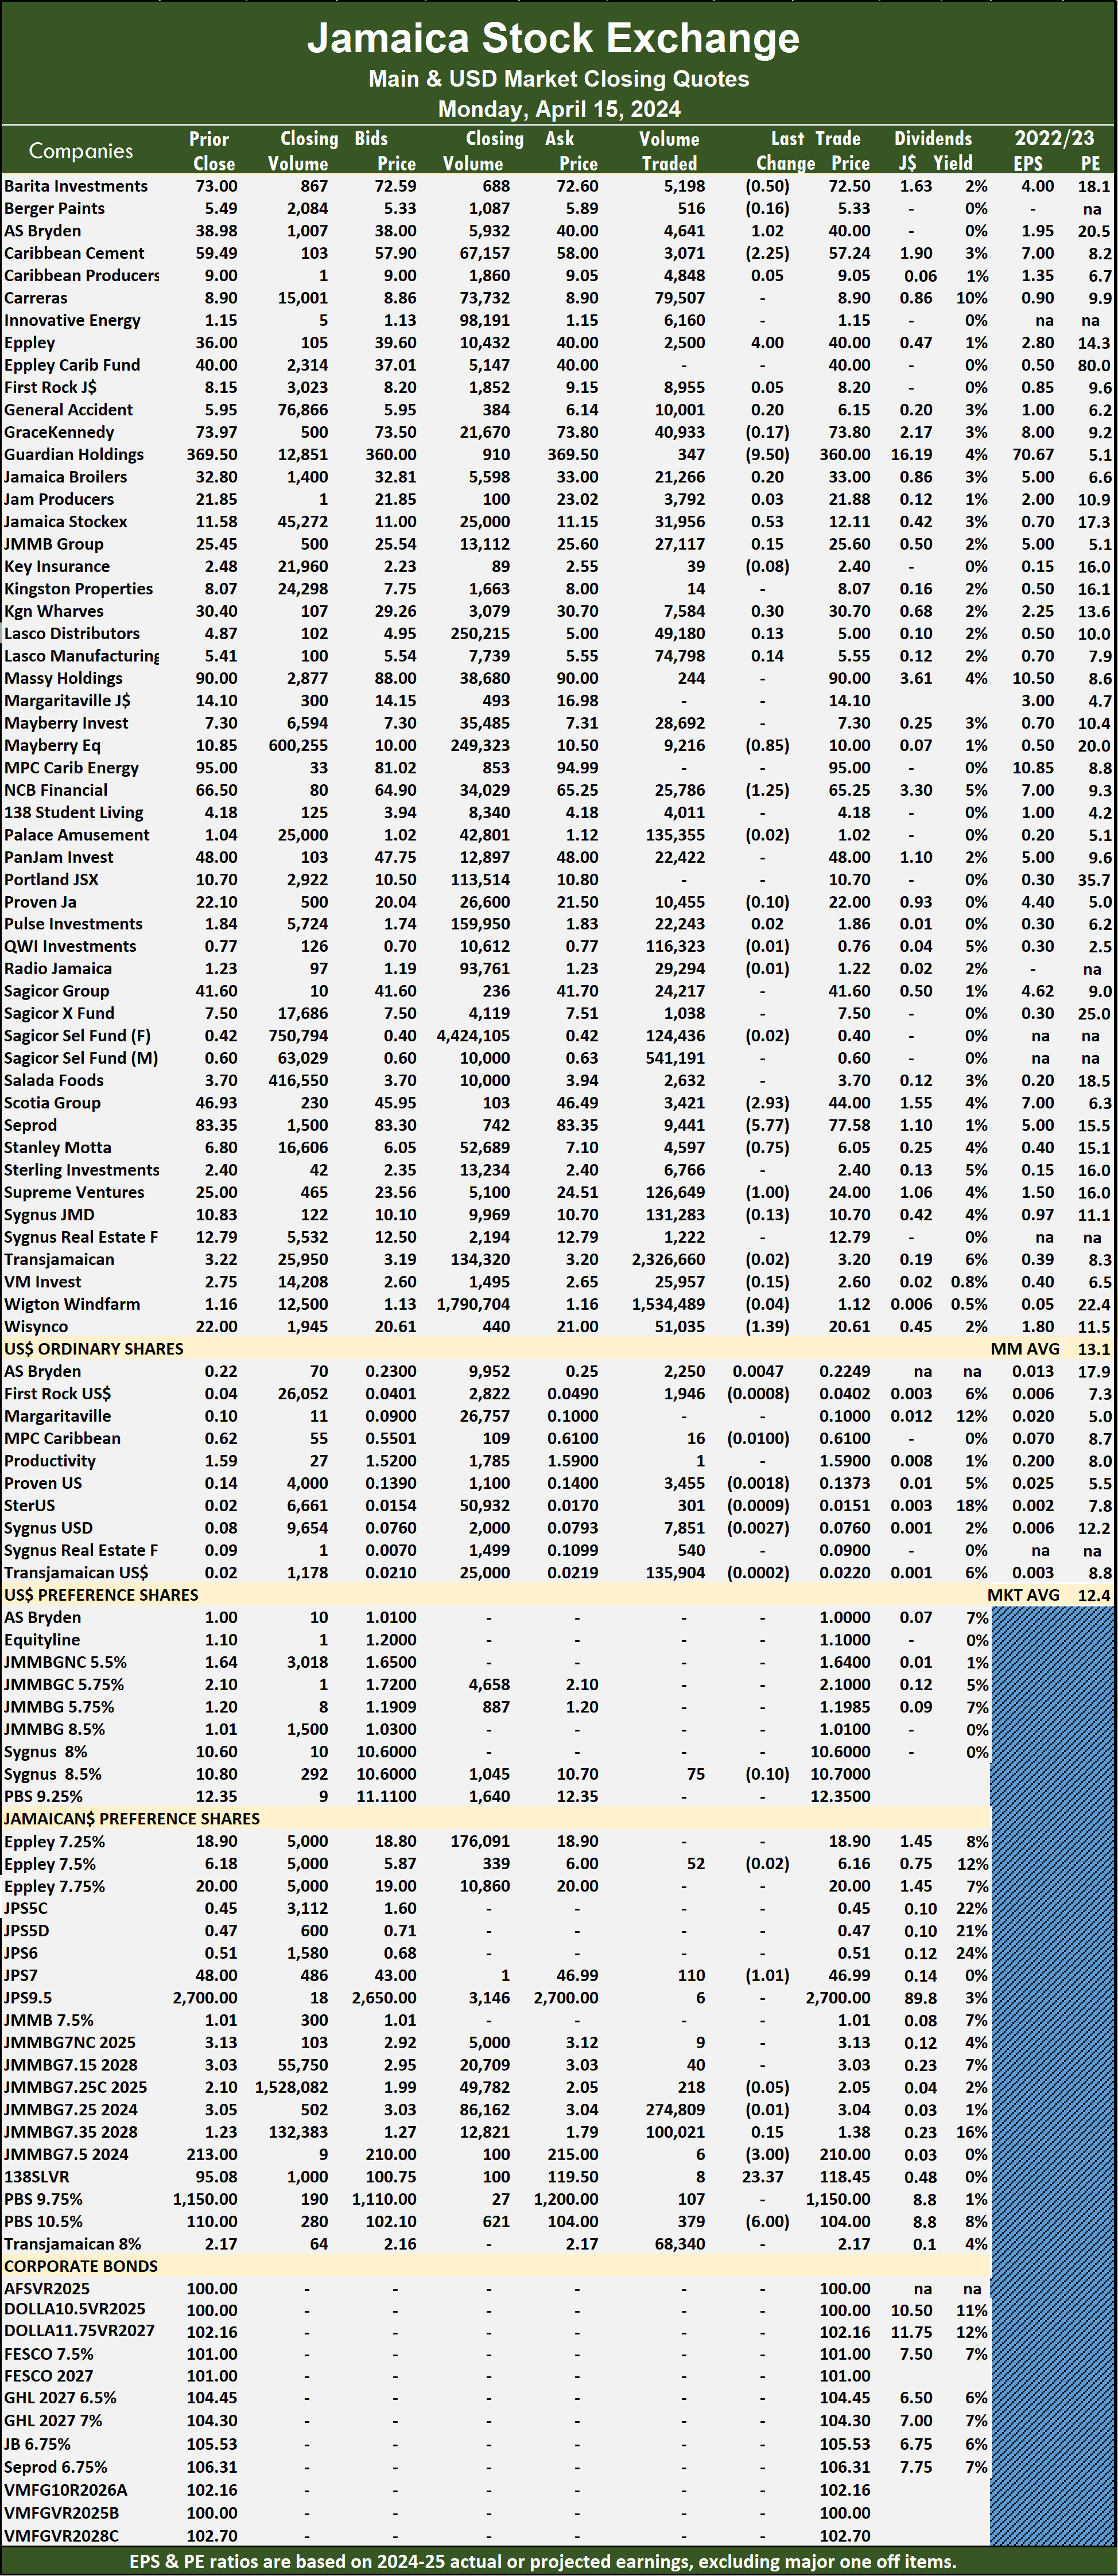
At the close, AS Bryden increased $1.02 and ended at $40 with investors trading 4,641 shares, Barita Investments shed 50 cents to $72.50 in an exchange of 5,198 shares, Caribbean Cement lost $2.25 in closing at $57.24 with investors swapping 3,071 units. Eppley climbed $4 to close at $40 with a transfer of 2,500 stocks, Guardian Holdings sank $9.50 to finish at $360 after exchanging 347 units, Jamaica Stock Exchange rose 53 cents to end at $12.11 in switching ownership of 31,956 stocks. Kingston Wharves advanced 30 cents to $30.70 after a transfer of 7,584 shares, Mayberry Jamaican Equities fell 85 cents to finish at $10, with 9,216 stock units crossing the exchange, NCB Financial dropped $1.25 and ended at $65.25 with traders dealing in 25,786 shares. 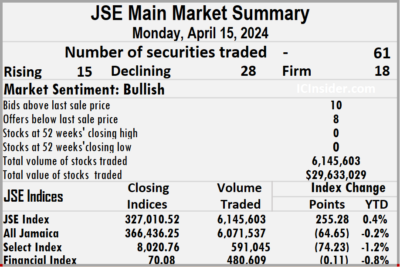 Scotia Group declined $2.93 to end at $44 in an exchange of 3,421 units, Seprod dipped $5.77 in closing at $77.58 with 9,441 stocks clearing the market, Stanley Motta slipped 75 cents to close at $6.05 with an exchange of 4,597 stock units. Supreme Ventures skidded $1 to $24 after 126,649 shares crossed the market and Wisynco Group dropped $1.39 to finish at $20.61 as investors exchanged 51,035 units.
In the preference segment, Jamaica Public Service 7% slipped $1.01 and ended at $46.99, with 110 stocks crossing the market, 138 Student Living preference share lost $3 to end at $210 after an exchange of 6 stock units, Productive Business Solutions 9.75% preference share popped $23.37 in closing at $118.45 with investors transferring 8 shares and Sygnus Credit Investments C10.5% dipped $6 to close at $104 after 379 stock units passed through the market.
 Prices of securities trading are those for the last transaction of each stock unless otherwise stated.


