Blue Power with a gain of 62 percent top the list of 17 stocks that gained on the Junior Market of the Jamaica Stock Exchange to the end of November this year with the Junior Market losing 3.3 percent in value for the same period even as market interest rates have been reduced from a high of just under 12 percent to 6.7 percent.
 Iron Rock Insurance delivered capital gains of 54 percent as the next best following robust 2023 and nine months of profit for the current year. Everything Fresh that is enjoying an about turn in profitability after the fall out in business caused by the downturn in the tourism sector up to 2023, benefited with a jump the stock price of 45 percent, Tropical Battery delivered a 32 percent rise for its shareholders followed by Caribbean Assurance Brokers and Honey Bun with 31 percent each. Regency Petroleum buoyed by expansion of the gas stations network delivered gains of 29 percent.
Winning stocks were no match for those declining with the top 10 losing stocks clocking losses  from 29 to 80 percent and 30 stocks declining from a low of one percent upwards. The troubled EduFocal was the leading loser and dropped a massive 80 percent, KLE Group was next with a decline of 46 percent followed by MFS Partners down 75 percent, CAC 2000 chipped in at 58 and Medical Disposables 37 percent.
 During trading Caribbean Cement price hit a 52 weeks’ intraday high of $75.10 but it closed at $74, Pan Jamaica closed at a 52 weeks’ high of $56.90, Jamaica Public Service 9.5% ended at $2,690, after trading at a 52 weeks Intraday high of $3,280.16 and Pulse Investments traded at an intraday low of $1, but bounced back to close at $1.16.
 The market indices jumped sharply, helped by a big price movement in Pan Jamaica and Sagicor Group, as the All Jamaican Composite Index popped 6,733.96 points to close at 369,925.68, the JSE Main Index increased 5,333.88 points to 321,591.49 and the JSE Financial Index advanced 1.75 points to settle at 65.52. The Investor’s Choice bid-offer indicator shows 17 stocks ended with bids higher than their last selling prices and six with lower offers.
 Margaritaville gained 81 cents in closing at $15.10 after an exchange of just 4 units. Massy Holdings climbed $1.90 to $79.90 with 137 stocks changing hands, Pan Jamaica rallied $6.90 to end at a 52 weeks’ high of $56 with 500,762 stock units crossing the exchange, Sagicor Group increased $3.10 in closing at $40.10 in switching ownership of 319,580 shares. Sagicor Real Estate Fund climbed 60 cents to $8.50 after an exchange of 357,268 stocks and Sygnus Credit Investments fell 70 cents to finish at $12 trading 24,961 units.
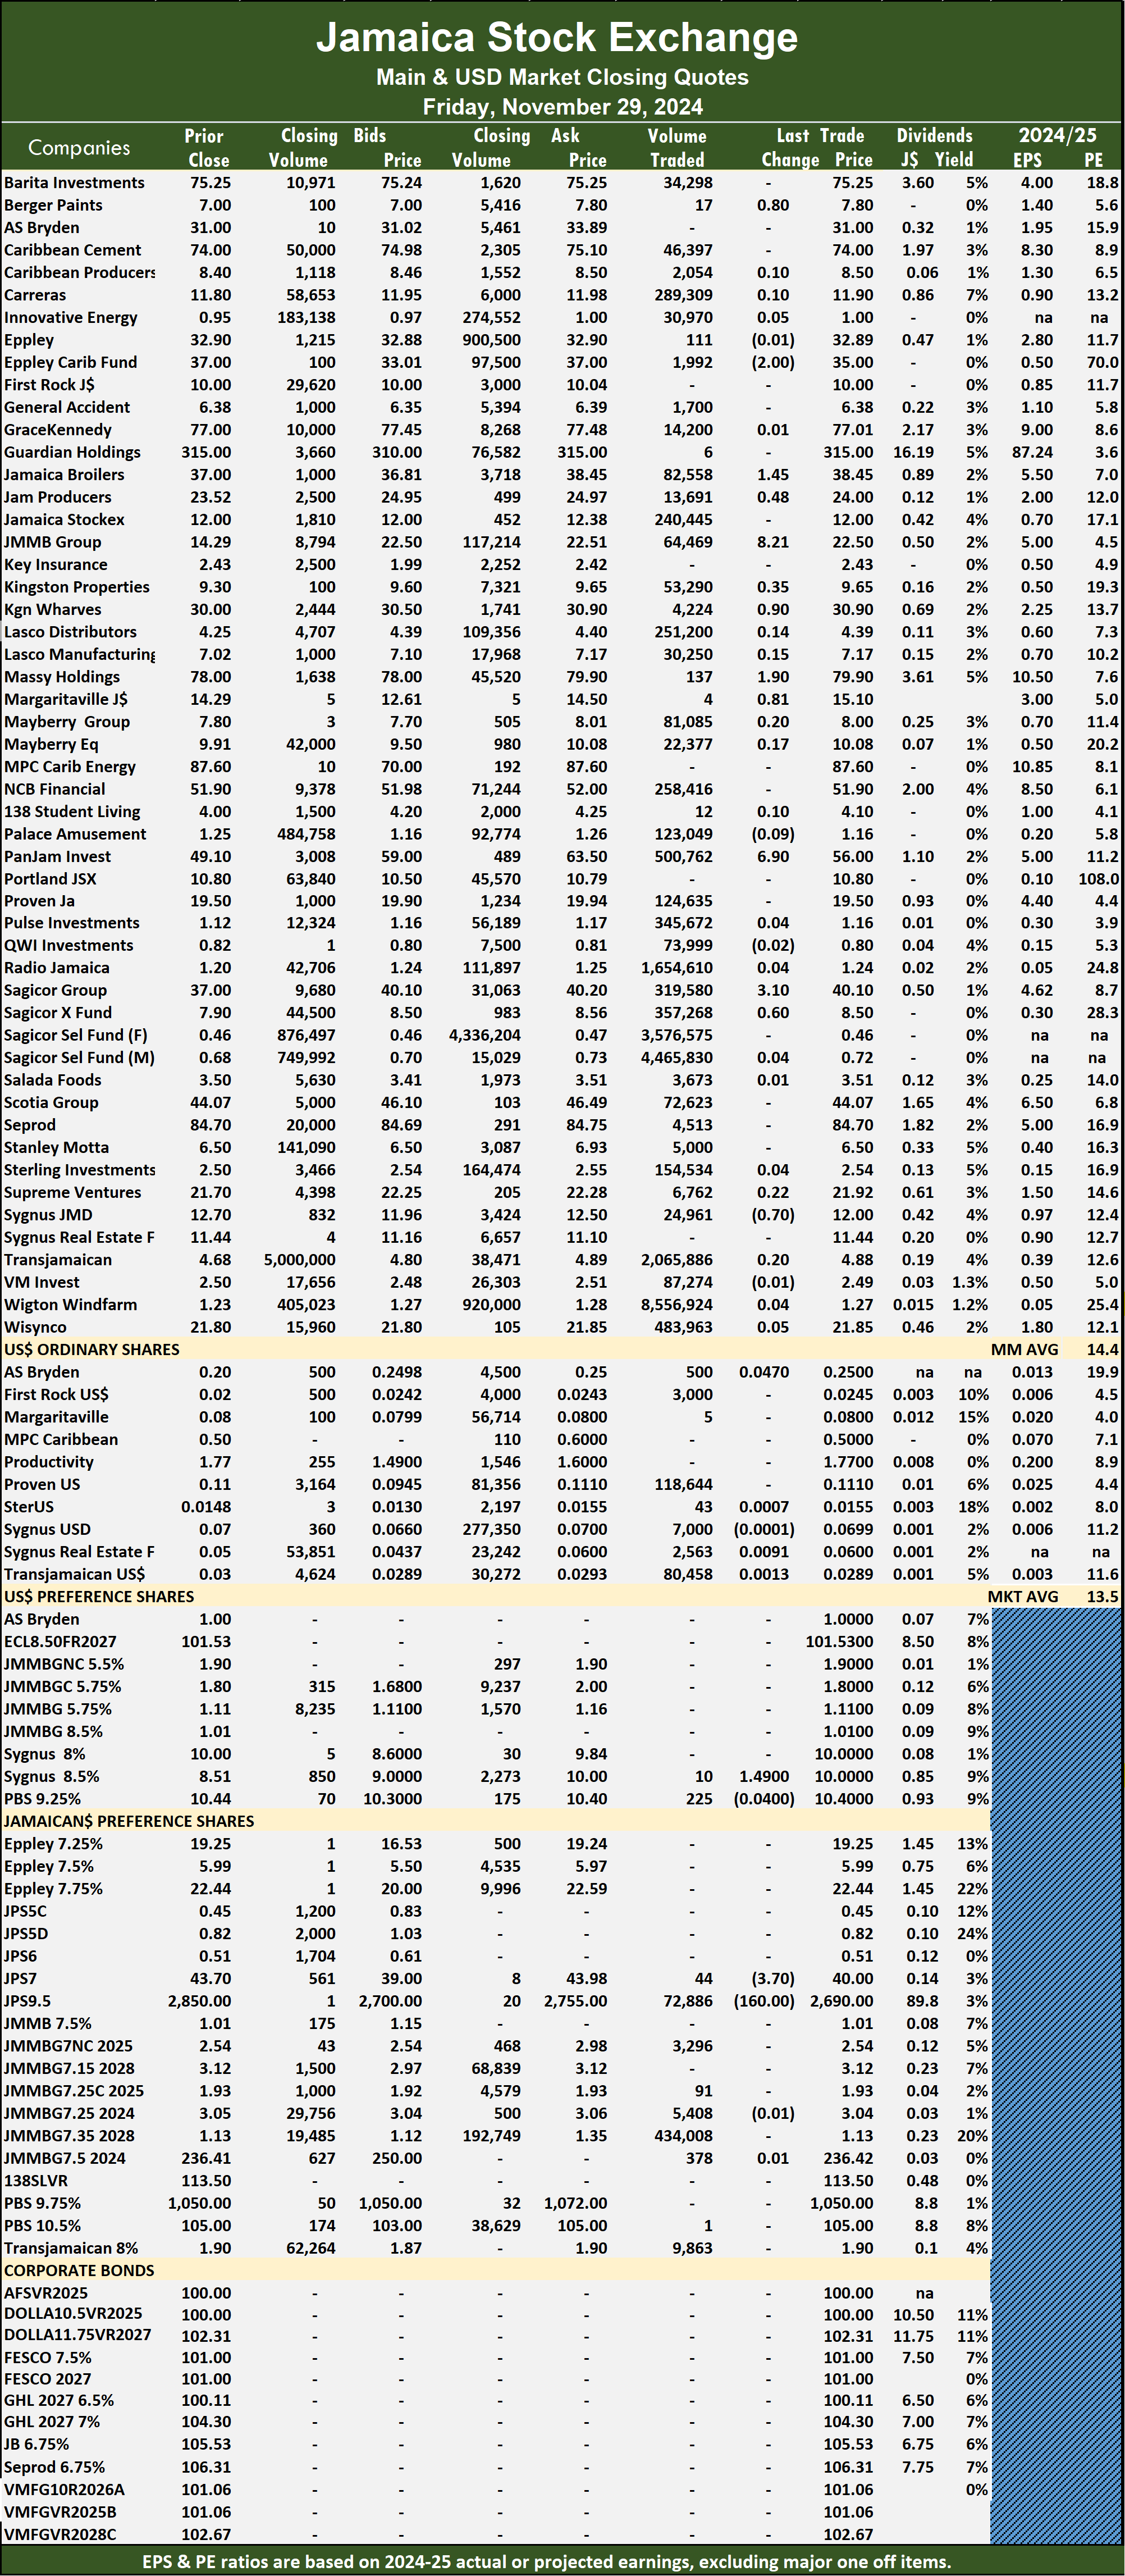 Prices of securities trading are those for the last transaction of each stock unless otherwise state
 The market closed with trading of 11,969,953 shares for $29,144,541 down from 14,349,215 stock units at $30,292,181 on Thursday. Trading ended with an average of 272,044 shares at $662,376 compared with 326,119 stock units at $688,459 on Thursday with the month to date, averaging 309,920 units at $766,307 compared to 311,801 stock units at $771,468 on the previous day and October with an average of 196,034 shares at $399,810.
 At the close of trading, the Junior Market Index sank 10.13 points to 3,722.52. The Investor’s Choice bid-offer indicator shows seven stocks ended with bids higher than their last selling prices and one with a lower offer.
 Honey Bun increased 16 cents to end at $8.37 with an exchange of 1,193 stocks. Indies Pharma popped 12 cents to $3.15 after 121,651 shares passed through the market, JFP Ltd gained 7 cents in closing at $1.03 with investors swapping 199,878 stock units, KLE Group declined 35 cents to end at $1.05 after an exchange of 680 shares. Medical Disposables shed 30 cents and ended at $1.70, with 18,000 stocks crossing the market, Paramount Trading dropped 22 cents to close at $1.05 as investors exchanged 26,604 units, Regency Petroleum advanced 15 cents to finish at $3.20 after a transfer of 2,158,054 stock units and Stationery and Office Supplies rose 18 cents and ended at $1.68 with 1,654,271 shares changing hands.
 Prices of securities trading are those for the last transaction of each stock unless otherwise stated.
 At the close of the market, the JSE Combined Market Index jumped 5,027.33 points to 334,224.34, the All Jamaican Composite Index surged 6,733.96 points to settle at 369,925.68, the JSE Main Index climbed 5,333.88 points to finish at 321,591.49, the Junior Market Index sank 10.13 points to close at 3,722.52 and the JSE USD Market Index jumped 15.50 points to wrap up trading at 267.86.
 The ICInsider.com PE ratio chart and other more detailed daily charts provide investors with regularly updated information to help decision-making. The PE ratio chart covers all ordinary shares on the Jamaica Stock Exchange, grouped by industry, allowing for easy comparisons within a sector and the overall market. The earnings per share (EPS) and PE ratios are based on 2024 and 2024 actual or projected earnings, excluding any major time income or expenses.
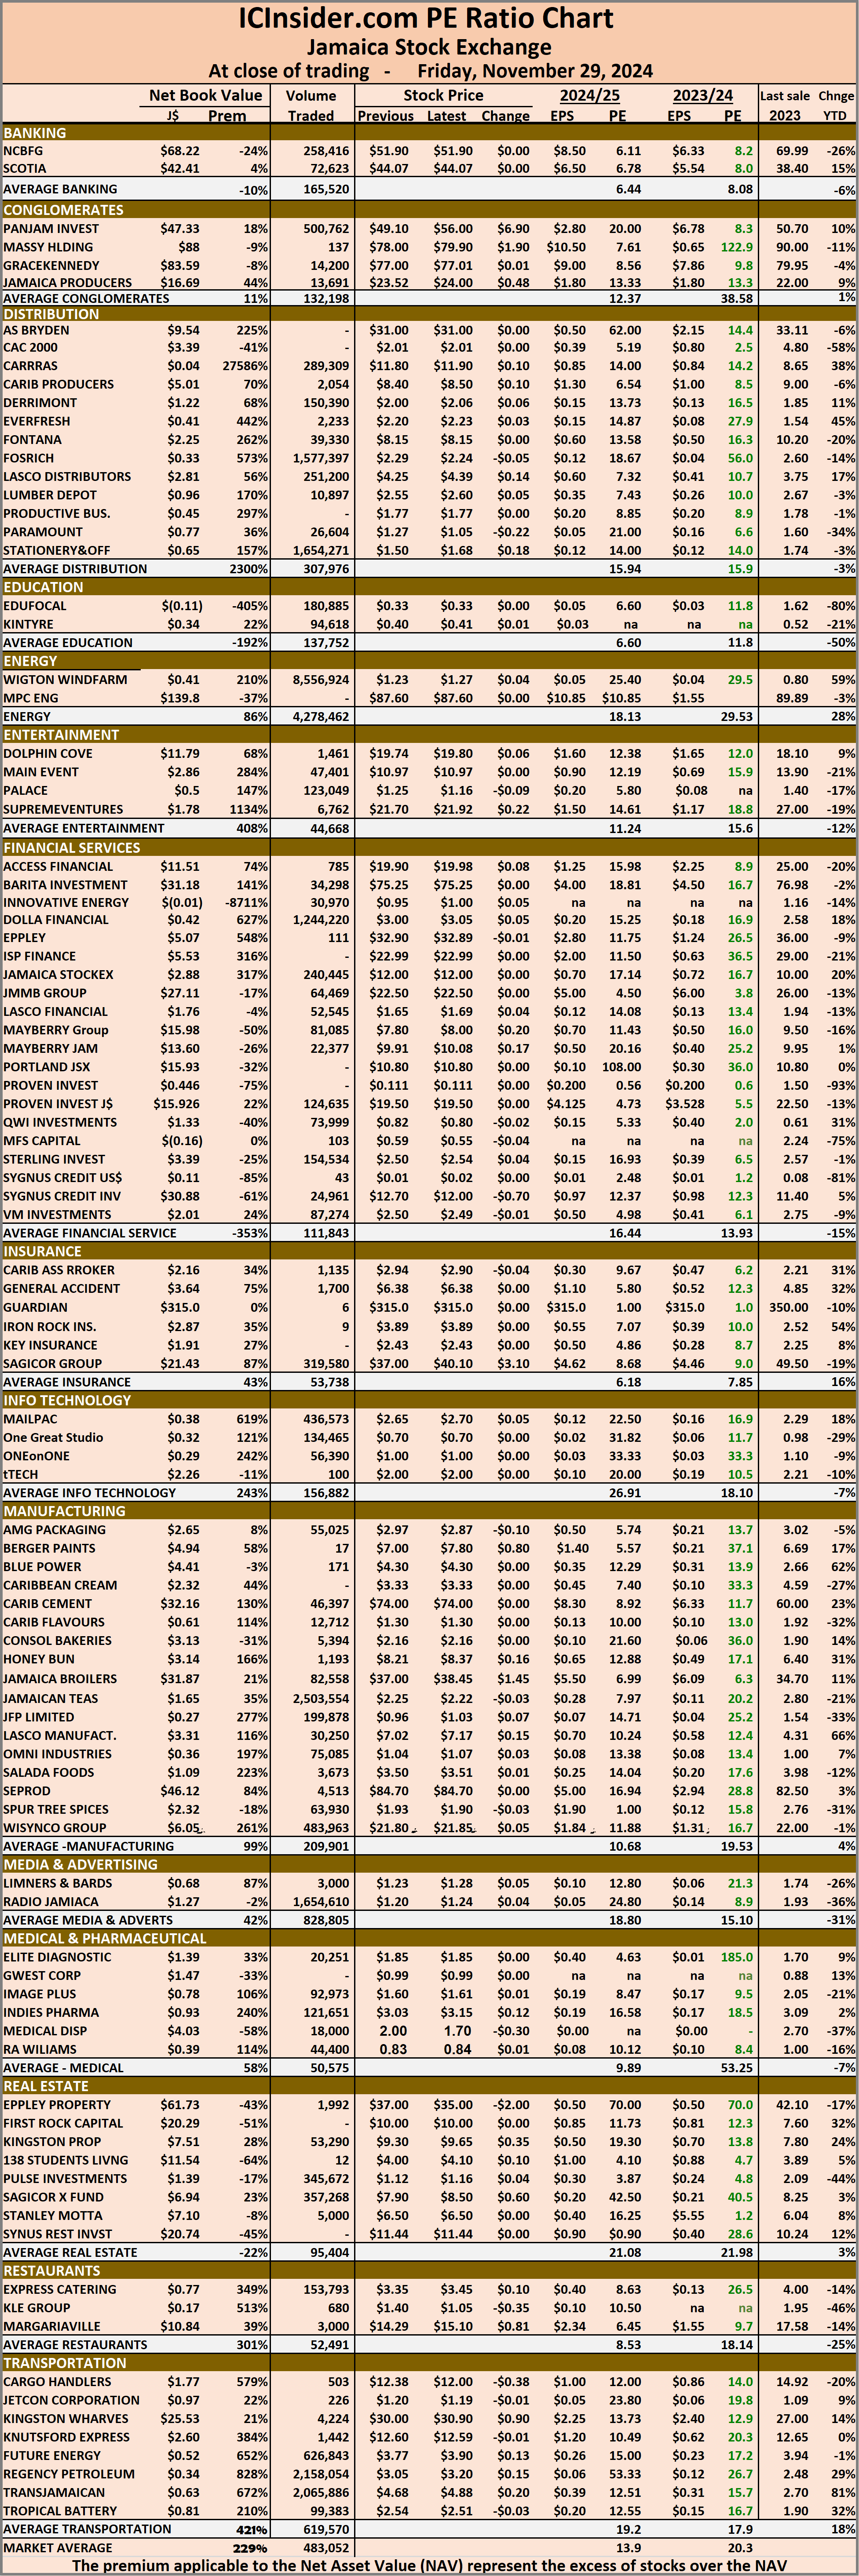 Dividends that are paid or are due to be paid and yields for each company are shown in the Main and Junior Markets’ daily report charts, along with the closing volume of the highest bid and the lowest offer for each company.

 At the close of trading, the Junior Market Index popped 20.90 points to wrap up trading at 3,732.65. The Investor’s Choice bid-offer indicator shows four stocks ended with bids higher than their last selling prices and six with lower offers.
 Fontana rallied 15 cents to end at $8.15 with 6,729 units crossing the market. Future Energy gained 7 cents to end at $3.77 after investors exchanged 31,203 stocks, Honey Bun lost 22 cents to close at $8.21 after 1,993 stock passed through the market, Kintyre Holdings formerly iCreate, ended at 40 cents with investors trading 60,000 shares. Lasco Financial rose 10 cents to close at $1.65 after an exchange of 458,930 stock units, Lumber Depot gained 10 cents to finish at $2.55 with 348,726 stock units crossing the market, Mailpac Group popped 15 cents and ended at $2.65 with an exchange of 267,008 stock units. Main Event increased 17 cents to $10.97 after investors ended trading 72,028 shares, One Great Studio climbed 9 cents to finish at 70 cents with 387,033 units crossing the exchange, Regency Petroleum rallied 20 cents and ended at $3.05 in switching ownership of 2,395,167 stocks. Stationery and Office Supplies dipped 8 cents to close at $1.50 after a transfer of 139,899 stock units and tTech fell 30 cents in closing at $2 in trading 1,632 shares.
 Prices of securities trading are those for the last transaction of each stock unless otherwise stated.
 The market closed with 20,497,403 shares being traded at $168,382,641 compared with 23,114,868 stocks at $103,556,387 on Wednesday.
 The Main Market ended trading with an average PE Ratio of 14.3. The JSE Main and USD Market PE ratios are based on last traded prices and earnings forecasts by ICInsider.com for companies with the financial year ending around August 2025.
 Pan Jamaica dropped $2.65 in closing at $49.10 with investors trading 200,142 stock units, Proven Investments advanced 50 cents to end at $19.50 in switching ownership of 119,370 units, Sagicor Group skidded $1 to close at $37 after 2,925 stocks changed hands. Sagicor Real Estate Fund climbed 50 cents to $7.90 with an exchange of 141,901 units, Scotia Group dipped $1.95 and ended at $44.07, with 125,200 stocks crossing the market, Seprod increased 70 cents to end at $84.70 after an exchange of 1,996 shares and Supreme Ventures slipped 59 cents to $21.70 in trading 29,285 stock units.
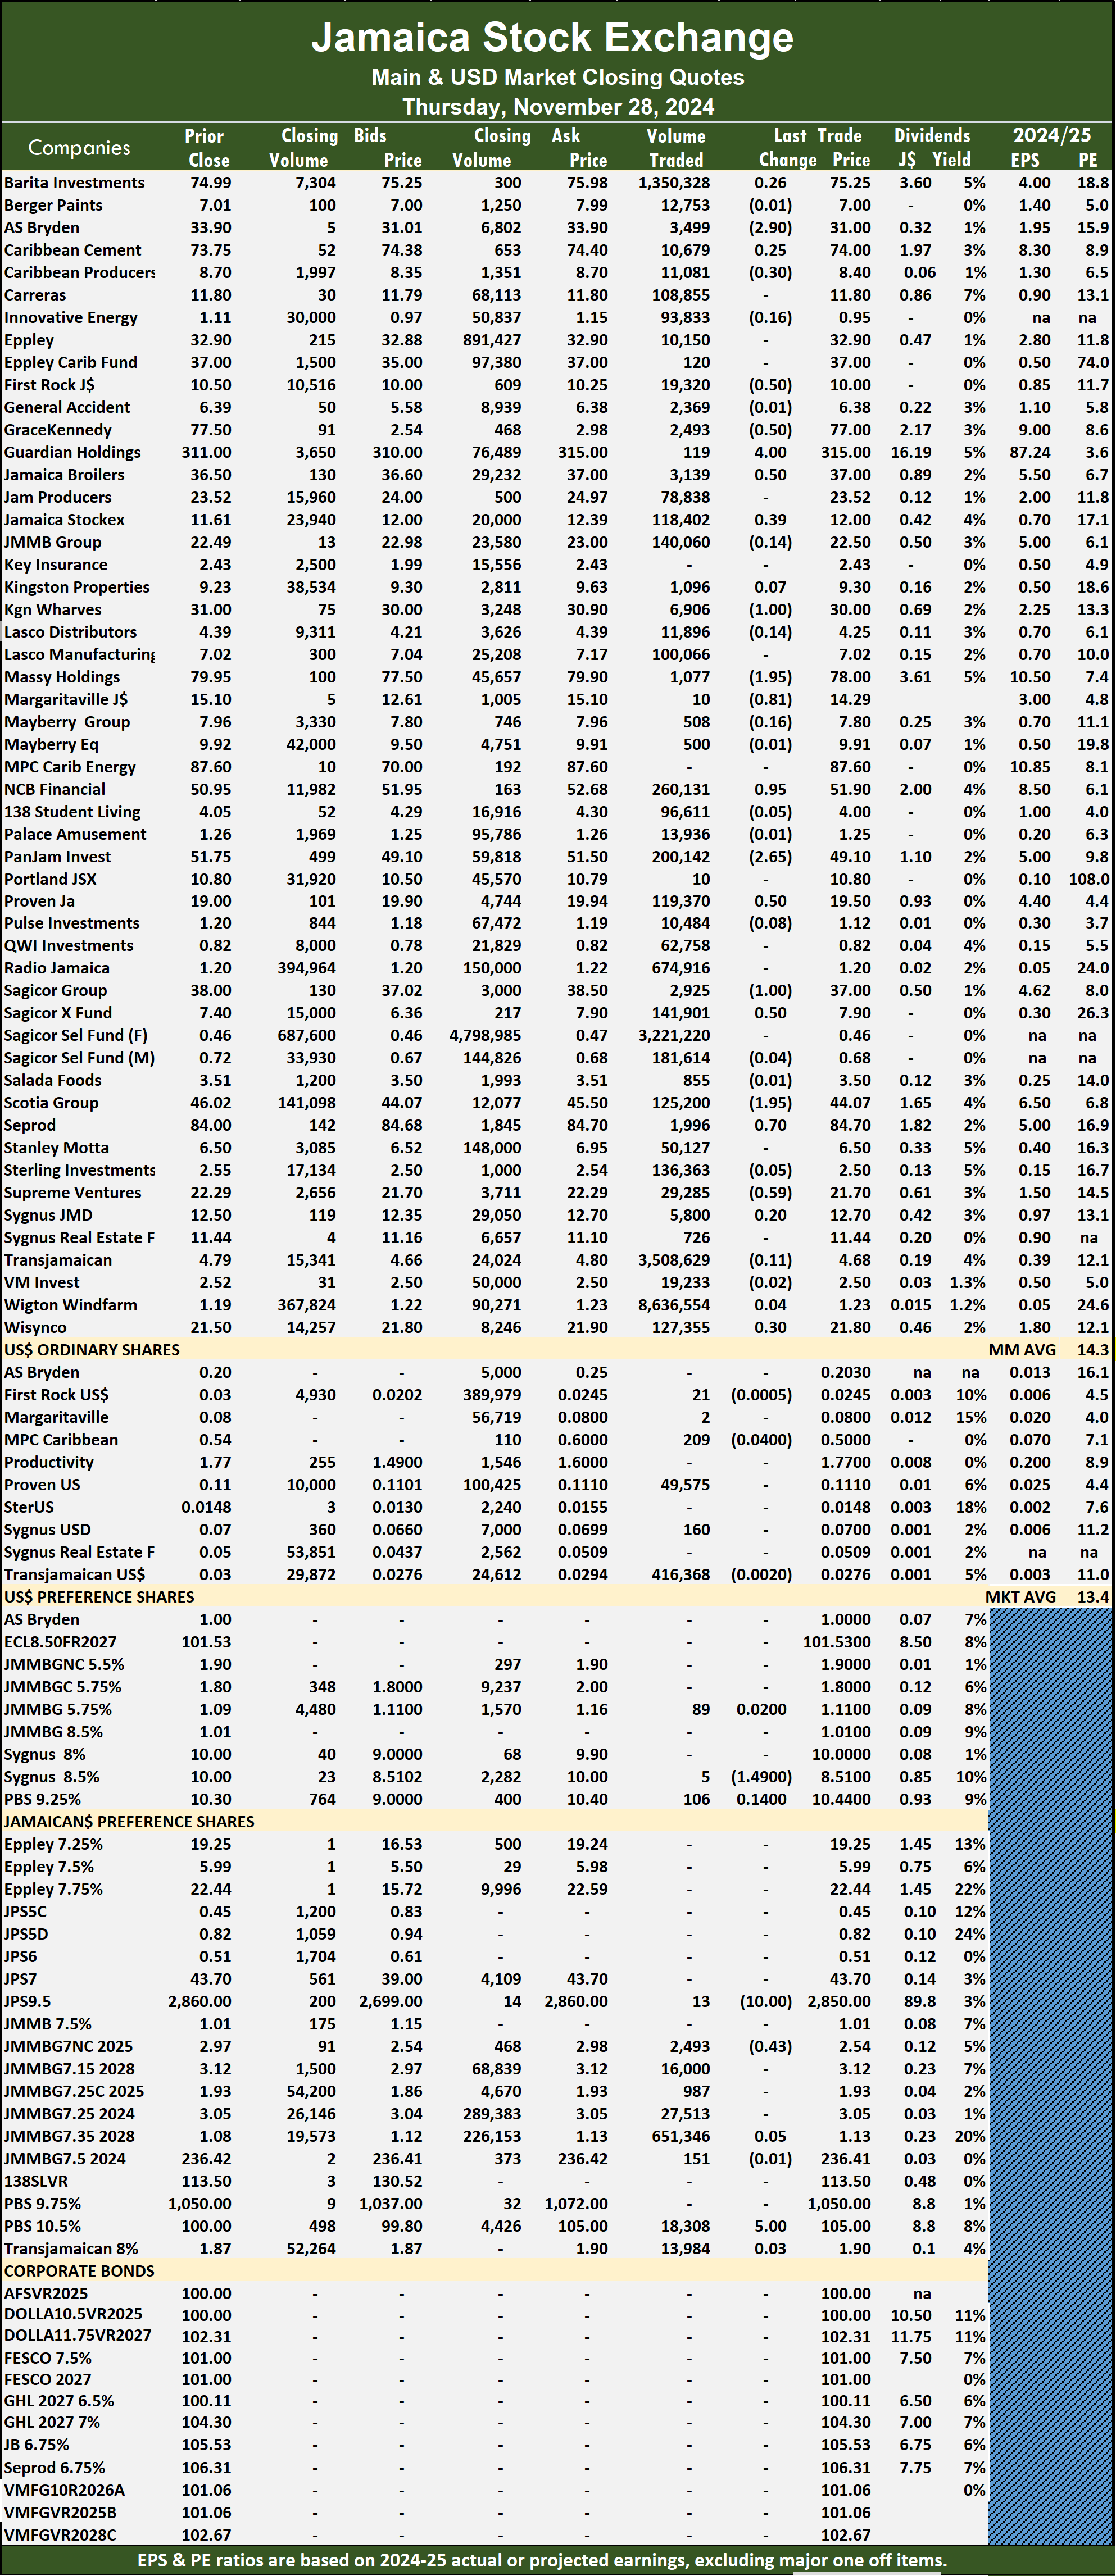 Prices of securities trading are those for the last transaction of each stock unless otherwise stated.
 Investors who buy when the price of a stock is close to the average will find that they are not inclined to overpay for a stock. The net asset value of each company is incorporated into the chart. Investors can use this measure in assessing stock values. The chart also shows daily changes in stock prices and the percentage year to date price movement based on the last traded prices. Dividends that are paid or are due to be paid and yields for each company are shown in the Main and Junior Markets’ daily report charts, along with the closing volume of the highest bid and the lowest offer for each company.
 The market closed with 23,114,868 shares trading for $103,556,387 from 26,500,977 stocks at $154,386,911 on Tuesday. Trading averaged 361,170 shares at $1,618,069 compared with 441,683 stock units at $2,573,115 on Tuesday and for the month to date, an average of 275,256 stock units at $2,382,196 compared with 270,088 shares at $2,428,159 on the previous day and October with an average of 205,025 stock units at $2,311,672.
 The Main Market ended trading with an average PE Ratio of 14. The JSE Main and USD Market PE ratios are based on last traded prices and earnings forecasts by ICInsider.com for companies with the financial year ending around August 2025.
 Sagicor Group popped $1 to finish at $38 after a transfer of 27,011 units, Salada Foods increased 41 cents to end at $3.51 with traders dealing in 3,277 shares, Scotia Group skidded 48 cents in closing at $46.02 in switching ownership of 23,563 stock units. Seprod sank 60 cents to $84 with investors trading 4,823 shares, Stanley Motta shed 45 cents and ended at $6.50 after an exchange of 19,812 units and Sygnus Real Estate Finance climbed 44 cents to end at $11.44 after 10,180 stocks passed through the market.
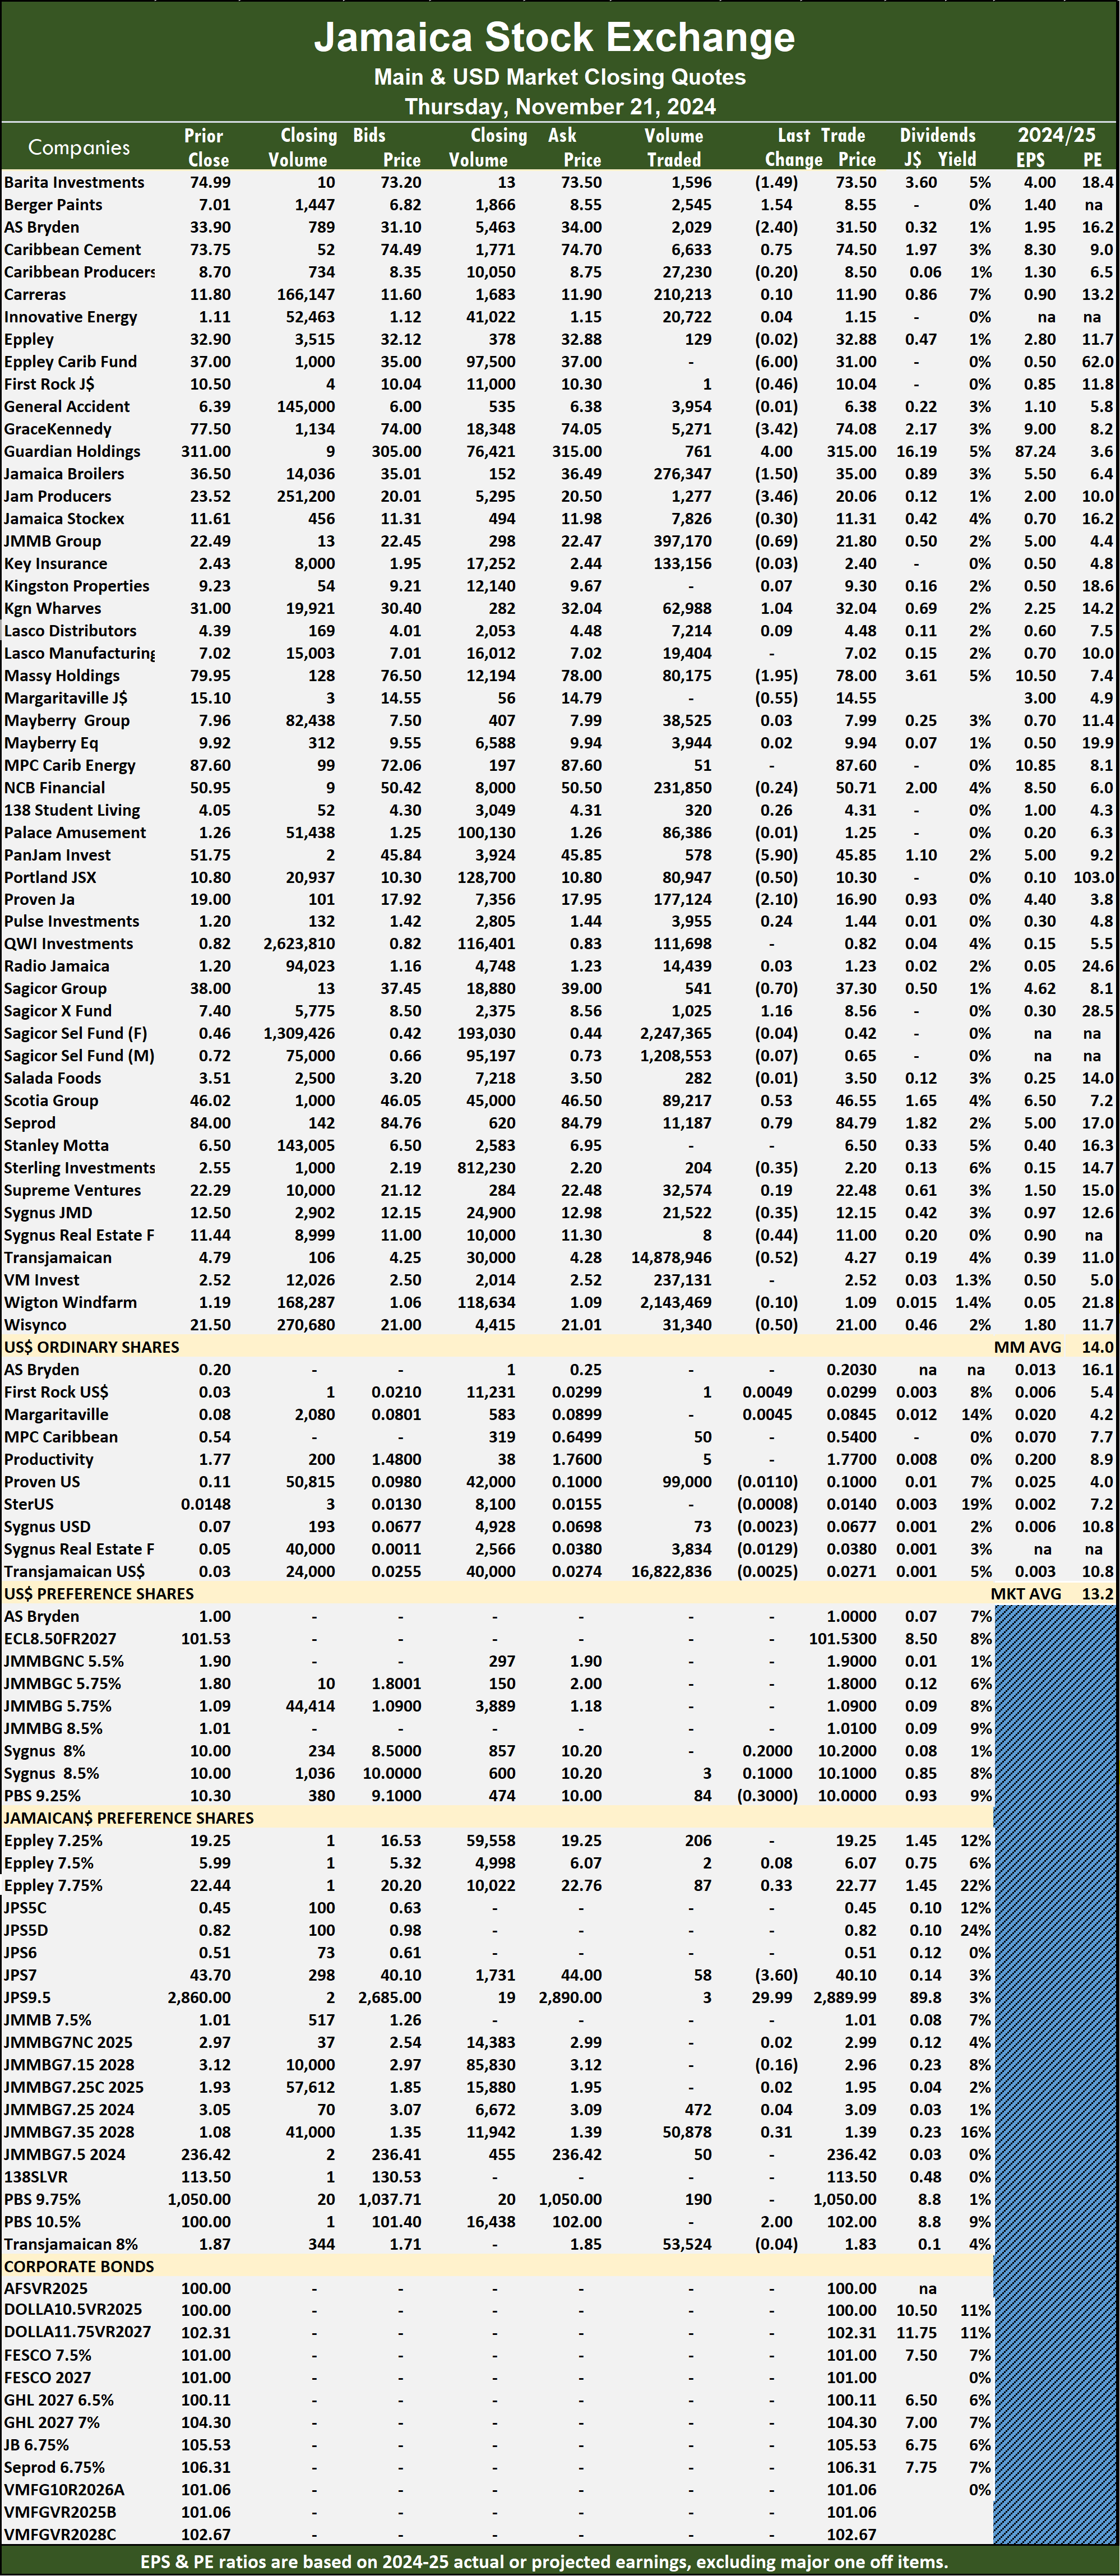 Jamaica Public Service 9.5% declined $29.99 to finish at $2,860 with 10 stocks crossing the market and Productive Business Solutions 10.5% preference share gained $15 to land at $1,050 as investors exchanged 100 units.
 The market closed with trading of 9,643,194 shares for $19,408,961 compared with 6,227,341 units at $12,307,314 on Tuesday.
 The Junior Market ended trading with an average PE Ratio of 13.1, based on last traded prices in conjunction with earnings projected by ICInsider.com for financial years ending around August 2025.
 Jetcon Corporation lost 14 cents to $1.19 in an exchange of 11 shares, Lumber Depot declined 10 cents to end at $2.45 after investors traded 32,179 stock units, Mailpac Group rallied 25 cents in closing at $2.50 with a transfer of 1,079,980 units. Main Event sank 9 cents and ended at $10.80 with 22,370 stocks crossing the exchange, Medical Disposables increased 12 cents to finish at $2 after a transfer of 742 units, Regency Petroleum dipped 20 cents to close at $2.85 as investors exchanged 692,723 stocks. Stationery and Office Supplies climbed 8 cents to $1.58 with 50,545 shares crossing the market and tTech sank 9 cents and ended at $2.30 with investors trading 5,092 stock units.
 Prices of securities trading are those for the last transaction of each stock unless otherwise stated.
 At the close of the market, the JSE Combined Market Index increased 960.27 points to 331,274.49, the All Jamaican Composite Index rallied 1,143.50 points to 365,720.38, the JSE Main Index increased 366.95 points to end trading at 318,587.27, the Junior Market Index gained 84.86 points to close at 3,711.75, and the JSE USD Market Index gained 4.66 points to conclude trading at 252.14.
 The market’s PE ratio, the most popular measure used to value stocks, ended at 13.8 based on projected 2024-25 earnings and 20 based on the 2024-24 historical earnings. The ICInsider.com PE ratio chart and other more detailed daily charts provide investors with regularly updated information to help decision-making. The PE ratio chart covers all ordinary shares on the Jamaica Stock Exchange, grouped by industry, allowing for easy comparisons within a sector and the overall market. The earnings per share (EPS) and PE ratios are based on 2024 and 2024 actual or projected earnings, excluding major time income or expenses.
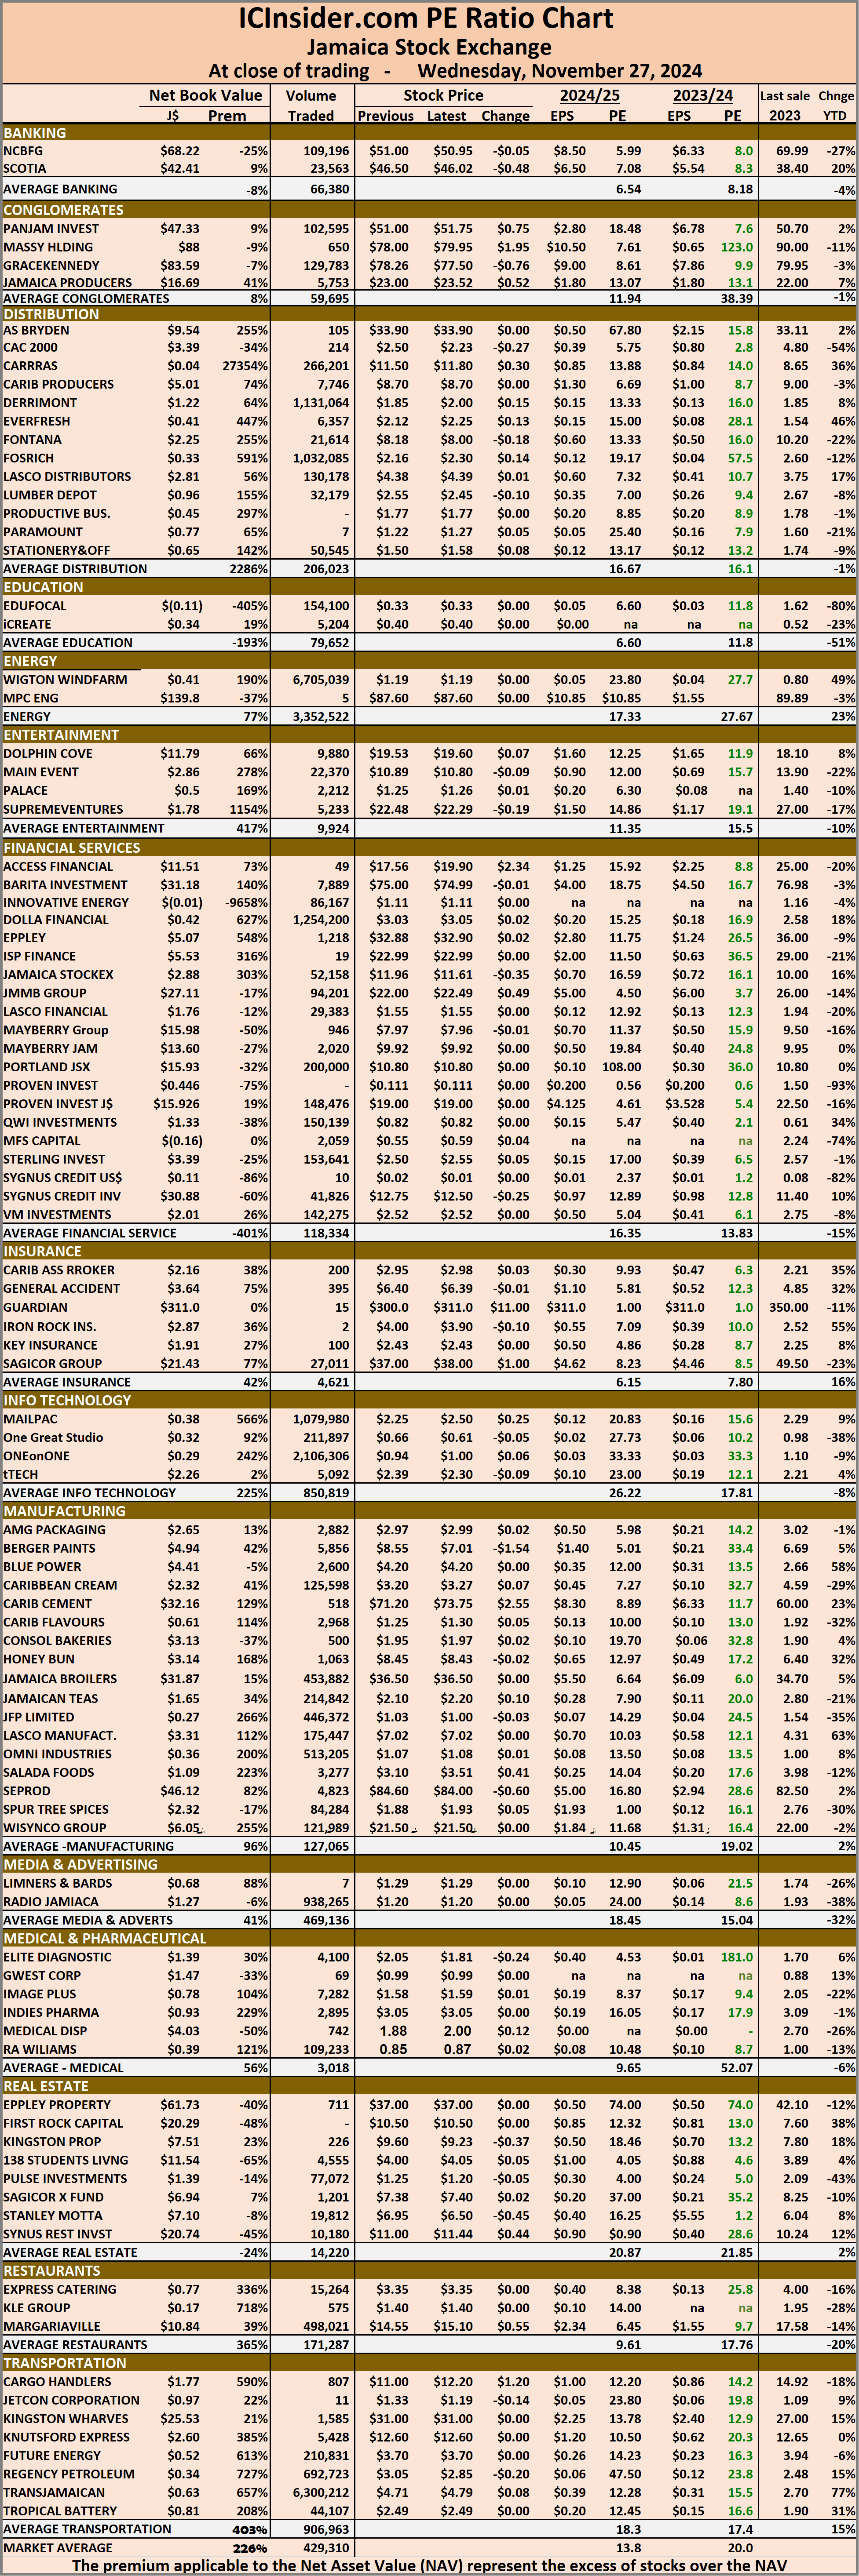 The net asset value of each company is incorporated into the chart. Investors can use this measure in assessing stock values. The chart also shows daily changes in stock prices and the percentage year to date price movement based on the last traded prices. Dividends that are paid or are due to be paid and yields for each company are shown in the Main and Junior Markets’ daily report charts, along with the closing volume of the highest bid and the lowest offer for each company.