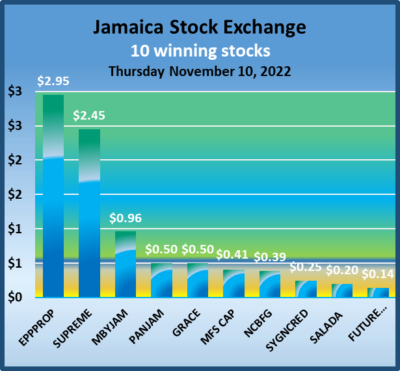
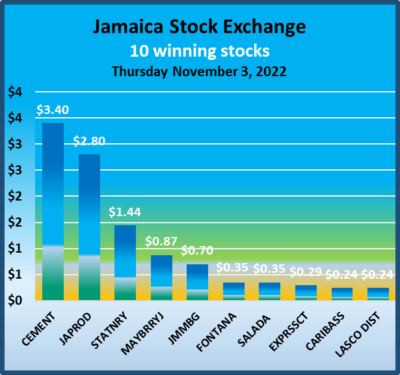
On a day when the major markets of Jamaica Stock Exchange declined, the JSE US dollar market bucked the negative trend to post a moderate rise on Thursday and leading the JSE Combined Market Index to fall 3,957.16 points to close at 358,064.16 after the trading levels increased noticeably over trading on Wednesday.
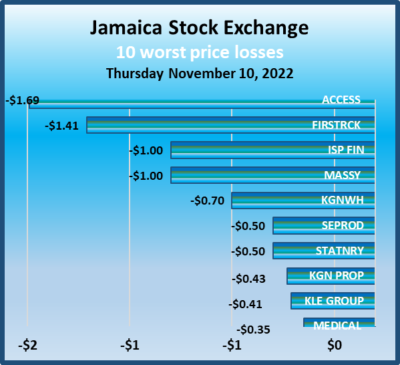 The JSE Main Index fell 3,773.19 points to 343,916.81, the Junior Market Index dropped 47.70 points to close at 4,058.71 points while the All Jamaica Composite Index climbed 2,281.94 points to 392,649.24 and the JSE US dollar market rose 3.50 points to end at 205.27.
Trading ended, with only 19,817,542 shares changing hands, for a mere $113.18 million, versus $35.44 million, with 10,130,062 shares traded in all markets on the previous day. The JSE USD market ended with the value of stocks traded amounting to US$18,378 from US$5,593 on Tuesday.
The market’s PE ratio ended at 23.8 based on 2021-22 earnings and 12.7 times those for 2022-23 at the close of trading.
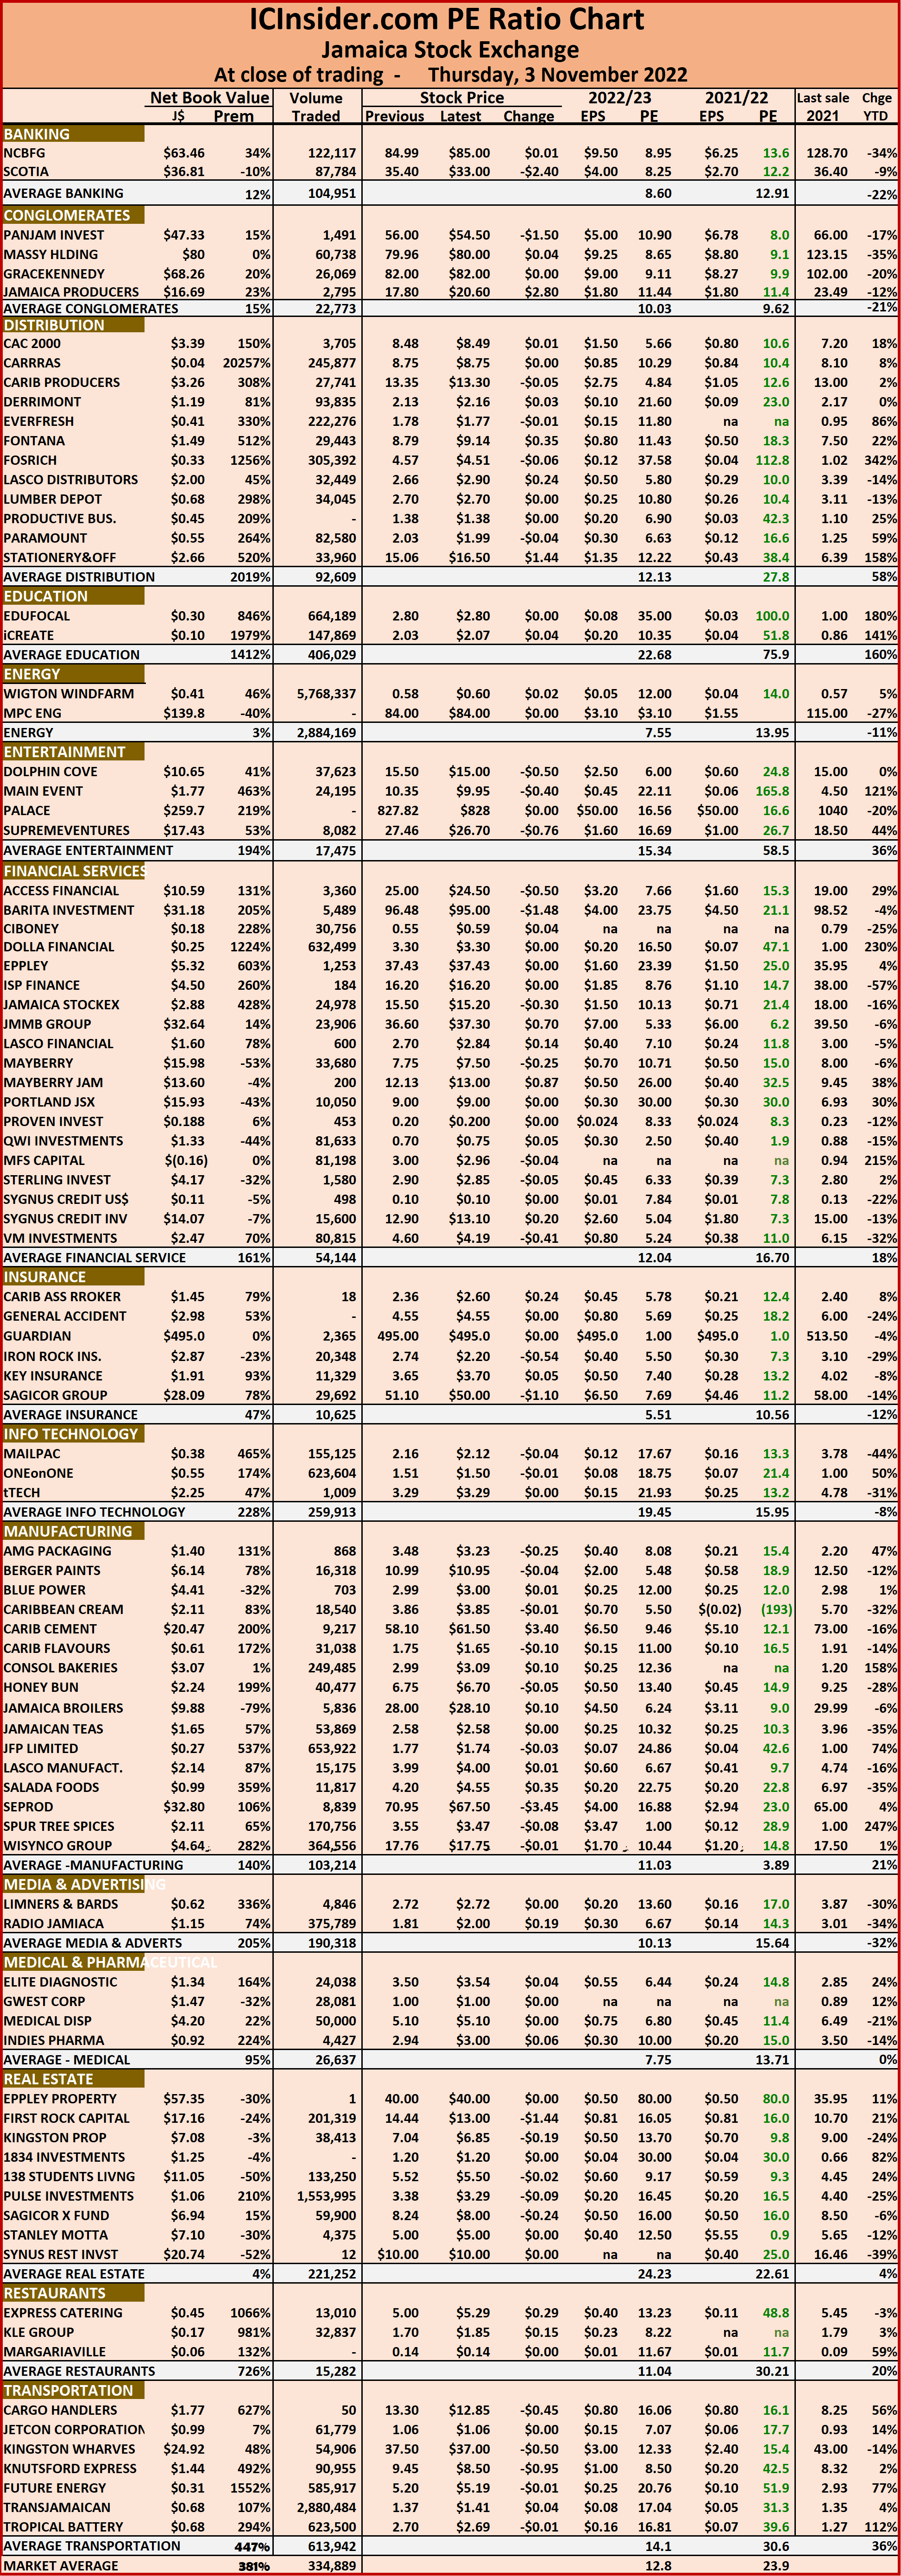
Investors need pertinent information to successfully navigate many investment options in the local stock market. The ICInsider.com PE ratio chart and the more detailed daily report charts provide investors with regularly updated information to help decision-making.
 Investors should use the chart to help make rational investment decisions by investing in stocks close to the average for the sector and not going too far from it unless there are compelling reasons to do so. This approach helps to remove emotions from investment decisions and put in on fundamentals while at the same time not being too far from the majority of investors. Investors who buy when the price of a stock is close to the average will find that they are not inclined to overpay for a stock.
The ICInsider.com PE Ratio chart covers all ordinary shares on the Jamaica Stock Exchange. It shows companies grouped on an industry basis, allowing easy comparisons between the same sector companies and the overall market.
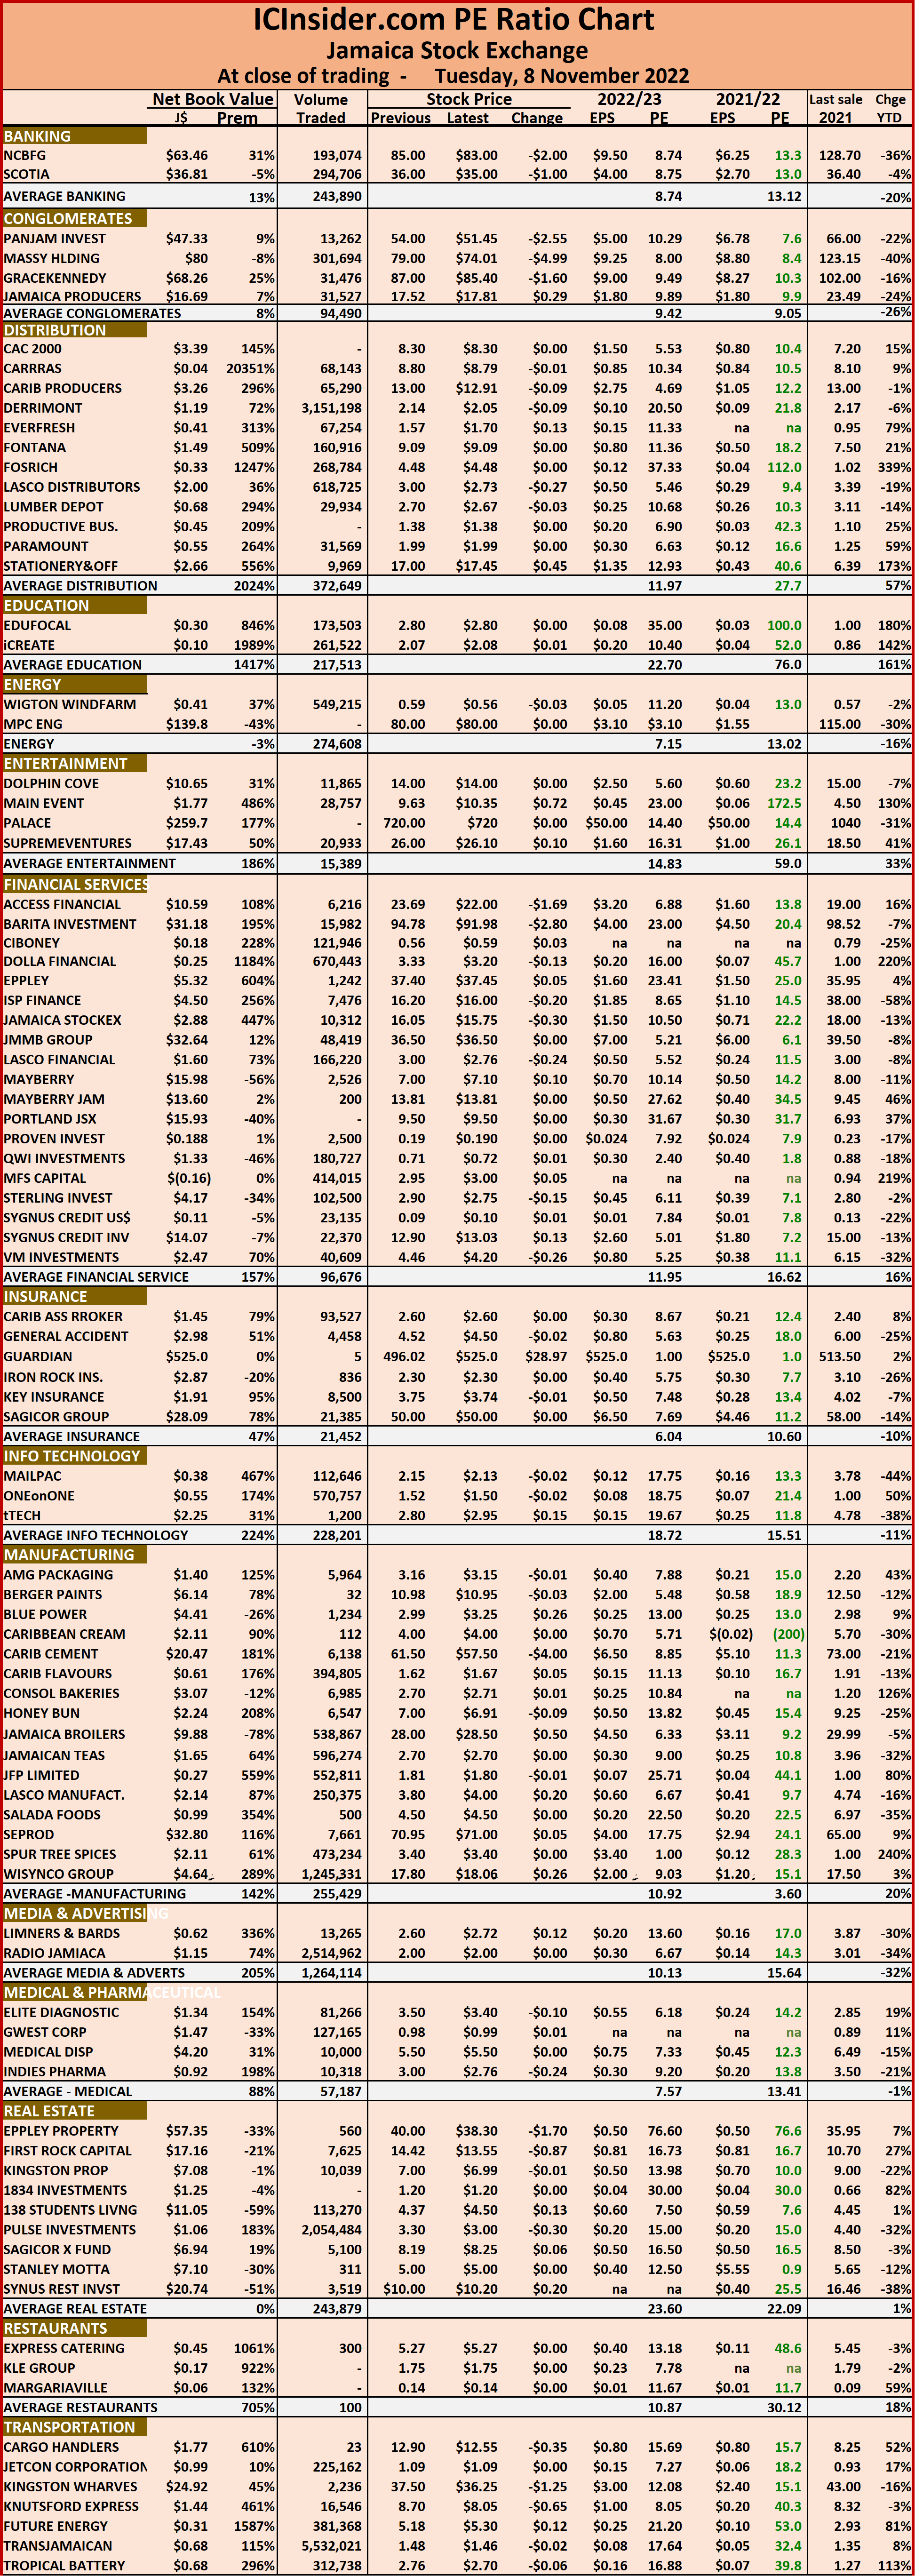 The net asset value of each company is reported as a guide to assess the value of stocks based on this measure quickly. The chart also shows daily changes in stock prices and the percentage year to date price movement based on the last traded prices. Dividends payable and yields for each company are shown in the Main and Junior Markets’ daily report charts that show the closing volume for the bids and offers.
The EPS & PE ratios are based on 2021 and 2022 actual or projected earnings, excluding major one off items. The PE Ratio is the most popular measure used to determine the value of stocks.
JSE markets fall with increased trades
JSE markets rise with subdued trades
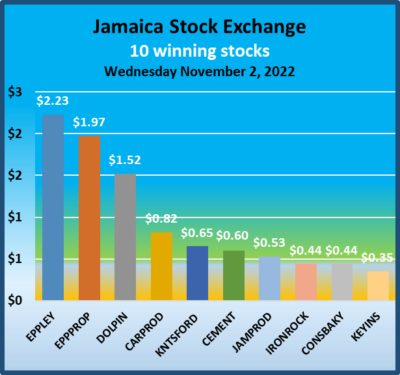
The JSE US dollar market slipped on Wednesday but the Junior Market and the Main Market rose moderately on Wednesday, leading the JSE Combined Market Index rising 1,947.50 points to close at 362,021.32 after trading levels vastly fewer shares than on Tuesday.
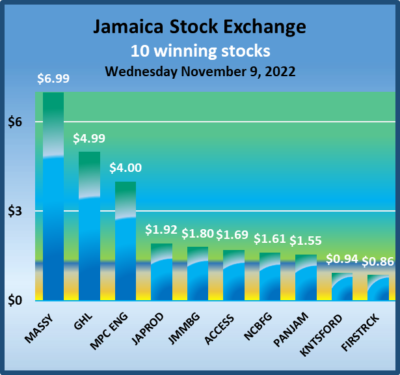 The JSE Main Index fell 1,996.92 points to 347,690.00, the Junior Market Index popped 9.05 points to close at 4,106.41 points while the All Jamaica Composite Index rose 1,893.91 points to 394,931.18 and the JSE US dollar market lost 4.13 points to end at 205.27.
Trading ended, with only 10,130,062 shares changing hands, for a mere $35.44 million, versus $152.3 million, with 26,137,175 shares traded in all markets on the previous day. The JSE USD market ended with the value of stocks traded amounting to US$18,378 from US$5,593 on Tuesday.
The market’s PE ratio ended at 23.9 based on 2021-22 earnings and 12.7 times those for 2022-23 at the close of trading.
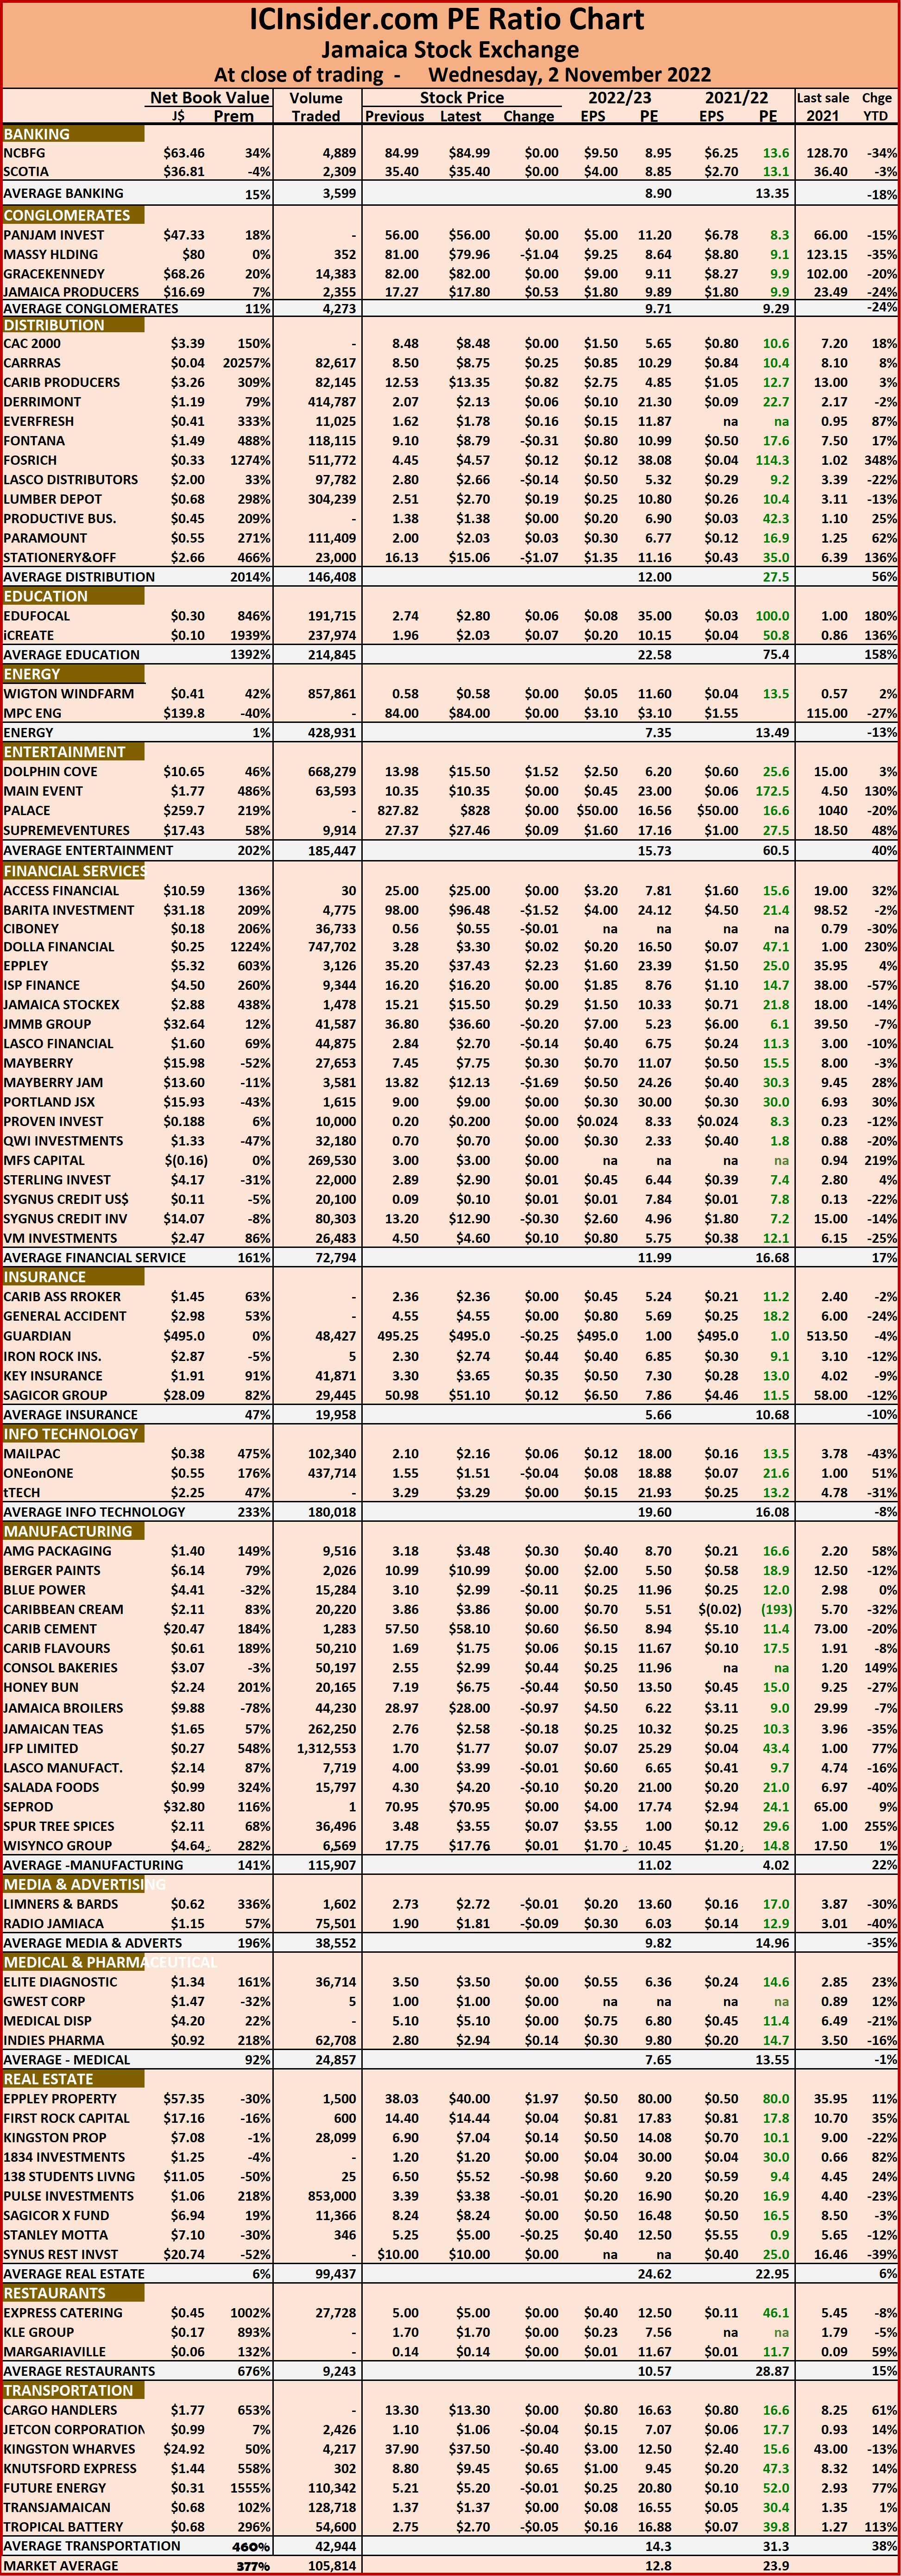
Investors need pertinent information to successfully navigate many investment options in the local stock market. The ICInsider.com PE ratio chart and the more detailed daily report charts provide investors with regularly updated information to help decision-making.
 Investors should use the chart to help make rational investment decisions by investing in stocks close to the average for the sector and not going too far from it unless there are compelling reasons to do so. This approach helps to remove emotions from investment decisions and put in on fundamentals while at the same time not being too far from the majority of investors. Investors who buy when the price of a stock is close to the average will find that they are not inclined to overpay for a stock.
The ICInsider.com PE Ratio chart covers all ordinary shares on the Jamaica Stock Exchange. It shows companies grouped on an industry basis, allowing easy comparisons between the same sector companies and the overall market.
The net asset value of each company is reported as a guide to assess the value of stocks based on this measure quickly. 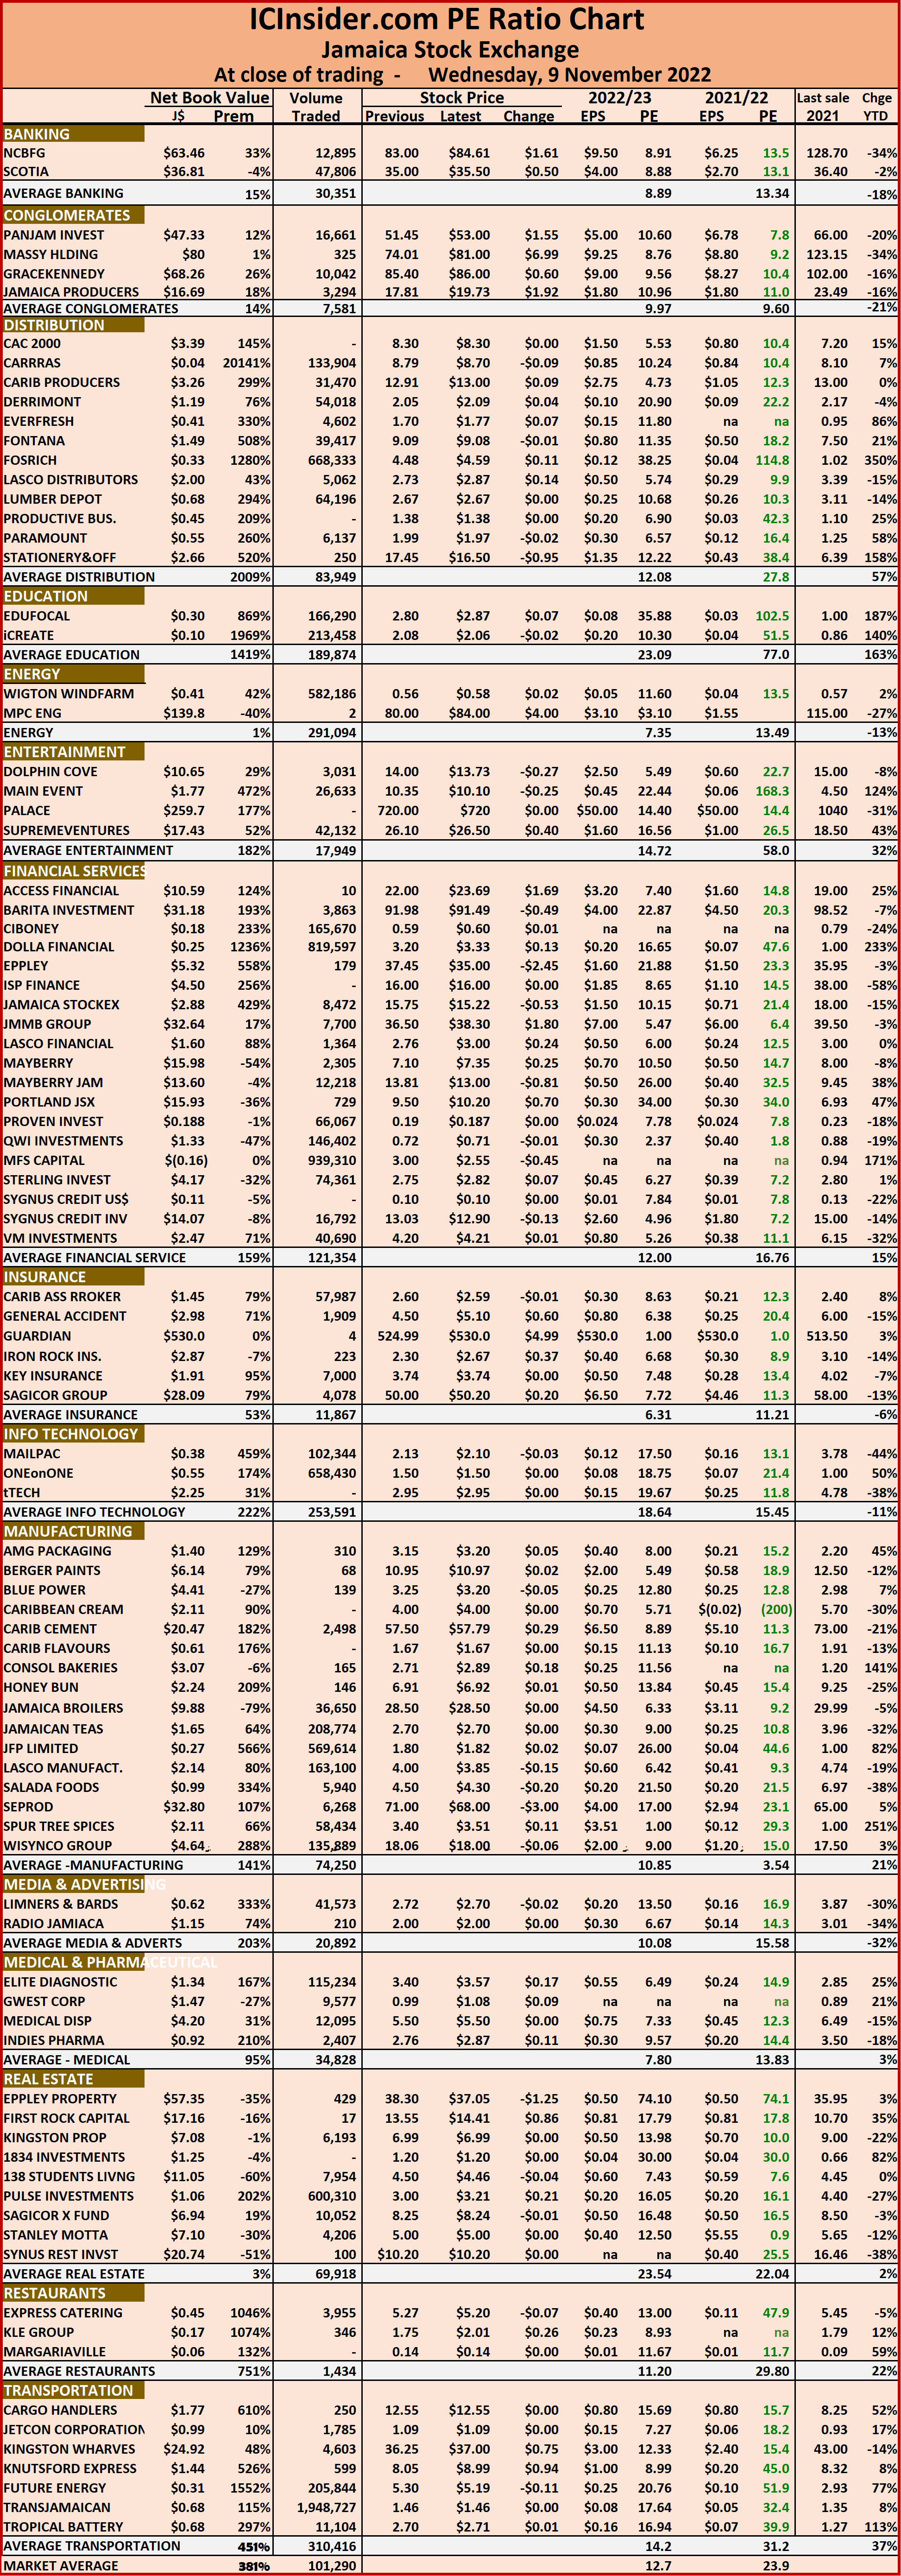 The chart also shows daily changes in stock prices and the percentage year to date price movement based on the last traded prices. Dividends payable and yields for each company are shown in the Main and Junior Markets’ daily report charts that show the closing volume for the bids and offers.
The EPS & PE ratios are based on 2021 and 2022 actual or projected earnings, excluding major one off items. The PE Ratio is the most popular measure used to determine the value of stocks.
Falling stocks hit JSE Main Market
Junior Market rose moderately on Tuesday, following gains on Monday but the Main Market suffered further by adding to Monday’s losses, leading the JSE Combined Market Index to fall 1,214.75 points to close at 360,073.82, with trading picking up over Monday’s outcome.
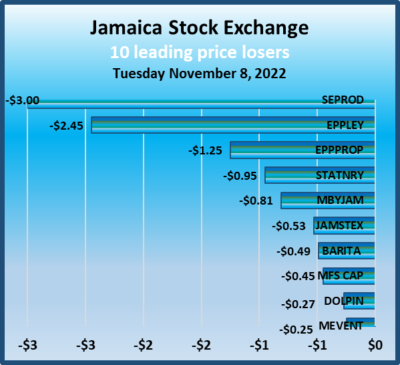
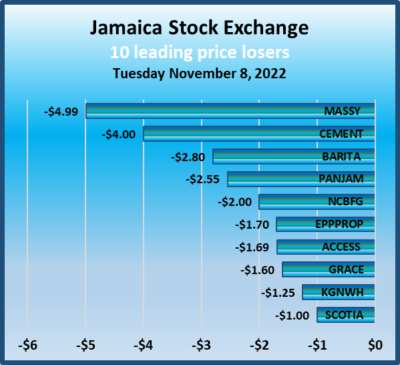
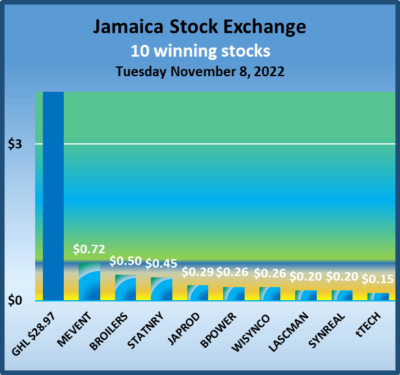 Guardian Holdings jumped $28.97 but was unable to hold off big losses in a series of stocks in the Main Market with nine falling by a dollar or more. The JSE Main Index fell 1,329.63 points to 345,693.08, the Junior Market Index popped 3.02 points to close at 4,097.36 points while the All Jamaica Composite Index lost 3,612.99 points to end at 393,037.27 and the JSE US dollar market lost 1.32 points to end at 209.40.
Trading ended, with 26,137,175 shares changing hands, for $152.3 million, versus $91.7 million, with 23,971,628 shares traded in all markets on the previous day. The JSE USD market ended with the value of stocks traded amounting to US$5,593 from US$29,031 on Monday.
The market’s PE ratio ended at 23.7 based on 2021-22 earnings and 12.6 times those for 2022-23 at the close of trading.
 Investors need pertinent information to successfully navigate many investment options in the local stock market. The ICInsider.com PE ratio chart and the more detailed daily report charts provide investors with regularly updated information to help decision-making.
Investors should use the chart to help make rational investment decisions by investing in stocks close to the average for the sector and not going too far from it unless there are compelling reasons to do so. This approach helps to remove emotions from investment decisions and put in on fundamentals while at the same time not being too far from the majority of investors. Investors who buy when the price of a stock is close to the average will find that they are not inclined to overpay for a stock.
The ICInsider.com PE Ratio chart covers all ordinary shares on the Jamaica Stock Exchange. It shows companies grouped on an industry basis, allowing easy comparisons between the same sector companies and the overall market.
 The net asset value of each company is reported as a guide to assess the value of stocks based on this measure quickly. The chart also shows daily changes in stock prices and the percentage year to date price movement based on the last traded prices. Dividends payable and yields for each company are shown in the Main and Junior Markets’ daily report charts that show the closing volume for the bids and offers.
The EPS & PE ratios are based on 2021 and 2022 actual or projected earnings, excluding major one off items. The PE Ratio is the most popular measure used to determine the value of stocks.
JSE Main Market falls Juniors rise
The Main and US dollar markets of the Jamaica Stock Exchange dropped Monday, but the Junior Market popped modestly higher and the trading ended with the JSE Combined Market Index falling 1,798.84 points to close at 361,288.57 after Guardian Holding gave back Friday’s gains of $22.98.
 The JSE Main Index fell 2,127.45 points to 347,022.71, the Junior Market Index rallied 20.80 points to close at 4,094.34 points while the All Jamaica Composite Index lost 1,302.79 points to 396,650.26 and the JSE US dollar market lost 3.24 points to end at 210.72.
Trading ended, with 23,971,628 shares changing hands, for $91.7 million, versus $116.96 million, with 38,896,157 shares traded in all markets on the previous day. The JSE USD market ended with the value of stocks traded amounting to US$29,031 from US$57,624 on Friday.
The market’s PE ratio ended at 23.7 based on 2021-22 earnings and 12.6 times those for 2022-23 at the close of trading. Investors need pertinent information to successfully navigate many investment options in the local stock market. The ICInsider.com PE ratio chart and the more detailed daily report charts provide investors with regularly updated information to help decision-making.
Investors should use the chart to help make rational investment decisions by investing in stocks close to the average for the sector and not going too far from it unless there are compelling reasons to do so. This approach helps to remove emotions from investment decisions and put in on fundamentals while at the same time not being too far from the majority of investors. Investors who buy when the price of a stock is close to the average will find that they are not inclined to overpay for a stock.
 The ICInsider.com PE Ratio chart covers all ordinary shares on the Jamaica Stock Exchange. It shows companies grouped on an industry basis, allowing easy comparisons between the same sector companies and the overall market.
The net asset value of each company is reported as a guide to assess the value of stocks based on this measure quickly. The chart also shows daily changes in stock prices and the percentage year to date price movement based on the last traded prices. Dividends payable and yields for each company are shown in the Main and Junior Markets’ daily report charts that show the closing volume for the bids and offers.
The EPS & PE ratios are based on 2021 and 2022 actual or projected earnings, excluding major one off items. The PE Ratio is the most popular measure used to determine the value of stocks.
Profit climbs at Lasco Manufacturing
Profit rose 23 percent at Lasco Manufacturing for the three months to September to $469 million from $380 million in 2021 and 13 percent from $782 million in the six months to September 2021 to $883 million in 2022.
 Gross profit margin fell in the first quarter to just 34 percent but rebounded to 37 percent in the second quarter to September this year, similar to what obtained in 2021 and brought the year to date margin to 36 percent compared to 37 percent the previous year, suggesting the company has now restored the margins to 2020 levels.
Revenues rose 22.6 percent in the quarter to $2.87 billion from $2.33 billion in 2021 and up 17.5 percent for the six months to $5.47 billion from $4.66 billion. Gross profit rose 18.4 percent to $1.07 billion in the quarter, from $870 million in 2021 and climbed 15.3 percent to $1.97 billion for the six months compared to $1.71 billion in 2021.
Operating expenses rose 18.5 percent to $378 million in the 2022 September quarter versus $319 million in the comparable quarter in 2021. They increased 10.75 percent to $690 million for the six months to September 2022 versus $623 million last year.
Finance cost fell to $7 million in the September quarter versus $13 million in the three months in 2021 and $15 million to the half year to September versus $29 million in the prior year, with taxation jumping to $210 million in the quarter versus $173 million in 2021 and to $361 million in the half year to September 2022 versus $327 million last year.

Some of Lasco’s products
Cash Flow generated inflows of $1.38 billion to September. Dividend absorbed $413 million and loan repayment $109 million while working capital took up $720 and $436 million went into short term investments and purchase of fixed assets, resulting in net outflows of $312 million.
Shareholders’ equity of $9.9 billion, up from $8.4 billion at the end of 2021. Long term borrowing is down to just $48 million, with the current portion due to be repaid over the next twelve months being $207 million, other current liabilities amount to $1.5 billion, leading to net existing assets of $5.8 billion after taking into account current assets of $7.5 billion that includes cash and equivalent of $2.9 billion.
Earnings per share was 11 cents for the quarter and 21 cents for the half year, with ICInsider.com projecting 60 cents for the entire year, giving it a PE of 6.5 at the stock price of $3.85 it closed at on Friday on the Junior Market of the Jamaica Stock Exchange and earnings of 80 cents per shares for the fiscal year 2024 that could see the stock hitting $15 by then.
According to executive chairman Lascelles Chin, the outlook is that they “remain cautiously optimistic for continued growth in the forthcoming quarters as we have seen an easing of supply chain bottlenecks and material cost inflation seems to have stabilized. With the ongoing geopolitical conflict in Europe, headwinds are, however, possible. Whatever may arise, we will remain focused and proactive in executing our business plan to deliver growth and margin progression.”
Lasco Financial heads Junior Market TOP10
Iron Rock Insurance rose 23 percent for the past week after closing at $2.72. It exited ICInsider.com TOP10 of Junior Market stocks while Lasco Financial climbed back into the top list to be the stock likely to gain the most into the first half of 2023, with 268 percent, at the same time, Key Insurance gained 8 percent to close the week at $3.76, enough to push it from the TOP10 to be replaced by Radio Jamaica that dropped to $1.81 on Friday.
 Following Lasco Financial half year results, with profit up 26 percent in the September quarter, earnings for the full year were raised from 40 cents to 50 cents, with the company resuming growing the loan portfolio. Lasco Manufacturing released six months of results to September that rose 23 percent in the quarter, an improvement over the first quarter and retains earnings previously projected.
The past week ended with the Junior Market moving modestly higher, as it continues to consolidate ahead of a break that is poised to move it sharply higher, with third quarter results to start hitting the market in droves this week and next. The Main Market also closed marginally higher at the week’s end than the previous one.
The Junior Market rise during the week benefitted from three of the top 10 stocks gaining between 5 percent and 23 percent with only one decline of note. The Main Market’s highest loser fell 4 percent, while four stocks gained 4 to 8 percent.
 Other notable price changes during the week include Dolphin Cove, with an increase of 8 percent to $14 and Paramount Trading, up 5 percent to $1.99, while Lasco Manufacturing declined 9 percent to close the week at $3.85 in the Junior Market and in the Main Market, Productive Business Solutions rose 6 percent to $1.38, Guardian Holdings jumped 5 percent to $519 following the release of impressive nine months results and VVM Investments popped 5 percent to $4.80 while Caribbean Producers slipped 4 percent to $13.
At the end of the week, the average PE for the JSE Main Market TOP 10 is 6.2, well below the market average of 13.6. At the same time, the Junior Market Top 10 PE sits at 5.9 versus the market at 12.6, an important indicator of the level of undervaluation of the ICTOP10s tocks. The Junior Market is projected to rise by 243 percent and the Main Market TOP10 by an average of 256 percent by May 2023.
The Junior Market has 14 stocks representing a third of the market, with PEs from 16 to 38, averaging 22 compared with the average of the market. The top half of the market has an average PE of 18.5. This data shows the extent of potential gains that the TOP 10 stocks possess. The situation in the Main Market is similar, with the 15 highest valued stocks priced at a PE of 15 to 80, with an average of 25 and 22 excluding the highest valued one and 21 for the top half excluding the highest valued stock.
 ICTOP10 focuses on likely yearly winners. Accordingly, the list includes some of the best companies in the market but not always. ICInsider.com ranks stocks based on projected earnings, allowing investors to focus on the most undervalued stocks and helping to remove emotions in selecting stocks for investments that often result in costly mistakes.
IC TOP10 stocks are likely to deliver the best returns up to the end of May 2023 and are ranked in order of potential gains, computed using projected earnings for the current fiscal year. Expected values will change as stock prices fluctuate, resulting in weekly movements in and out of the lists. Revisions to earnings are ongoing, based on receipt of new information.
Persons who compiled this report may have an interest in securities commented on in this report.
Q2 profit climbs 26% at Lasco Financial
Profit climbed a respectable 26 percent for the September 2022 quarter to $74 million from $59 million in 2021, for Lasco Financial Services, with the six months’ profits climbing 17 percent to $157 million over the $134 million garnered in 2021.
 The improvement in profit arose from a 12.5 percent rise in income to $623 million for its second quarter to September against income of $554 million in the 2021 second quarter. Importantly, the performance of the September quarter exceeds that for the June quarter, when revenues came in at $564 million with profits of $56 million, suggesting that growth of revenues and profitability could be accelerating quarter over quarter and not only year over year.
For the half year, revenues rose just 3.7 percent to $1.188 billion from $1.145 billion for the six months in 2021.
For the 2022 September, quarter expenses excluding finance costs rose 11 percent to $469 million from $424 million in 2021 as administrative and other expenses climbed 18 percent to $324 million from $275 million in the 2021 September quarter and selling and promotional expenses declined from $150 million in the September 2021 quarter to $145 million in 2022. For the six months, total expenses increased by just 5 percent, from $857 million to $900 million. Administrative expenses increased 7 percent to $592 million from $555 million in 2021, Management reported that the increase is “in line with the expansion of services and growth in staff.” Selling and Promotional expenses rose marginally to $307 million from $302 million for the same period.
Finance costs fell from $46 million to $28 million in the September 2022 quarter and from $93 million for the September 2021 half year to $55 million in 2022. Taxation more than doubled from $25 million to $52 million in the September quarter and increased from $61 million in the six months to September 2021 to $76 million in 2022.
Earnings per share came in at 5.8 cents for the September 2022 quarter and 12.3 cents for the half year. With the December quarter usually generating the largest income and profit, ICInsider.com projects earnings of 50 cents for the year ending March 2023 and 90 cents per share for 2024. The outcome could be even better if the loan portfolio that was nearly $2 billion in 2019 grows back fast enough from the $812 million net of loan losses it fell to in March this year. Based on the earnings per share, the company’s stock trades at a PE of just 5.4 compared to an average of 12.6 for the Junior Market and just three times 2023 earnings, based on the closing price of $2.72 on Friday making the stock a strong buy.

Lasco Financial profit dropped 39% in 2018 Q2.
The company moved to expand its loan portfolio. Management points to a reduction in cash resulting from an “increase in loan disbursements as we make a push to expand our portfolio and market share”, management states in the commentary to shareholders.
Shareholders equity stood at $2.1 billion at the end of September this year, up from $1.84 billion at the end of September 2021, while borrowed funds amount to $1.5 billion, down from $1.64 billion at the end of September last year. Loans and receivables rose to $1.5 billion from $1.4 billion in September last year and cash and cash at bank and short term deposit amount to $1.64 billion versus $1.7 billion in 2021.
During the six months, $278 million in cash was provided from operating activities compared to $376 million in 2021, after $523 million was used in investing and financing activities cash and bank balance fell $244 million and reduced cash and cash equivalent to $722 million from $897 million in 2021.
JSE markets pull back on Thursday
All three markets of the Jamaica Stock Exchange closed lower on Thursday as the market failed to carry on from Wednesday’s mild rally. In the end, the JSE Combined Market Index fell 1,729.65 points to close at 359,170.16.
 The JSE Main Index dropped 1,738.67 points to 344,902.91, the Junior Market Index slipped 11.63 points to close at 4,079.10 points while the All Jamaica Composite Index dropped 2,217.91 points to 394,298.42 and the JSE US dollar market shed 1.19points to 212.57.
Trading ended, with 19,656,102 shares changing hands, for $76.2 million, down from $69.8 million, with 10,651,504 shares traded in all markets on the previous day. The JSE USD market ended with the value of stocks traded amounting to US$29,911 from US$60,952 on Wednesday.
The market’s PE ratio ended at 23.9 based on 2021-22 earnings and 12.8 times those for 2022-23 at the close of trading.
Investors need pertinent information to successfully navigate many investment options in the local stock market. The ICInsider.com PE ratio chart and the more detailed daily report charts provide investors with regularly updated information to help decision-making.
Investors should use the chart to help make rational investment decisions by investing in stocks close to the average for the sector and not going too far from it unless there are compelling reasons to do so. This approach helps to remove emotions from investment decisions and put in on fundamentals while at the same time not being too far from the majority of investors. Investors who buy when the price of a stock is close to the average will find that they are not inclined to overpay for a stock.
The ICInsider.com PE Ratio chart covers all ordinary shares on the Jamaica Stock Exchange. It shows companies grouped on an industry basis, allowing easy comparisons between the same sector companies and the overall market.
 The net asset value of each company is reported as a guide to quickly assess the value of stocks based on this measure. The chart also shows daily changes in stock prices and the percentage year to date price movement based on the last traded prices. Dividends payable and yields for each company are shown in the Main and Junior Markets’ daily report charts that show the closing volume for the bids and offers.
The EPS & PE ratios are based on 2021 and 2022 actual or projected earnings, excluding major one off items. The PE Ratio is the most popular measure used to determine the value of stocks.
JSE stocks stage recovery
All three markets of the Jamaica Stock Exchange rose on Wednesday as stocks staged a modest recovery from Tuesday’s decline, resulting in the JSE Combined Market Index gaining 835.33 points to close at 306,899.81.
 The JSE Main Index popped 596.57 points to 346,641.58, the Junior Market Index gained 30.65 points to close at 4,090.73 while the All Jamaica Composite Index rallied 126.73 points to 396,516.33 and the JSE US dollar market rose 0.85 points to 213.76.
Trading ended, with 10,651,504 shares changing hands, for $69.8 million, down from $85.8 million, with 17,410,768 shares traded in all markets on the previous day. The JSE USD market ended with the value of stocks traded amounting to US$60,952 from US$20,849 on Tuesday.
The market’s PE ratio ended at 23.9 based on 2021-22 earnings and 12.8 times those for 2022-23 at the close of trading.
Investors need pertinent information to successfully navigate many investment options in the local stock market. The ICInsider.com PE ratio chart and the more detailed daily report charts provide investors with regularly updated information to help decision-making.
Investors should use the chart to help make rational investment decisions by investing in stocks close to the average for the sector and not going too far from it unless there are compelling reasons to do so. This approach helps to remove emotions from investment decisions and put in on fundamentals while at the same time not being too far from the majority of investors. Investors who buy when the price of a stock is close to the average will find that they are not inclined to overpay for a stock.
 The ICInsider.com PE Ratio chart covers all ordinary shares on the Jamaica Stock Exchange. It shows companies grouped on an industry basis, allowing easy comparisons between the same sector companies and the overall market.
The net asset value of each company is reported as a guide to assess the value of stocks based on this measure quickly. The chart also shows daily changes in stock prices and the percentage year to date price movement based on the last traded prices. Dividends payable and yields for each company are shown in the Main and Junior Markets’ daily report charts that show the closing volume for the bids and offers.
The EPS & PE ratios are based on 2021 and 2022 actual or projected earnings, excluding major one off items. The PE Ratio is the most popular measure used to determine the value of stocks.
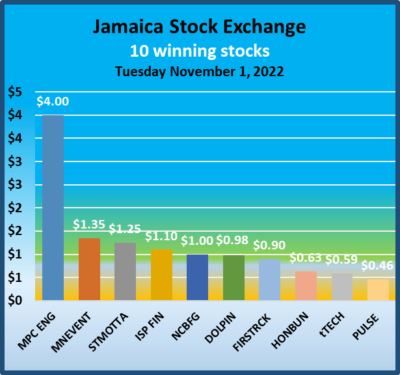
JSE stocks slip into November
Main Market stocks declined to start off November but the Junior Market and the Jamaica JSE US Market rose to start the new month on a positive note at the close, with the JSE Combined Market Index falling 1,424.21 to close at 360,064.48.
 The JSE Main Index declined 1,605.97 points to 346,045.01 the Junior Market Index closed at 4,060.08 points after putting on 8.37 points while the All Jamaica Composite Index fell 818.79 points to 396,389.60 and the JSE US dollar market rose 1.17 points to 212.91.
Trading ended, with 17,410,768 shares changing hands, for $85.8 million, down from $157.7 million, with 68,325,229 shares traded in all markets on the previous day. The JSE USD market ended as investors expended US$20,849 from US$25,574 on Monday.
The market’s PE ratio ended at 23.7 based on 2021-22 earnings and 12.7 times those for 2022-23 at the close of trading.
Investors need pertinent information to successfully navigate many investment options in the local stock market. The ICInsider.com PE ratio chart and the more detailed daily report charts provide investors with regularly updated information to help decision-making.
Investors should use the chart to help make rational investment decisions by investing in stocks close to the average for the sector and not going too far from it unless there are compelling reasons to do so. This approach helps to remove emotions from investment decisions and put in on fundamentals while at the same time not being too far from the majority of investors. Investors who buy when the price of a stock is close to the average will find that they are not inclined to overpay for a stock.
The ICInsider.com PE Ratio chart covers all ordinary shares on the Jamaica Stock Exchange. It shows companies grouped on an industry basis, allowing easy comparisons between the same sector companies and the overall market.
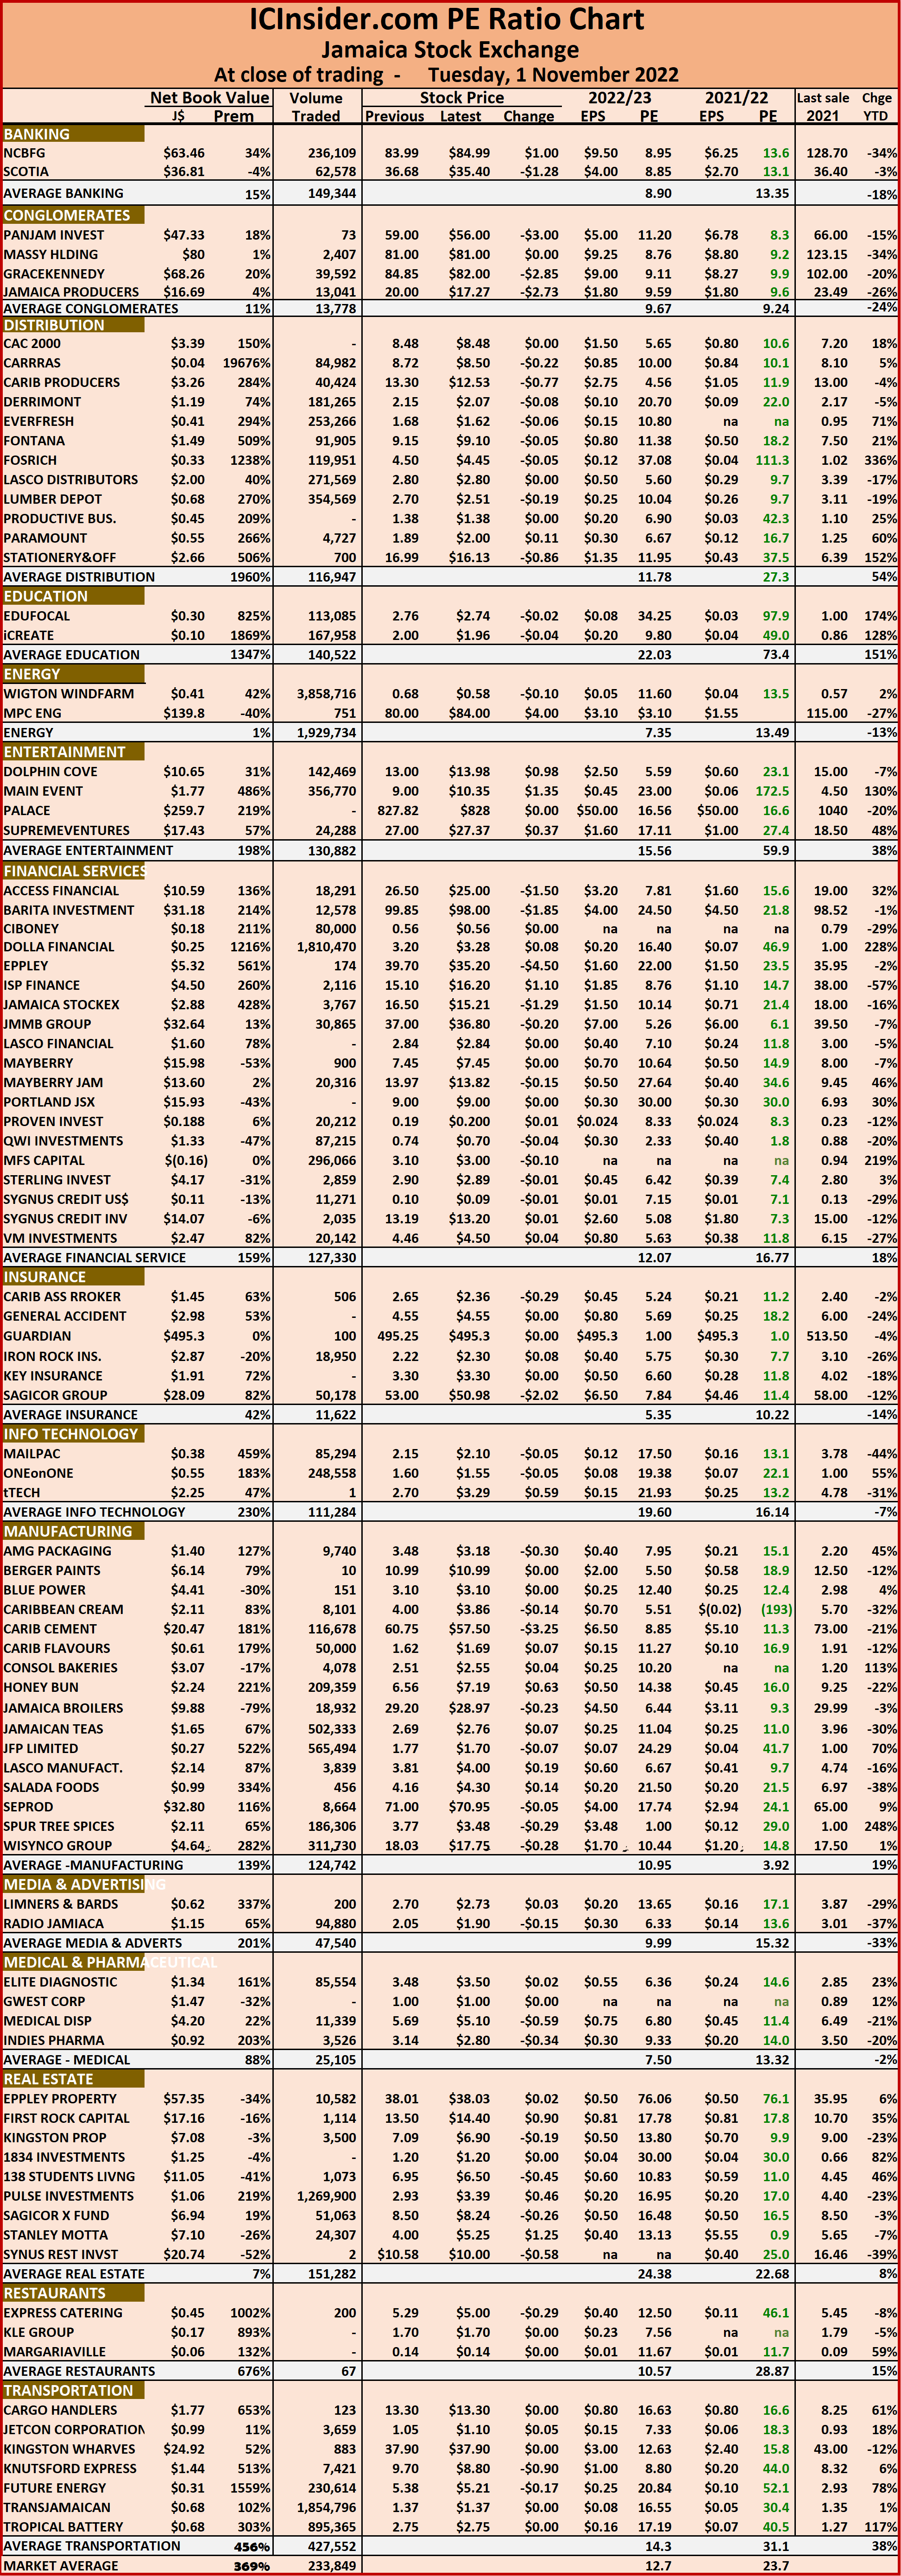 The net asset value of each company is reported as a guide to assess the value of stocks based on this measure quickly. The chart also shows daily changes in stock prices and the percentage year to date price movement based on the last traded prices. Dividends payable and yields for each company are shown in the Main and Junior Markets’ daily report charts that show the closing volume for the bids and offers.
The EPS & PE ratios are based on 2021 and 2022 actual or projected earnings, excluding major one off items. The PE Ratio is the most popular measure used to determine the value of stocks.


