The Main and US dollar markets of the Jamaica Stock Exchange dropped Monday, but the Junior Market popped modestly higher and the trading ended with the JSE Combined Market Index falling 1,798.84 points to close at 361,288.57 after Guardian Holding gave back Friday’s gains of $22.98.
 The JSE Main Index fell 2,127.45 points to 347,022.71, the Junior Market Index rallied 20.80 points to close at 4,094.34 points while the All Jamaica Composite Index lost 1,302.79 points to 396,650.26 and the JSE US dollar market lost 3.24 points to end at 210.72.
Trading ended, with 23,971,628 shares changing hands, for $91.7 million, versus $116.96 million, with 38,896,157 shares traded in all markets on the previous day. The JSE USD market ended with the value of stocks traded amounting to US$29,031 from US$57,624 on Friday.
The market’s PE ratio ended at 23.7 based on 2021-22 earnings and 12.6 times those for 2022-23 at the close of trading. Investors need pertinent information to successfully navigate many investment options in the local stock market. The ICInsider.com PE ratio chart and the more detailed daily report charts provide investors with regularly updated information to help decision-making.
Investors should use the chart to help make rational investment decisions by investing in stocks close to the average for the sector and not going too far from it unless there are compelling reasons to do so. This approach helps to remove emotions from investment decisions and put in on fundamentals while at the same time not being too far from the majority of investors. Investors who buy when the price of a stock is close to the average will find that they are not inclined to overpay for a stock.
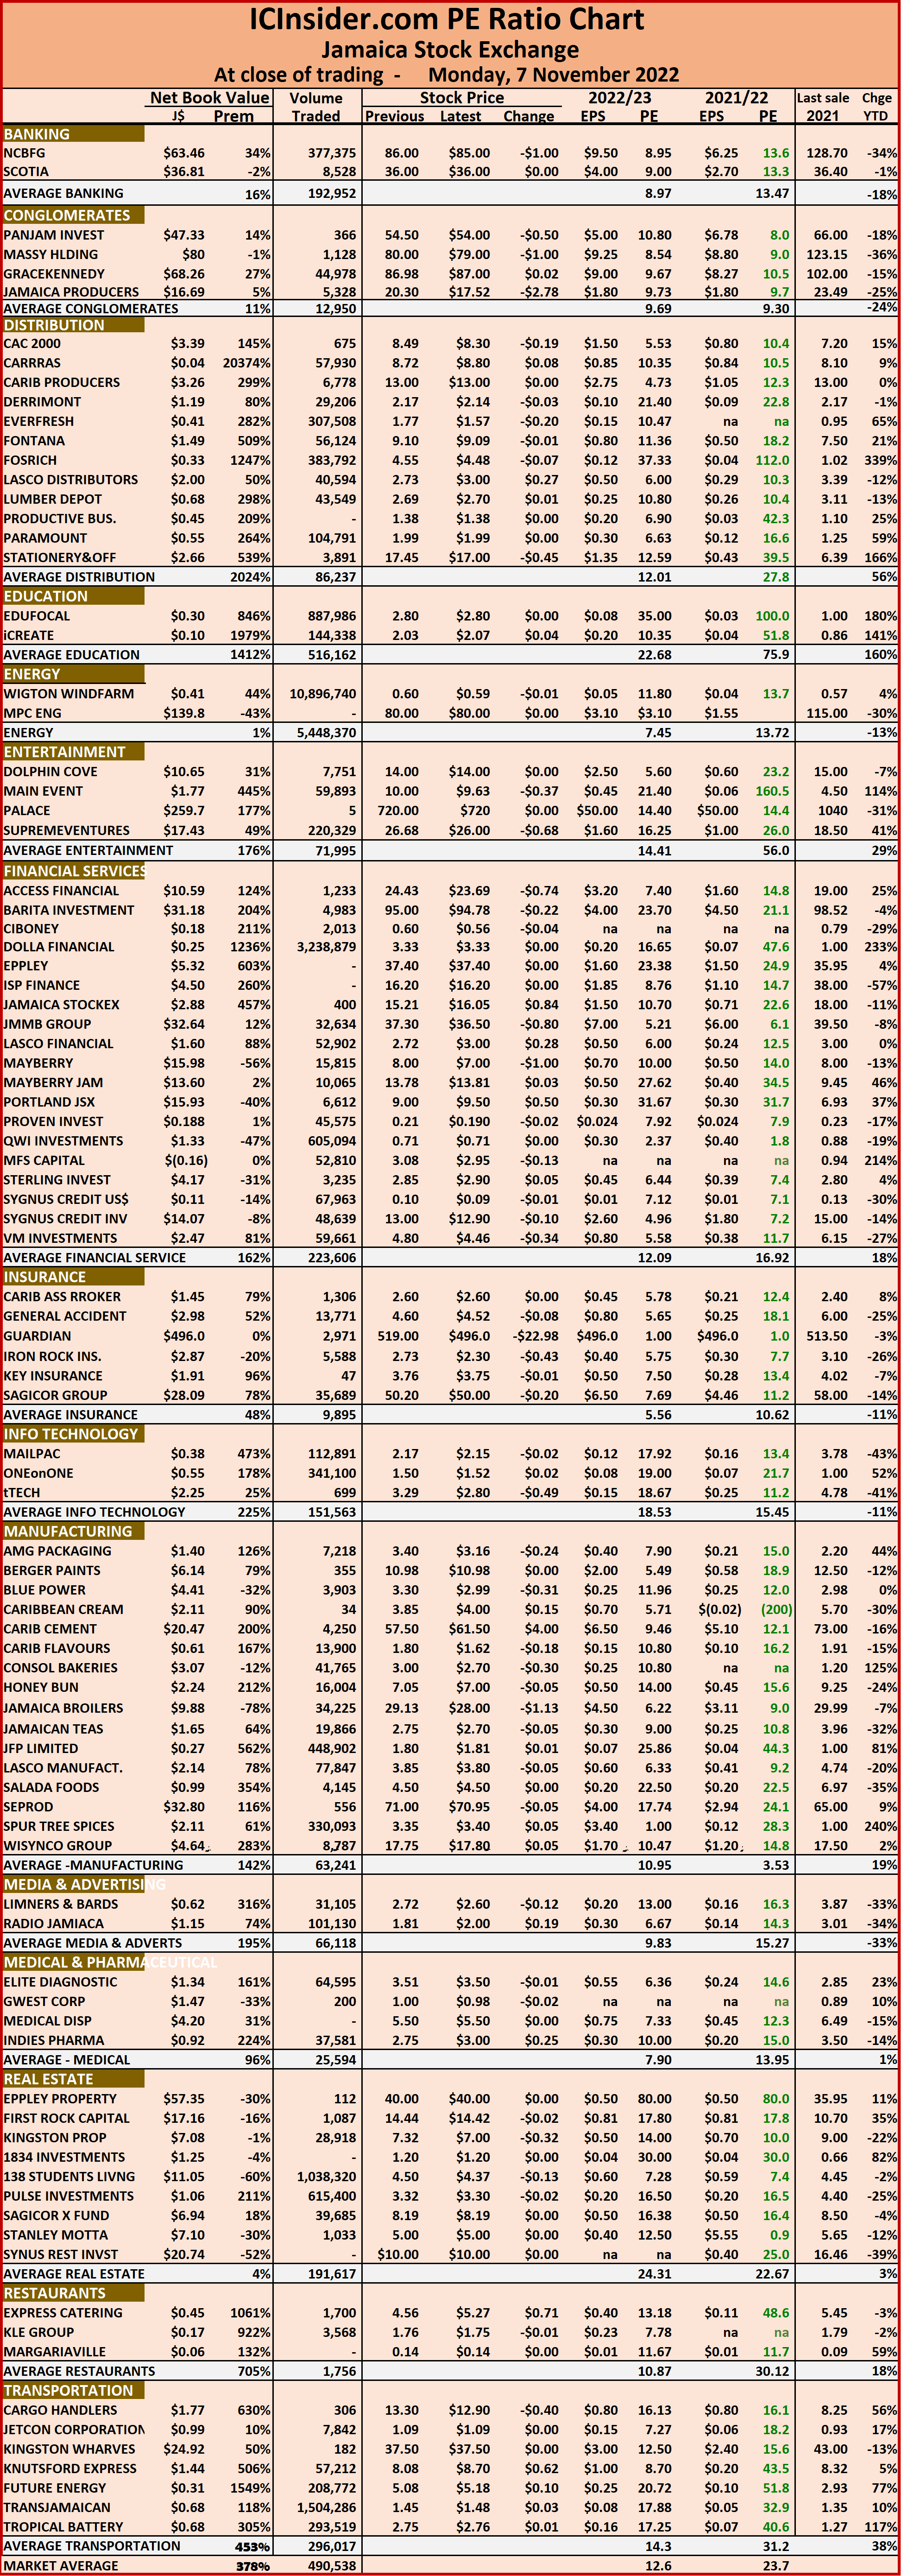 The ICInsider.com PE Ratio chart covers all ordinary shares on the Jamaica Stock Exchange. It shows companies grouped on an industry basis, allowing easy comparisons between the same sector companies and the overall market.
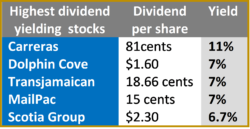
The net asset value of each company is reported as a guide to assess the value of stocks based on this measure quickly. The chart also shows daily changes in stock prices and the percentage year to date price movement based on the last traded prices. Dividends payable and yields for each company are shown in the Main and Junior Markets’ daily report charts that show the closing volume for the bids and offers.
The EPS & PE ratios are based on 2021 and 2022 actual or projected earnings, excluding major one off items. The PE Ratio is the most popular measure used to determine the value of stocks.
JSE Main Market falls Juniors rise
JSE main market lost ground again – Monday

NCB lost ground following the lapsing of the offer to acquire majority shares in Guardian Holdings.
The Main Market of the Jamaica Stock Exchange closed down on for the second time in two days on Monday, with JSE All Jamaican Composite Index dropping 296.85 points to 318,961.81 and the JSE Index falling 270.46 points to 290,610.27.
Trading on Monday closed 28 securities changing hands with 8 advancing, 14 declining and 6 trading firm in the main and US dollar markets.
The securities with the largest price changes include, Caribbean Cement with a gain of $1.45 to $33 and NCB Financial that traded with a loss of $1.02 to end at $98.97 after the acquisition deal to buy up to 62 percent of Guardian Holding was cancelled due to investigations into the deal being carried out by the securities commission of Trinidad.
Main market activity ended with 9,756,068 units valued at over $152,399,537 compared to 4,322,228 units valued at $69,892,327 on Monday. Sagicor Group accounted for 19.6 percent of shares traded with 1,912,055 units, followed by Jamaica Producers 17.9 percent with 1,748,275 units and Ciboney Group with 12.3 percent and ending trading with 1,199,900 shares.
 Trading results in an average of 348,431 shares valued at $5,442,841 for each security traded, in contrast to 160,083 shares valued at $2,588,605 on Friday. The average volume and value for the month to date amounts to 213,111 units valued at $3,322,294 and previously, 204,802 units valued at $3,183,567. In contrast, January closed with average of 349,084 units at an average of $5,801,440 for each security traded.
IC bid-offer Indicator| At the end of trading, the Investor’s Choice bid-offer indicator reading shows 7 stocks ended with bids higher than their last selling prices and 4 with lower offers.
There was no trading in the US dollar market.
For more details of market activities see – JSE trading jumps higher on Monday.