The Junior Market and the USD Market rose in trading on Friday but the Main Market of the Jamaica Stock Exchange declined moderately, resulting in the JSE Combined Index, a measure of the overall market, falling 143.83 points to close at 369,477.68.
 The All Jamaican Composite Index dropped 500.21 points to 406 374.06, the JSE Main Index fell 358.44 points to 355,737.49, the Junior Market Index shed 21.06 points to 4,099.20 and the JSE USD market Index popped 0.39 points to close at 212.41.
Trading ended, with 21,014,171 shares changing hands, at $114.5 million, up from $107.9 million, with 24,727,814 shares traded in all markets on the previous day. The JSE USD market ended with the value of stocks traded at US$5,262 from US$18,682 on Thursday.
The market’s PE ratio ended at 23.5 based on 2021-22 earnings and 12.6 times those for 2022-23 at the close of trading.
Investors need pertinent information to successfully navigate many investment options in the local stock market. The ICInsider.com PE ratio chart and the more detailed daily report charts provide investors with regularly updated information to help decision-making.
 Investors should use the chart to help make rational investment decisions by investing in stocks close to the average for the sector and not going too far from it unless there are compelling reasons to do so. This approach helps to remove emotions from investment decisions and put in on fundamentals while at the same time not being too far from the majority of investors. Investors who buy when the price of a stock is close to the average will find that they are not inclined to overpay for a stock.
The ICInsider.com PE Ratio chart covers all ordinary shares on the Jamaica Stock Exchange. It shows companies grouped on an industry basis, allowing easy comparisons between the same sector companies and the overall market.
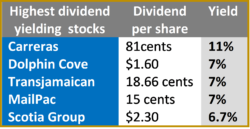
The net asset value of each company is reported as a guide to assess the value of stocks based on this measure quickly. The chart also shows daily changes in stock prices and the percentage year to date price movement based on the last traded prices. 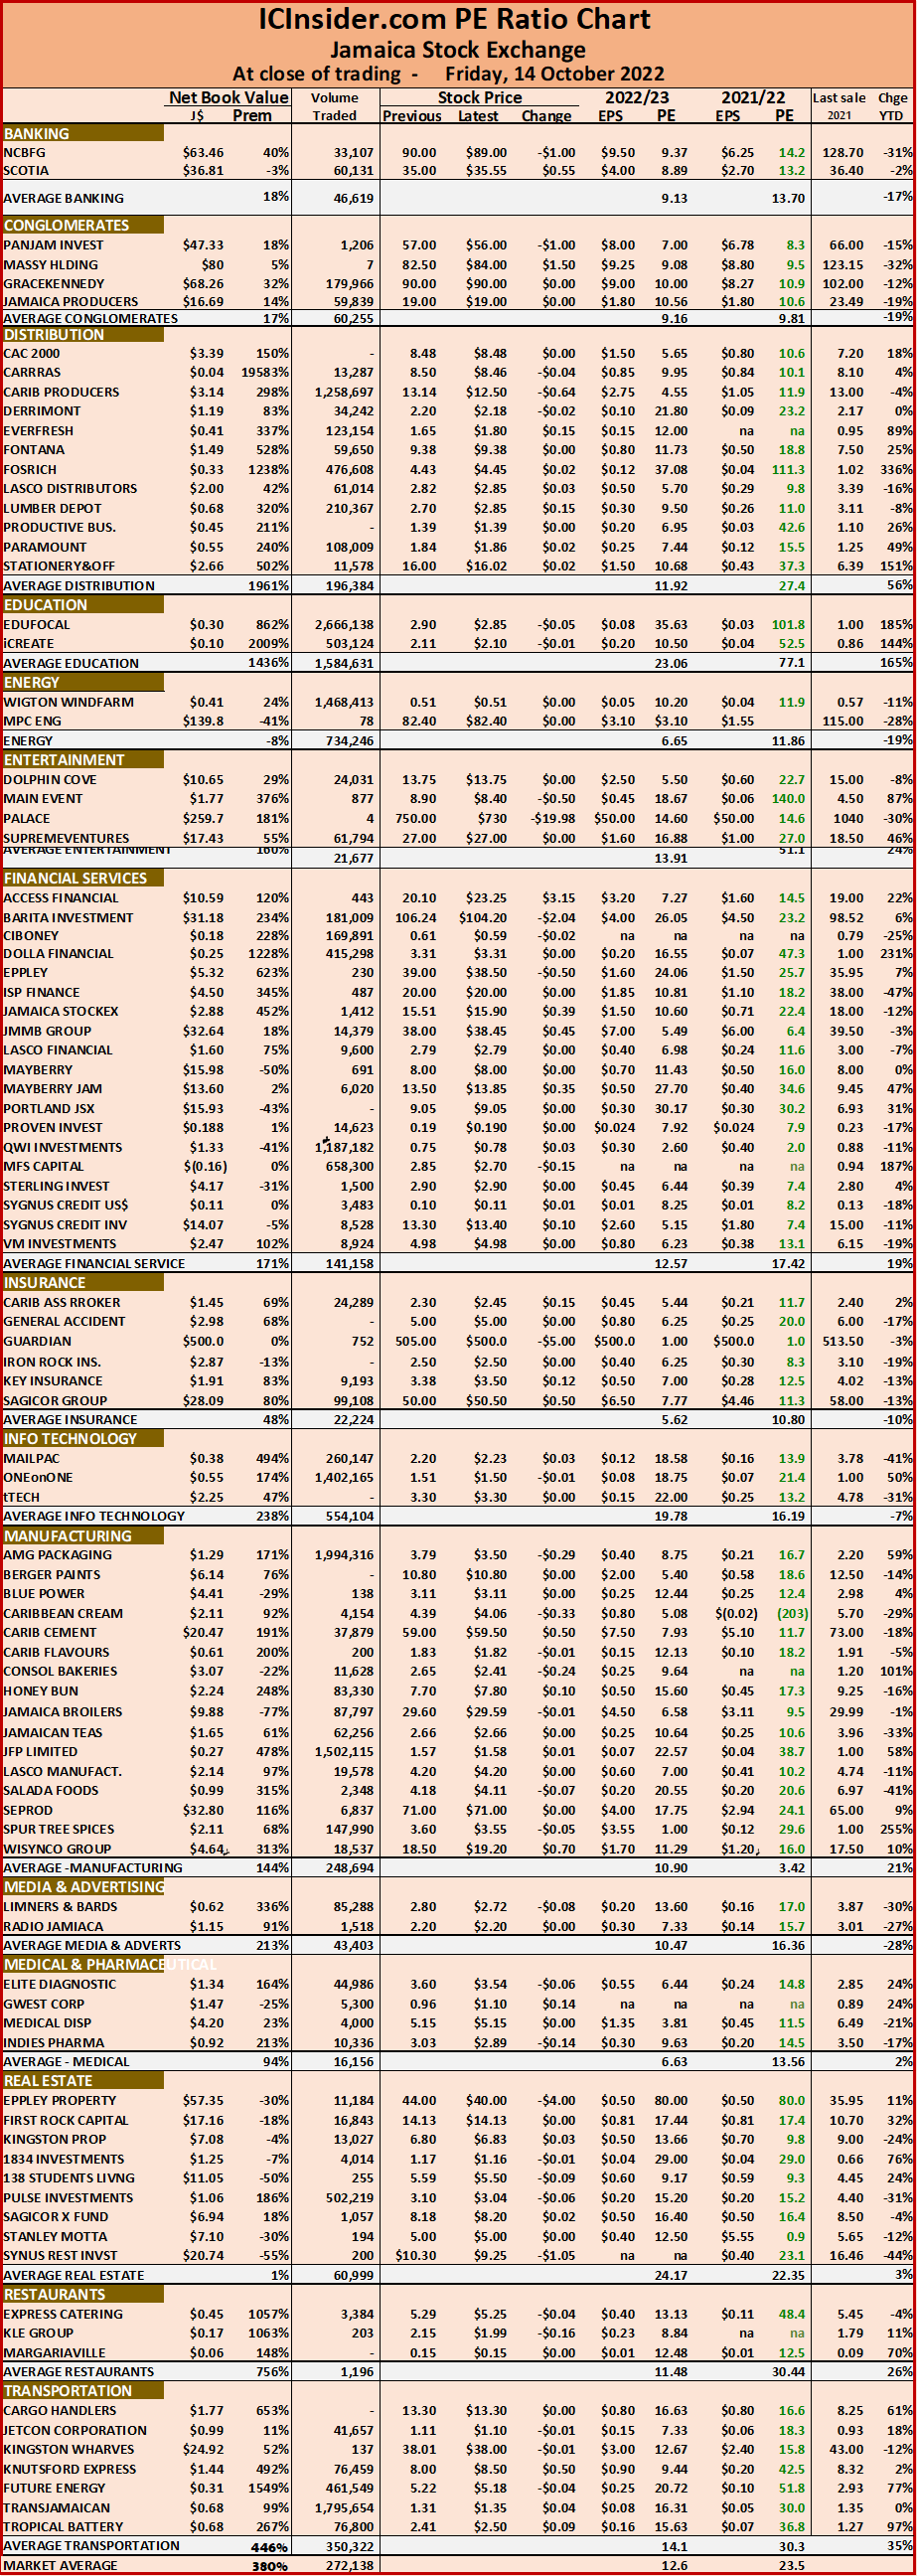 Dividends payable and yields for each company are shown in the Main and Junior Markets’ daily report charts that show the closing volume for the bids and offers.
The EPS & PE ratios are based on 2021 and 2022 actual or projected earnings, excluding major one off items. The PE Ratio is the most popular measure used to determine the value of stocks.
 The All Jamaican Composite Index dropped 1,662.75 points to 406 874.27, the JSE Main Index fell 1,570.82 points to 356,095.93, the Junior Market Index shed 38.20 points to 4,078.14 and the JSE USD market Index slipped 3.15 points to close at 212.02.
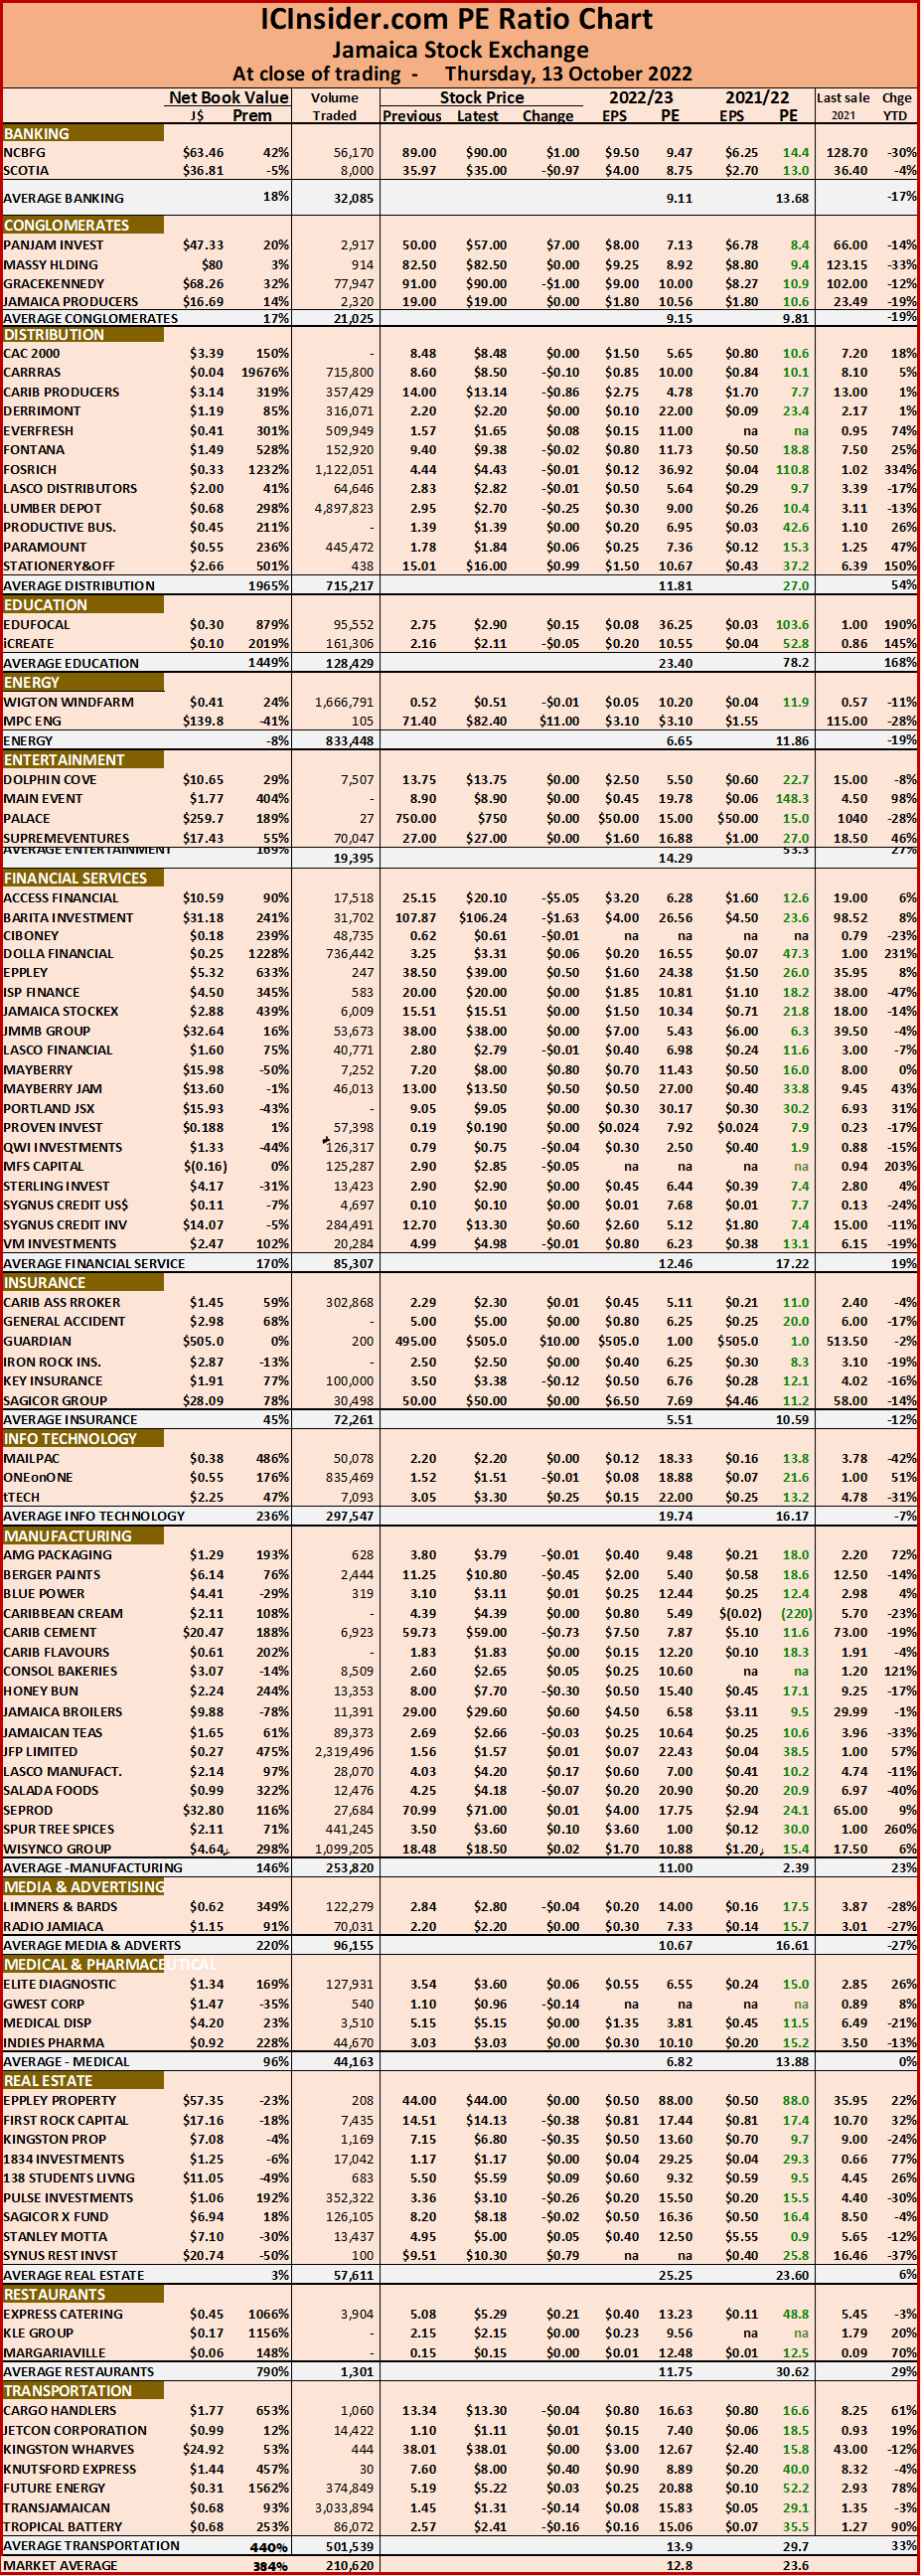 The net asset value of each company is reported as a guide to assess the value of stocks based on this measure quickly. The chart also shows daily changes in stock prices and the percentage year to date price movement based on the last traded prices. Dividends payable and yields for each company are shown in the Main and Junior Markets’ daily report charts that show the closing volume for the bids and offers.
 The All Jamaican Composite Index dropped points to 408,537.02, the JSE Main Index fell 1,835.87 points to 357,666.75, the Junior Market Index shed 25.60 points to 4,116.34 and the JSE USD market Index slipped 1.87 points to close at 215.17.
 The net asset value of each company is reported as a guide to assess the value of stocks based on this measure quickly. The chart also shows daily changes in stock prices and the percentage year to date price movement based on the last traded prices. Dividends payable and yields for each company are shown in the Main and Junior Markets’ daily report charts that show the closing volume for the bids and offers.
 The All Jamaican Composite Index popped 436.67 points to 410,175.31, the JSE Main Index rose 293.25 points to 359,209.37, the Junior Market Index shed 15.18 points to 4,141.94 and the JSE USD market Index slipped 0.87 points to close at 217.04.
 This approach helps to remove emotions from investment decisions and put in on fundamentals while at the same time not being too far from the majority of investors. Investors who buy when the price of a stock is close to the average will find that they are not inclined to overpay for a stock.
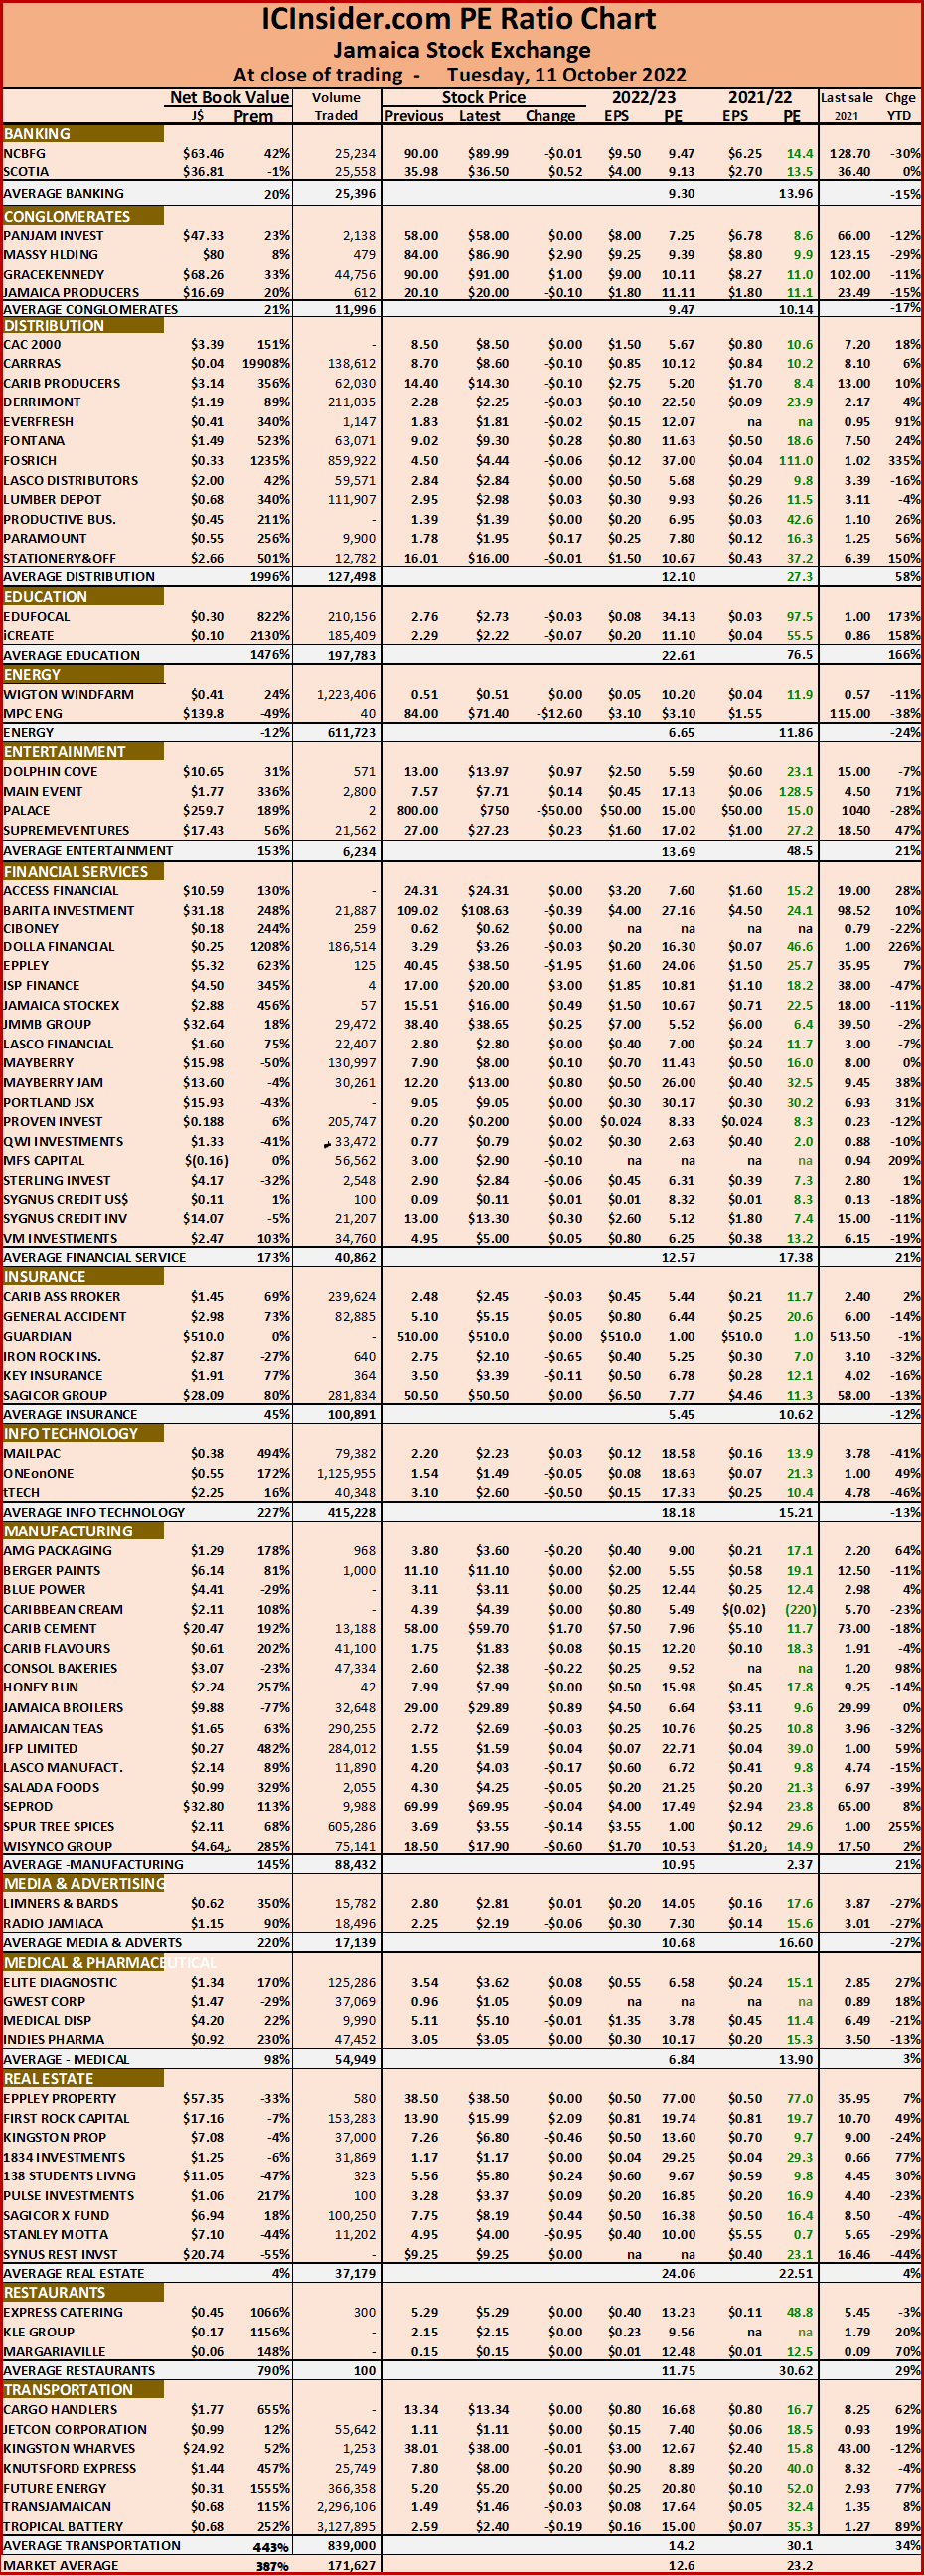 Dividends payable and yields for each company are shown in the Main and Junior Markets’ daily report charts that show the closing volume for the bids and offers.
 The All Jamaican Composite Index popped 529.05 points to 409,683.84, the JSE Main Index climbed 449.27 points to 359,209.37, the Junior Market Index shed 18.77 points to 4,1 57.12 and the JSE USD market Index slipped 4.59 points to close at 217.91
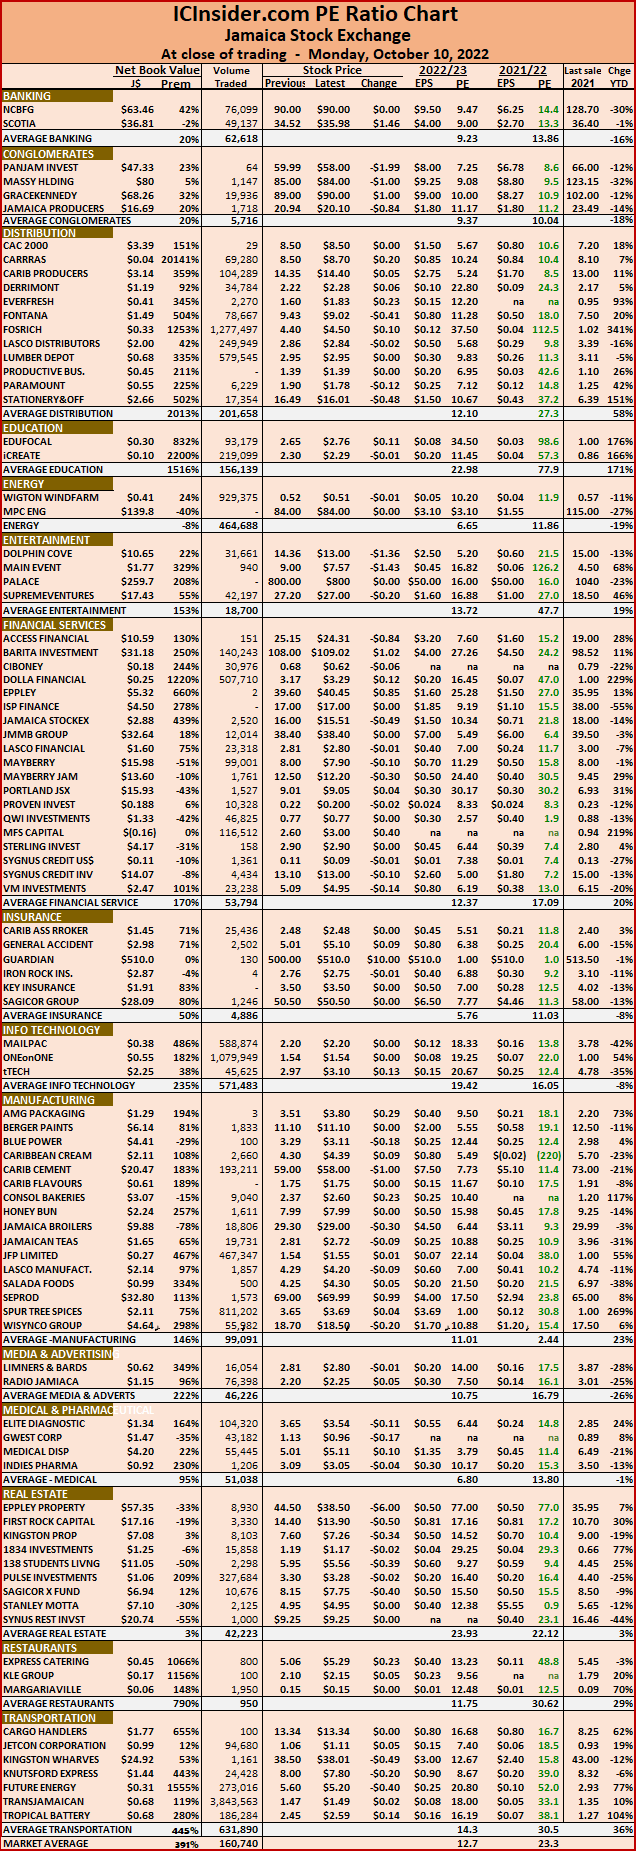 The net asset value of each company is reported as a guide to assess the value of stocks based on this measure quickly. The chart also shows daily changes in stock prices and the percentage year to date price movement based on the last traded prices. Dividends payable and yields for each company are shown in the Main and Junior Markets’ daily report charts that show the closing volume for the bids and offers.
 Lasco Manufacturing and Jetcon Corporation return to the ICTOP10.
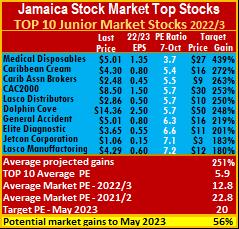 The Junior Market is projected to rise by 246 percent and the Main Market TOP10 is projected to gain an average of 235 percent, to May 2023.
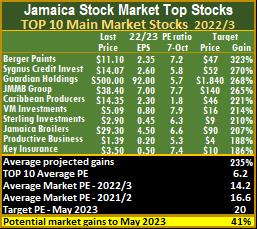 ICTOP10 focuses on likely yearly winners, accordingly, the list includes some of the best companies in the market but not always. ICInsider.com ranks stocks based on projected earnings, allowing investors to focus on the most undervalued stocks and helping to remove emotions in selecting stocks for investments that often result in costly mistakes.
 Trading ended, with 26,446,637 shares changing hands, at $118.2 million, up from $149.7 million, with 21,520,578 shares traded in all markets on the previous day. The JSE USD market ended with the value of stocks traded at US$26,409 from US$8,280 on Thursday.
 The net asset value of each company is reported as a guide to assess the value of stocks based on this measure quickly. The chart also shows daily changes in stock prices and the percentage year to date price movement based on the last traded prices. Dividends payable and yields for each company are shown in the Main and Junior Markets’ daily report charts that show the closing volume for the bids and offers.
 The All Jamaican Composite Index popped 3,348.14, points to 408,553.26 and the JSE Main Index jumped 2,003.26 points to 357,015.40.
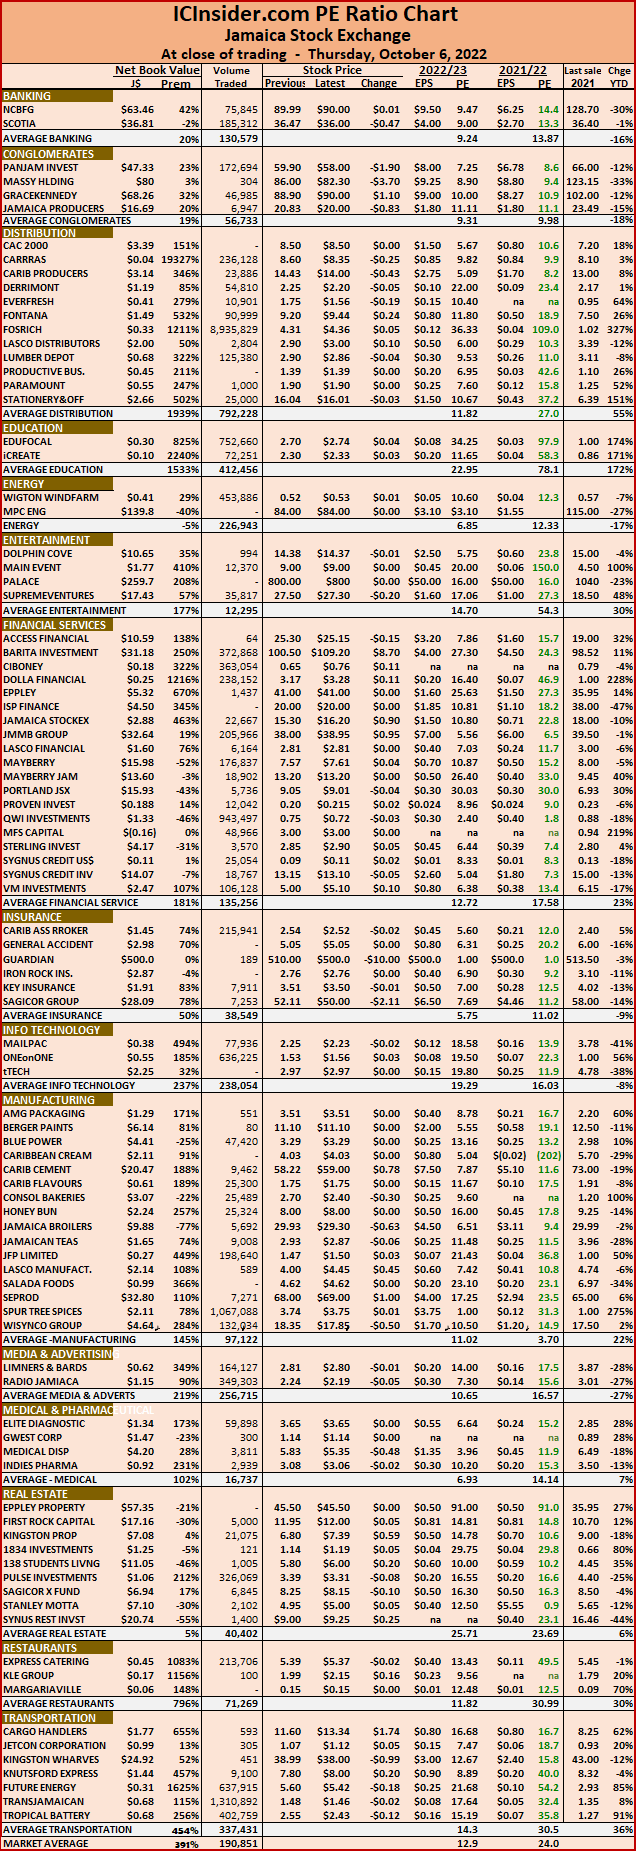 The net asset value of each company is reported as a guide to assess the value of stocks based on this measure quickly. The chart also shows daily changes in stock prices and the percentage year to date price movement based on the last traded prices. Dividends payable and yields for each company are shown in the Main and Junior Markets’ daily report charts that show the closing volume for the bids and offers.
 The All Jamaican Composite Index dropped 4,899.45 points to 405,205.12, the JSE Main Index fell 4,260.42 points to 355,012.14, the Junior Market Index shed 22.10 points to 4,126.19 and the JSE USD Market Index slipped 0.45 points to close 216.84.
 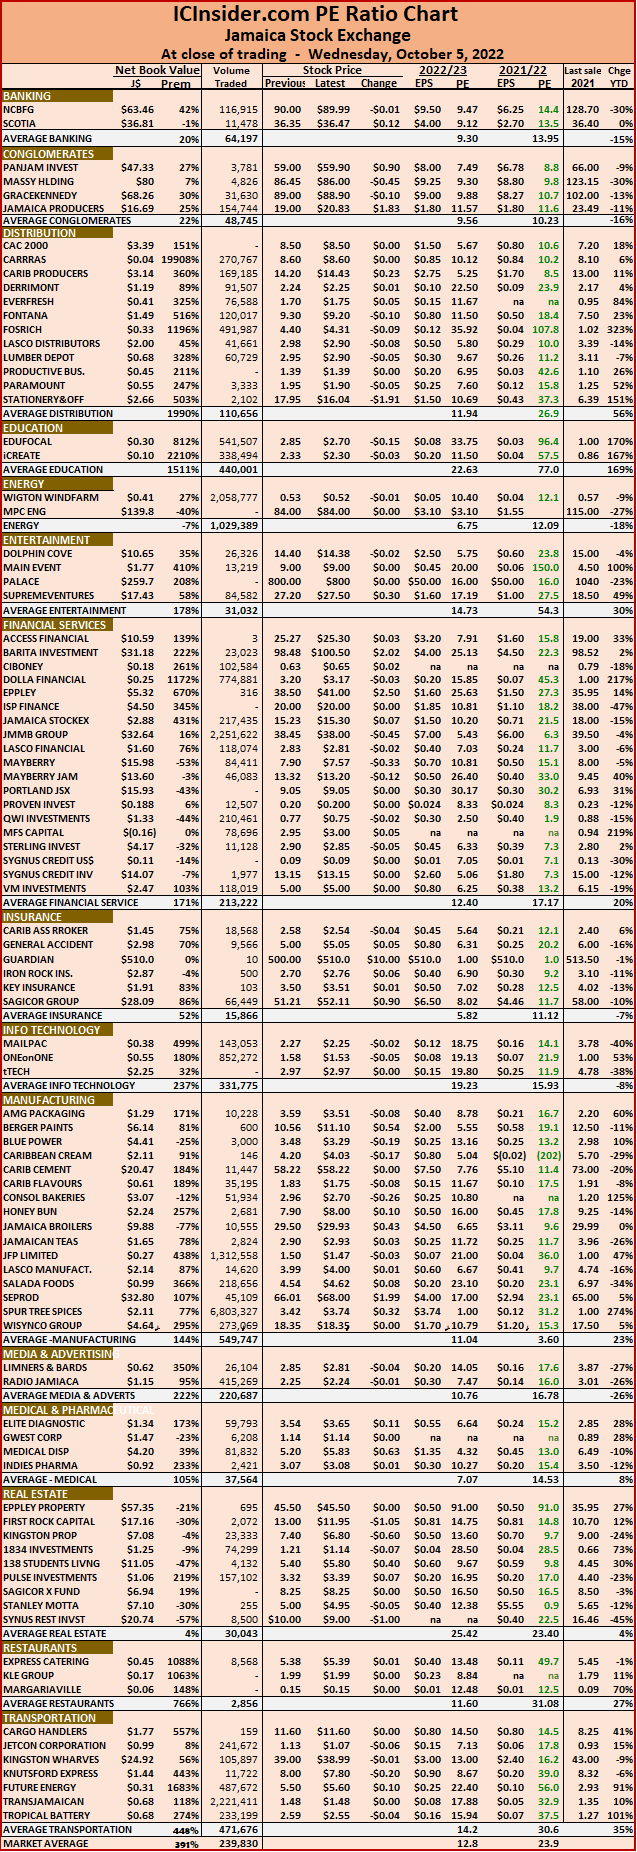 The net asset value of each company is reported as a guide to assess the value of stocks based on this measure quickly. The chart also shows daily changes in stock prices and the percentage year to date price movement based on the last traded prices. Dividends payable and yields for each company are shown in the Main and Junior Markets’ daily report charts that show the closing volume for the bids and offers.
 The All Jamaican Composite Index popped 4,027.86 points to 410,104.57, the JSE Main Index fell 1,429.05 points to 359,272.56, the Junior Market Index shed 59.11 points to 4,148.29 and the JSE USD market Index added 4.63 points to close 217.29.
 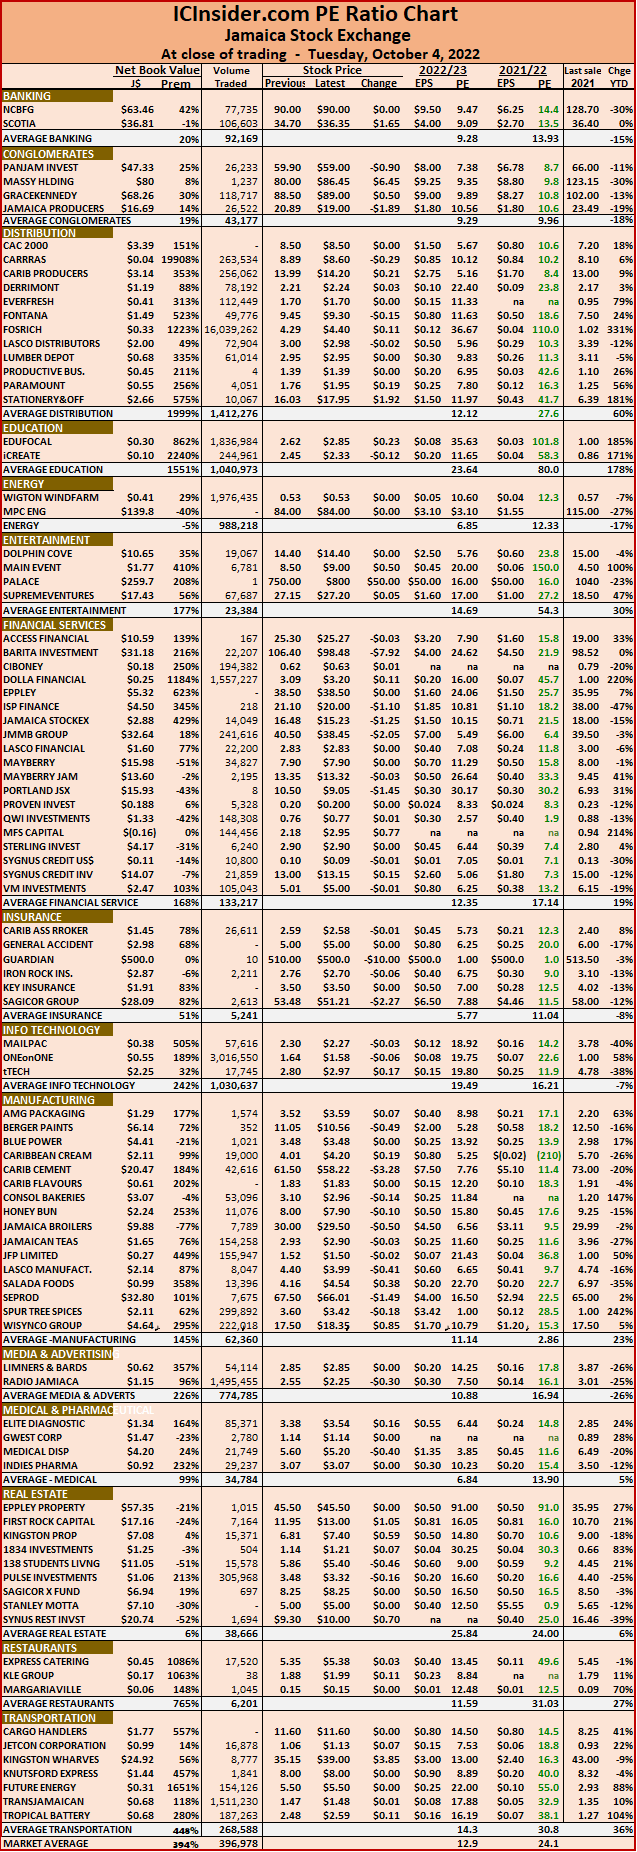 The net asset value of each company is reported as a guide to assess the value of stocks based on this measure quickly. The chart also shows daily changes in stock prices and the percentage year to date price movement based on the last traded prices. Dividends payable and yields for each company are shown in the Main and Junior Markets’ daily report charts that show the closing volume for the bids and offers.