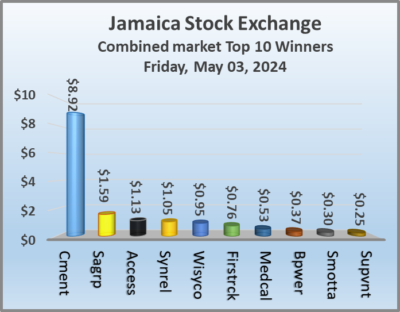
Caribbean Cement buoyed by solid first quarter results jumped $8.92 to a 52 weeks’ high of $69.90 as investors placed buying pressure on the stock that is currently in low supply. The Jamaica Stock Exchange ended trading on Friday as the Junior Market rose moderately, as the Main and the JSE USD markets fell, with trading ended with the number of stocks changing hands falling, while the value greater than the previous day, resulting in prices of 32 shares rising and 38 declining.
 At the close of the market, the JSE Combined Market Index dropped 1,966.60 points to 334,026, the All Jamaican Composite Index dived 2,933.34 points to 358,098.21. The JSE Main Index declined 2,094.43 points to 320,793.99. The Junior Market Index advanced 5.91 points to finish at 3,803.31 and the JSE USD Market Index shed 1.43 points to close at 236.44.
At the close of trading, 7,495,887 shares were exchanged in all three markets, down from 16,848,224 units on Thursday, with the value of stocks traded on the Junior and Main markets amounted to $73.15 million, just over the $68.79 million on the previous day and the JSE USD market closed with an exchange of 107,250 shares for US$8,800 compared to 98,700 units at US$20,672 on Thursday.
In Main Market activity, Transjamaican Highway led trading with 837,274 shares followed by Carreras with 662,564 stocks and Wigton Windfarm with 642,927 units.
In Junior Market trading, Dolla Financial led trading with 686,474 shares followed by Everything Fresh with 522,652 units and Express Catering with 211,271 stocks.
In the preference segment, Productive Business Solutions 9.75% preference share shed $1.50 to close at $113.50.
 The market’s PE ratio, the most popular measure used to determine the value of stocks, ended at 19.9 on 2023-24 earnings and 13.6 times those for 2024-25 at the close of trading. ICInsider.com PE ratio chart and the more detailed daily charts provide investors with regularly updated information to help decision-making.
The PE ratio chart covers all ordinary shares on the Jamaica Stock Exchange, grouped by industry, allowing for easy comparisons within a sector and the overall market. The EPS & PE ratios are based on 2023 and 2024 actual or projected earnings, excluding major one off items.
Pertinent information is required to navigate numerous investment options successfully in the stock market. The ICInsider.com PE ratio chart and the more detailed daily report charts provide investors with regularly updated information to help decision-making.
The chart should be used in making rational decisions when investing in stocks close to the average for the sector, not going too far from it unless there are compelling reasons to do so. This approach helps to remove emotions from investment decisions and place them on fundamentals while at the same time not being too far from the majority of investors. 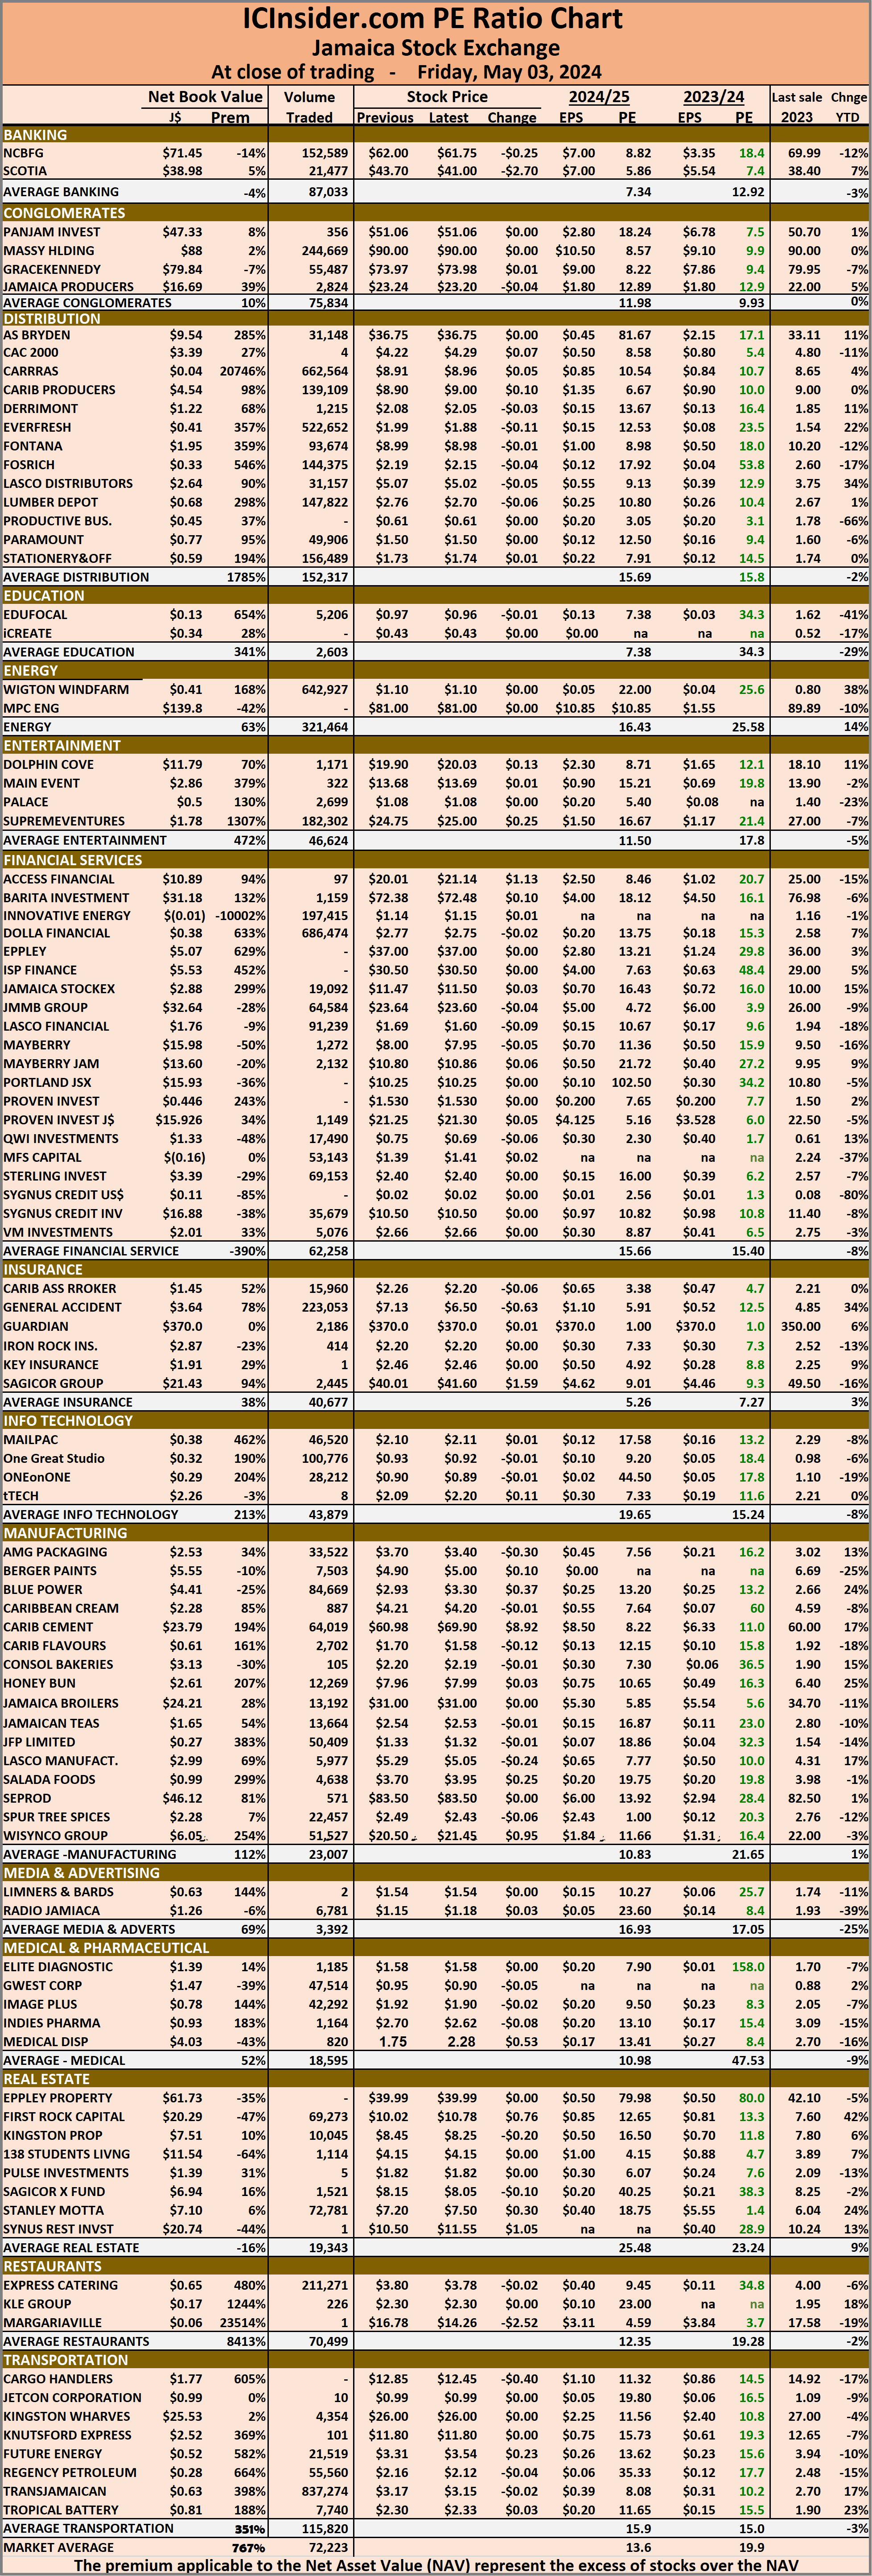 Investors who buy when the price of a stock is close to the average will find that they are not inclined to overpay for a stock.
The net asset value of each company is reported as a guide for investors to quickly assess the value of stocks based on this measure. The chart also shows daily changes in stock prices and the percentage year to date price movement based on the last traded prices.
Dividends paid or payable and yields for each company are shown in the Main and Junior Markets’ daily report charts, along with the closing volume of the highest bid and the lowest offer for each company.
Caribbean Cement at 1 year high
May 3, 2024 by IC Insider.com
Filed Under: Feature Stories, JSE Combined, Stock Market Tagged With: 138 Student Living, Caribbean Cement, Daily Trading, Emerging market, Eppley, Jamaica Producers, Jamaica Stock Exchange, Jamaica Stock Exchange Combined Index, Jamaican stocks, JPS, JSE Main Index, junior market, Junior Market index, NCB Financial, Net asset Value of Jamaican stocks, Pan Jam, PE Ratio of Jamaican stocks, Productive Business Solutions, Scotia Group, Seprod, Trading Activity, Transjamaican Highway, Wigton Windfarm
About IC Insider.com


