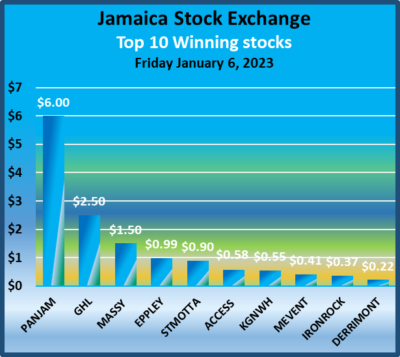
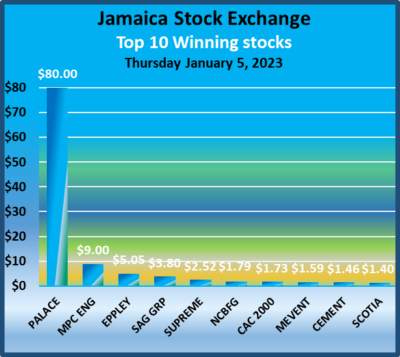
The Jamaica Stock Exchange enjoyed a nice bounce on Friday, with a rising Main Market as trading picked up sharply over the miniscule levels on Thursday, with the value of shares traded surging as well following an exchange of $84 million worth of shares in Massy Holdings and $62 million worth of PanJam Investment shares.
 At the close of trading the Main Market indices bounced more than the fall on Thursday, but the Junior Market lost some ground giving up all of Thursday’s gains and the JSE USD market remained virtually flat at the close after slipping a few points.
Trading ended, with an exchange of 17,408,795 shares up from 13,188,780 units on Thursday, with the value rising sharply to $217.47 million up from $40 million on the previous day. The JSE USD market ended with the value of stocks traded amounting to US$11,314 up from US$9,508 on Thursday.
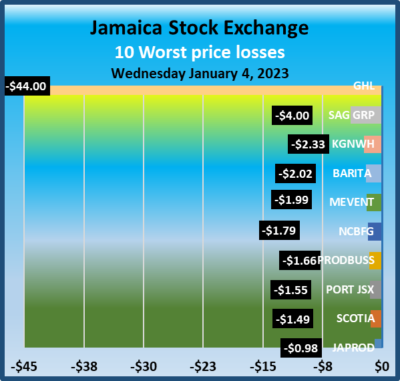
At the close, the Combined Market Index dropped 2,398.34 points to 360,607.78, the All Jamaican Composite Index fell 2,146.48 points to 396,043.87, the JSE Main Index shed 2,768.71 points to 348,180.63, the Junior Market fell 20.07 points to 3,900.78 and the JSE US dollar market closed at 233.85 after slipping 0.04 points.
 The market’s PE ratio ended at 22.4 based on 2021-22 earnings and 13.4 times those for 2022-23 at the close of trading.
Investors need pertinent information to successfully navigate many investment options in the local stock market. The ICInsider.com PE ratio chart and the more detailed daily report charts provide investors with regularly updated information to help decision-making.
Investors should use the chart to help make rational investment decisions by investing in stocks close to the average for the sector and not going too far from it unless there are compelling reasons to do so. This approach helps to remove emotions from investment decisions and put in on fundamentals while at the same time not being too far from the majority of investors. Investors who buy when the price of a stock is close to the average will find that they are not inclined to overpay for a stock.
The ICInsider.com PE Ratio chart covers all ordinary shares on the Jamaica Stock Exchange. It shows companies grouped on an industry basis, allowing easy comparisons between the same sector companies and the overall market.
The net asset value of each company is reported as a guide to assess the value of stocks based on this measure quickly. The chart also shows daily changes in stock prices and the percentage year to date price movement based on the last traded prices. 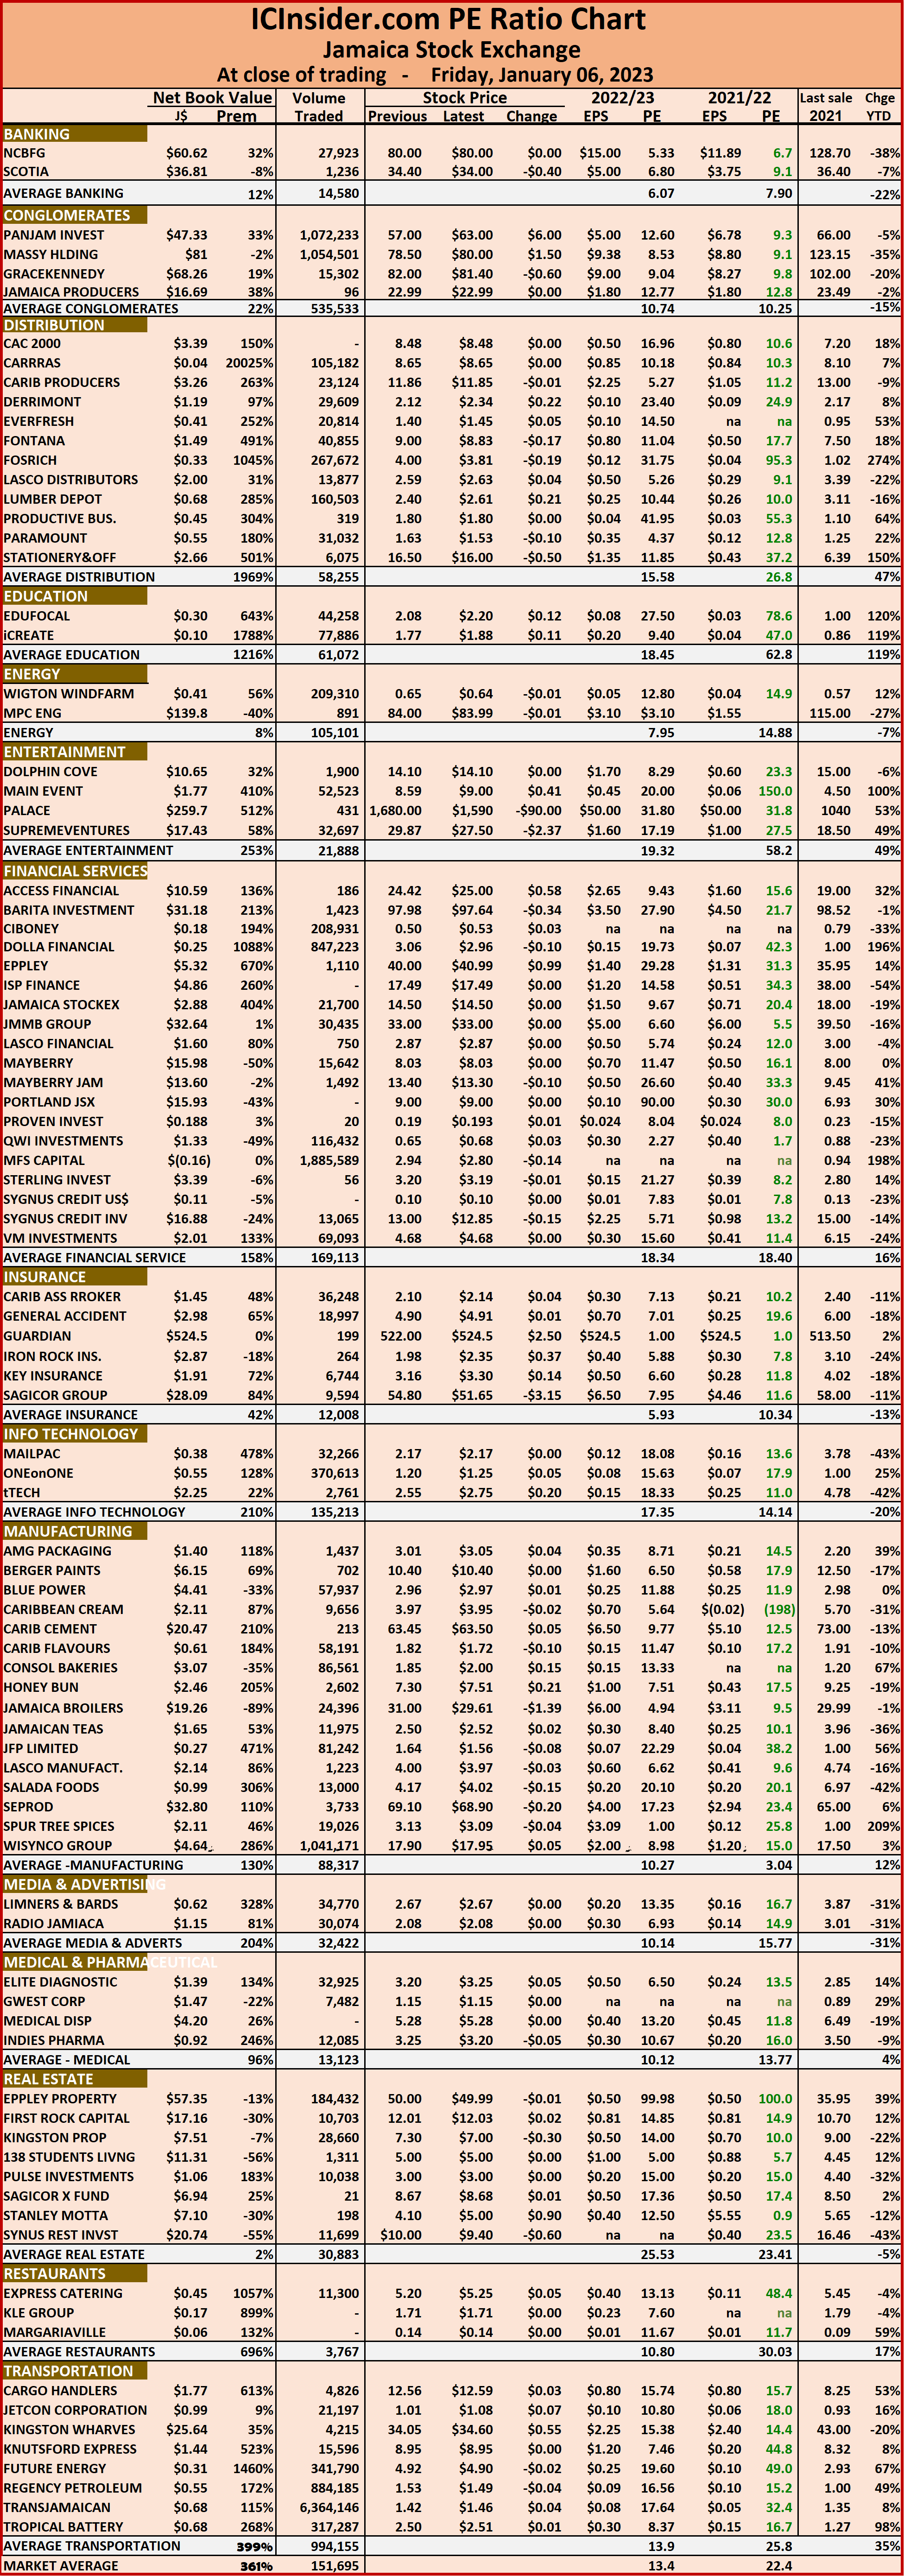 Dividends payable and yields for each company are shown in the Main and Junior Markets’ daily report charts that show the closing volume for the bids and offers.
The EPS & PE ratios are based on 2021 and 2022 actual or projected earnings, excluding major one off items. The PE Ratio is the most popular measure used to determine the value of stocks.
JSE Main Market climbs as volume spikes
Jamaica Stock Exchange poised for solid gains in 2023
 The Jamaican stocks are poised to record a solid performance in 2023 as interest rates commence their decent later in the year and profits of several companies enjoy significant gains. Inflation has passed its peak from 2021 and trended down in 2022 towards the 7 percent level and is set to fall further. The economy is growing as the critical important tourism sector enjoys a sharp recovery while certain input costs have normalized.
Investors should focus on the likely performance of individual companies rather than on the market. Even as interest rates rose sharply last year, it did not prevent the majority of stocks in the Junior Market from rising and nearly half those in the Main Market, as profit growth out weight pressure from rising interest rates. Careful looking at economic developments for 2023 points to another year when there will be significant gains for several companies as profits of many will rise and BOJ cut interest rates as inflation subsides and foreign exchange inflows jump.

Dolphin Cove stock projected to a big 2023 winner.
A key investment observation reveals that good stocks deliver optimal returns over an extended period. They do not usually make huge moves over a short period that is clearly the case with ICTOP15 stocks that may deliver good gains over more than a one year period. Investors need to take this approach to benefit fully from the attractive bargains that currently exist in the Jamaica Stock Market, with uncertainty as to the exact timing of the market takeoff.
The past year ably demonstrated the need to focus on companies, not the markets. The Junior Market managed to record gains of 16.3 percent for the year, but it turned out to be lower than the 29.7 percent gain in 2021. The main market declined at the end of the year as investors forsook the financial institutions in the market and essentially pushed the market down due to rising interest rates.
2022 started off quite brightly for the Jamaica stock market, especially Junior stocks that were up 27 percent by May, but increasing interest rates placed a damper on the performance of stocks, even then, 31 stocks in the Junior Market rose, with 21 gaining 11 percent to a high of 312 percent and 15 stocks gaining over 50 percent, while 7 gained 100 percent or more.

Caribbean Producers to be a big 2023 winner
While the main market index fell 10 percent for the year, the market ended the year with gains in 22 stocks, with gains between two and 82 percent compared with 25 losers that fell from 3 percent to 40 percent. Increased profits were the primary reason for the gains in both markets.
In some cases, some stocks that did spectacularly well in the early part of the year pulled back markedly after Treasury bill rates surged to 8.5 percent in April and remained at that level to the end of the year.
The 80:20 rule of investing shows an average of only 20 percent of stocks that end in the TOP10 in a year repeat in the following one, while around 40 percent of the 10 worst performers end up in the TOP10 in the following year that is supported by data going back 40 years in the local market. The clear message is that investors should not get carried away with an outstanding winner and miss out on other opportunities.
The ICTOP15 are chosen based on the best information available, but there are many other factors to be aware of in 2023 that could swing in favour of or against the selections. Shipping rates that were very high for some time in 2022 are almost back to normal and will result in lower input costs for many listed companies.

Everything Fresh to enjoy gains from tourism in 2023.
Interest rates have been hiked appreciably to contain inflation and foreign exchange demand. With inflation subsiding, interest rates could start a downward trek in the first half of the year and probably before the first quarter ends, when this happens it will be a positive sign for stocks. Worldwide, many prices are declining. Locally, tourism has bounced back strongly but could jump around 50 percent up to April and have significant implications for the broader economy and several listed companies. Bear in mind that the revenues and profits of companies will be affected in different ways and it will be challenging for forecasts to be always close to the mark. 2023 will be a year to key keen eyes on ongoing developments that could affect companies and their operations.
Two key features of the stock market in 2023 will be the strong rebound in tourism traffic in the first half of the year compared with 2022, this development will contribute to above average GDP growth in the first half but will also result in a significant jump in revenues and profits for a number of companies, Caribbean Producers, Dolphin Cove, Everything Fresh and Express Catering that are heavily involved in trading in that sector.
NCB Financial could move from worst performer to TOP10 2023 performer
For the first quarter of 2022 visitor arrivals to Jamaica averaged approximately 72 percent compared to 2019 and 97 percent in the April to June period but in September and October the numbers climbed approximately 12 percent over that for 2019 when this level of recovery is factored into the equation for 2023 visitor arrivals in the first half of the year quit drum by 30 percent or more.
Banks benefited from increased interest rates in 2022 and will continue to do so in 2023 and should see some reversal in losses recorded last year as other comprehensive income. Other companies that would benefit but to a lesser degree are companies such as Wisynco and Jamaica Broilers in addition ICInsider.com expect interest rates to decline during the course of the year and that should provide added stimulus to the market.
A lot of potential gains were not factored into stock prices in 2022 many attractive ones are cheap, investors only task is to make the right choices to pick up gains in 2023 that could be much more exciting than normal.
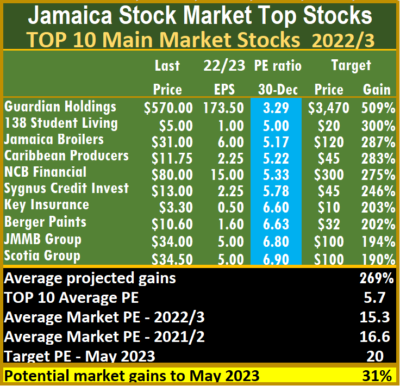
The Junior Market has 15 stocks representing 32 percent of the market, with PEs from 15 to 35, averaging 21 compared with the above average of the market. The top half of the market has an average PE of 18 and shows the extent of potential gains that lie ahead for the TOP 10 stocks. The situation in the Main Market is similar, with the 20 highest valued stocks priced at a PE of 15 to 110, with an average of 33.5 and 24 excluding the highest valued ones and 22 for the top half excluding the highest valued stock.
Some of the above gains will not be fully reflected until May 2023 as stocks move primarily in response to the release of results. Companies with earlier year ends will discount most of the earnings before those with later periods.
Main Market stocks did poorly as a group in 2022, but they should enjoy a better year in 2023 with interest rates falling during the year and investors are presented with many choices of undervalued stocks. Regardless, Junior Markets stocks are points to outperform those of the more mature companies in the Main Market.
Juniors rise majors fall
Stocks mostly fell on the JSE Main Market on Thursday, for a second day but vastly less than the significant drop on Wednesday, while the Junior Market recovered some lost grounds suffered over the past two days and the JSE USD market remained flat at the close.
 Trading ended with an exchange of 13,188,780 shares from 18,423,695 units on Wednesday, with a value dropping sharply to just $40 million down from $84.7 million on the previous day. The JSE USD market ended with the value of stocks traded amounting to US$9,508 up from US$3,524 on Wednesday.
At the close, the Combined Market Index fell 1,440.80 points to 358,209.44 the All Jamaican Composite Index dropped 2,146.48 points to 392,484.67, the JSE Main Index shed 1,737.67 points to 345,411.92, the Junior Market index rose 19.61 points to 3,920.85 and the JSE US dollar market closed unchanged at 233.85.
The market’s PE ratio ended at 21.1 based on 2021-22 earnings and 13.2 times those for 2022-23 at the close of trading.
 Investors need pertinent information to successfully navigate many investment options in the local stock market. The ICInsider.com PE ratio chart and the more detailed daily report charts provide investors with regularly updated information to help decision-making.
Investors should use the chart to help make rational investment decisions by investing in stocks close to the average for the sector and not going too far from it unless there are compelling reasons to do so. This approach helps to remove emotions from investment decisions and put in on fundamentals while at the same time not being too far from the majority of investors. Investors who buy when the price of a stock is close to the average will find that they are not inclined to overpay for a stock.
The ICInsider.com PE Ratio chart covers all ordinary shares on the Jamaica Stock Exchange. It shows companies grouped on an industry basis, allowing easy comparisons between the same sector companies and the overall market.
The net asset value of each company is reported as a guide to assess the value of stocks based on this measure quickly. The chart also shows daily changes in stock prices and the percentage year to date price movement based on the last traded prices. 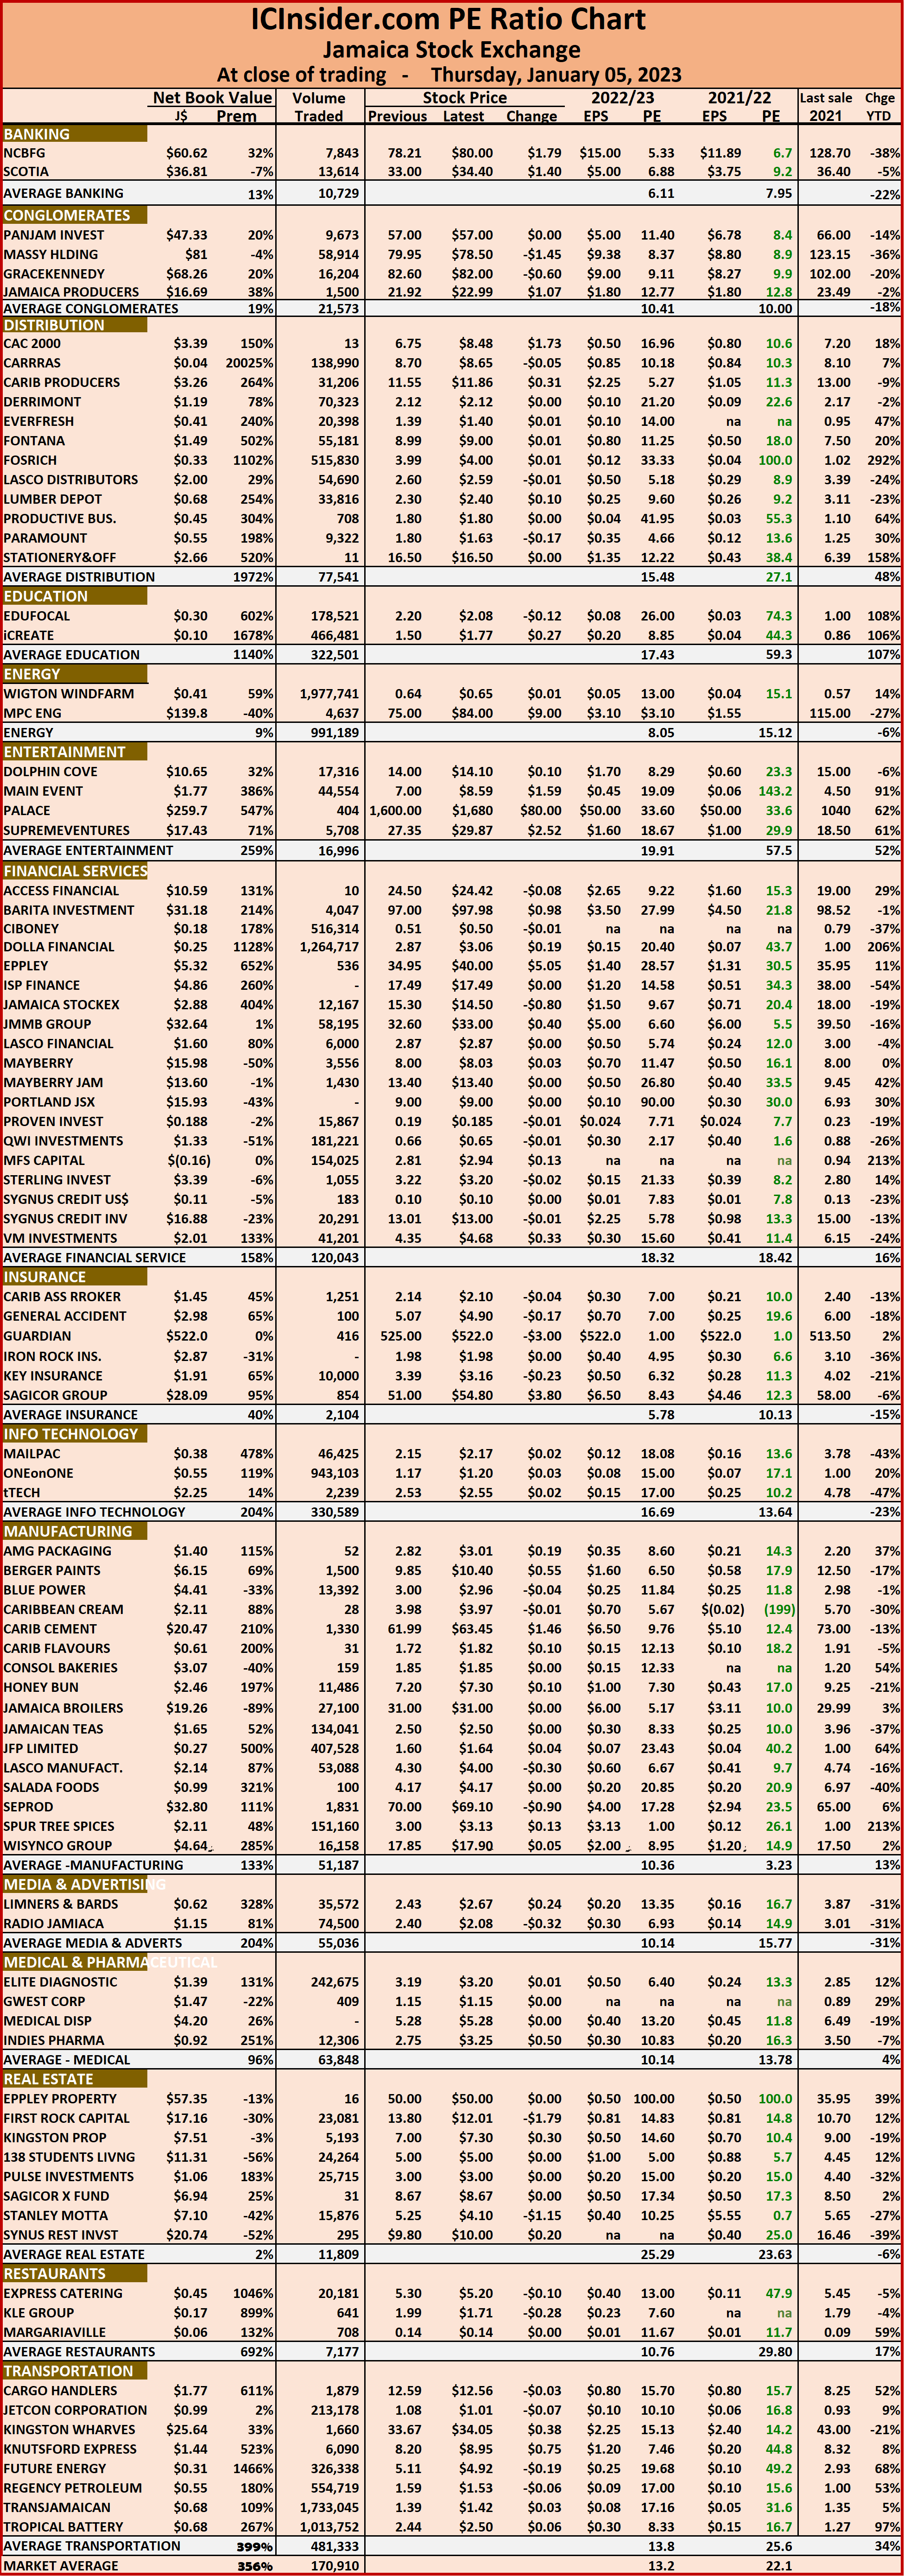 Dividends payable and yields for each company are shown in the Main and Junior Markets’ daily report charts that show the closing volume for the bids and offers.
The EPS & PE ratios are based on 2021 and 2022 actual or projected earnings, excluding major one off items. The PE Ratio is the most popular measure used to determine the value of stocks.
All JSE Markets drop
All JSE Markets dropped as stocks mostly fell on Wednesday, with the JSE Main Market breaking its winning streak from the last two weeks, while the Junior Market slipped further for a second trading day and the JSE USD market dipped a few points after being in positive territory until the dying minutes of trading.
 Trading ended, with an exchange of 18,423,695 shares from 16,287,615 units on Tuesday, with the value dropping to $84.7 million down from $87.4 million on the previous day. The JSE USD market ended with the value of stocks traded amounting to US$3,524 down from US$11,129 on Tuesday.
At the close, the Combined Market Index dropped 8,910.35 points to 359,650.24, the All Jamaican Composite Index dived 9,718.27 points to 394,631.15, the JSE Main Index shed 9,089.39 points to 347,149.59, the Junior Market dropped 47.01 points to 3,901.24 and the JSE US dollar market dipped 0.57 points to 233.85.
The market’s PE ratio ended at 21.1 based on 2021-22 earnings and 12.9 times those for 2022-23 at the close of trading.
 Investors need pertinent information to successfully navigate many investment options in the local stock market. The ICInsider.com PE ratio chart and the more detailed daily report charts provide investors with regularly updated information to help decision-making.
Investors should use the chart to help make rational investment decisions by investing in stocks close to the average for the sector and not going too far from it unless there are compelling reasons to do so. This approach helps to remove emotions from investment decisions and put in on fundamentals while at the same time not being too far from the majority of investors. Investors who buy when the price of a stock is close to the average will find that they are not inclined to overpay for a stock.
The ICInsider.com PE Ratio chart covers all ordinary shares on the Jamaica Stock Exchange. It shows companies grouped on an industry basis, allowing easy comparisons between the same sector companies and the overall market.
The net asset value of each company is reported as a guide to assess the value of stocks based on this measure quickly. The chart also shows daily changes in stock prices and the percentage year to date price movement based on the last traded prices. Dividends payable and yields for each company are shown in the 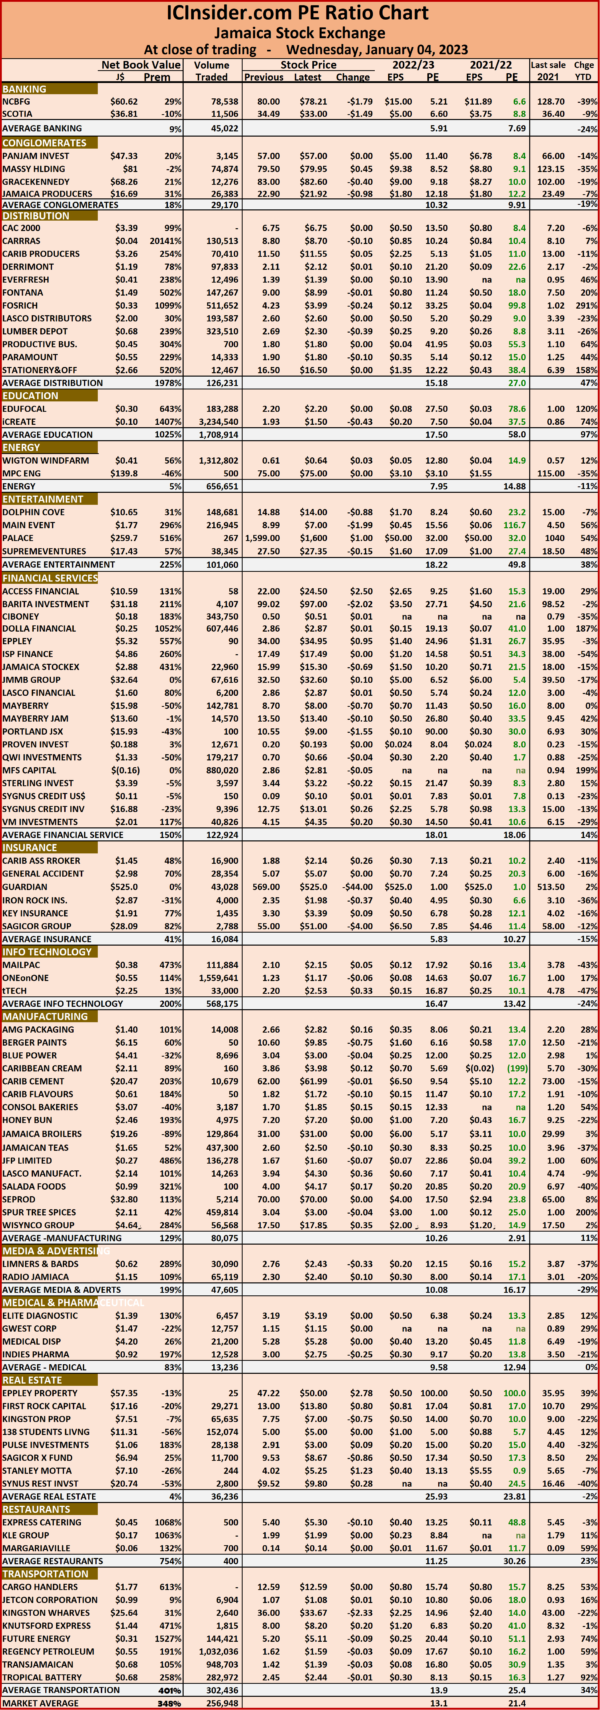 Main and Junior Markets’ daily report charts that show the closing volume for the bids and offers.
The EPS & PE ratios are based on 2021 and 2022 actual or projected earnings, excluding major one off items. The PE Ratio is the most popular measure used to determine the value of stocks.
JSE Main Market up Juniors down
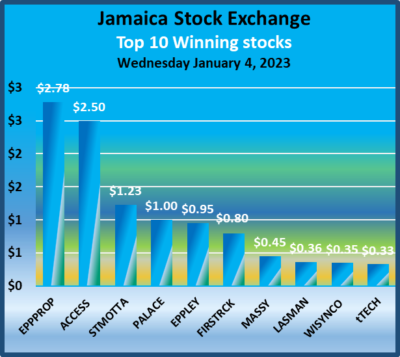
The JSE Main Market continued its winning streak from the last two weeks of 2022 and the JSE USD market popped a few points to start off 2023 on a winning note, but the Junior Market fell more than 50 points to give back quite a bit of Friday’s gains.
 Trading ended, with an exchange of 16,287,615 shares from 205,547,234 units on Friday, with a value dropping sharply to $87.4 million down from $1.62 billion on the previous trading day. The JSE USD market ended with the value of stocks traded amounting to US$11,129 up from US$5,053 on Friday.
At the close, the Combined Market Index dipped 31.39 points to 368,560.59, the All Jamaican Composite Index rose 1,269.06 points to 404,349.42, the JSE Main Index rallied 342.34 points to 356,238.98, the Junior Market dropped 38.19 points to 3,948.25 and the JSE US dollar market popped 0.45 points to 234.42.
The market’s PE ratio ended at 22.4 based on 2021-22 earnings and 13.3 times those for 2022-23 at the close of trading.
Investors need pertinent information to successfully navigate many investment options in the local stock market. 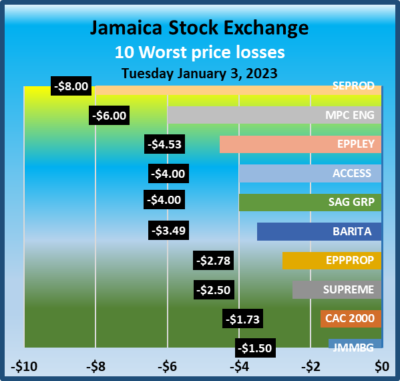 The ICInsider.com PE ratio chart and the more detailed daily report charts provide investors with regularly updated information to help decision-making.
Investors should use the chart to help make rational investment decisions by investing in stocks close to the average for the sector and not going too far from it unless there are compelling reasons to do so. This approach helps to remove emotions from investment decisions and put in on fundamentals while at the same time not being too far from the majority of investors. Investors who buy when the price of a stock is close to the average will find that they are not inclined to overpay for a stock.
The ICInsider.com PE Ratio chart covers all ordinary shares on the Jamaica Stock Exchange. It shows companies grouped on an industry basis, allowing easy comparisons between the same sector companies and the overall market.
The net asset value of each company is reported as a guide to assess the value of stocks based on this measure quickly. The chart also shows daily changes in stock prices and the percentage year to date price movement based on the last traded prices. Dividends payable and yields for each company are shown in the  Main and Junior Markets’ daily report charts that show the closing volume for the bids and offers.
The EPS & PE ratios are based on 2021 and 2022 actual or projected earnings, excluding major one off items. The PE Ratio is the most popular measure used to determine the value of stocks.
62% Junior Market stocks gained in 2022
The strong start for Jamaican stocks faltered after interest rates on Treasury bills peaked in April, sending the market into reverse from then until year end. Regardless the Junior Market index posted a 16.3 percent gain for the year, but 62 percent of the stocks recorded gains in 2022.
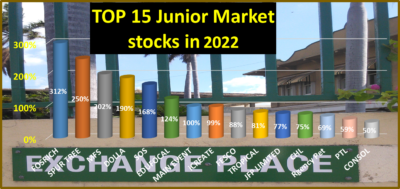 The market peaked at a record high in early May, but it ended the year with 29 stocks with gains compared with 18 losers that fell from 4 percent to 54 percent, with ISP Finance being the worst performer, followed by a 45 percent fall in Mailpac and 40 percent for tTech, with five 2022 IPO stocks being in the TOP15. Fosrich bolted 312 percent for the year to be the leading stock on the overall JSE market in 2022.
The 2022 new listing, Spur Tree Spices, came in at number 2, an ICInsider.com 2022 TOP 15 selection, posted gains of 250 percent. 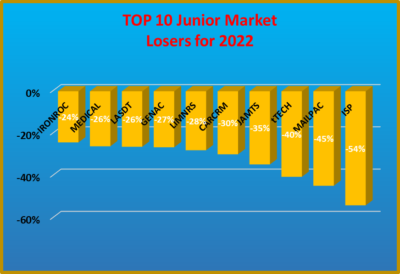 MFS Partners, formerly SSL Venture Capital, came in at number three with 202 percent following the acquisition by a new majority owner and a new business model and Stationery and Office Supplies, an ICTOP15 pick, came in with gains of 145 percent after robust increases in revenues and profit for the year.
The Main Market declined at the end of the year, with the JSE Main Index down 10.2 percent after it struggled to rise a mere two percent by mid-May at its peak for the year.
Technical tools forecast likely market developments well ahead of when they do occur.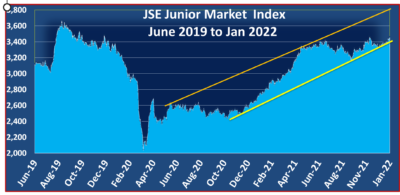 Junior Market performance was telegraphed from January 2022 by the attached technical chart showing trendlines pointing to a level to a likely high for 2022 beyond 3,800 points. The market index exceeded the upper end in February and remained there until July and pulled below it in the second half of the year ending up just below the lower level in the Middle of November with an initial public offering that drained resources from the secondary market.
Another week of ICTOP10 changes
The Jamaica Stock Exchange Main Market recorded two weeks of solid gains to close out a disappointing 2022, with the Main Market declining after a promising start, with the market adding 17,123 points in the last two weeks while the All Jamaica added 22,797 points and the Junior Market put on 93 points in the same period, resulting in movements in and out of the TOP10 in both markets.
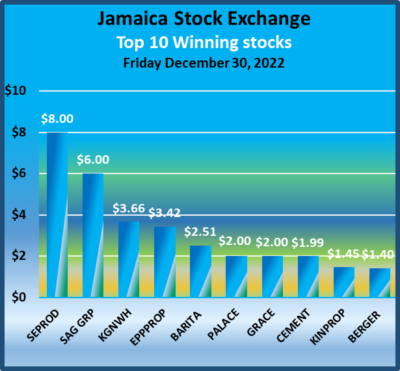
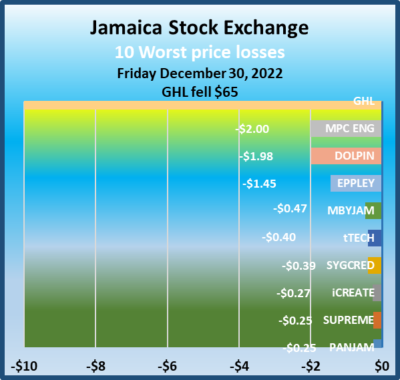
 Junior Market action resulted in Caribbean Cream popping 19 percent to $4, followed by Caribbean Assurance with a 9 percent rise to $2.16, Tropical Battery chipped in with a 7 percent increase to $2.30 and Paramount Trading rose 5 percent to $1.99. General Accident was the biggest loser with a fall of 12 percent to $4.41, Lasco Distributors slipped 8 percent to $2.50 and Lasco Manufacturing declined 6 percent to $3.95.
In the Main Market, Radio Jamaica rose 24 percent to $2.60, followed by JMMB Group up 6 percent to $34 and Jamaica Broilers up 5 percent to $31. The only losing stock in the Main Market is Guardian Holdings dropping 12 percent to $570.
In the Main Market, with the rise in the price of Radio Jamaica, Scotia Group reclaimed its TOP10 spot once more as RJR slipped out after reentering the TOP10 in the previous week, The Junior Market’s Tropical Battery dropped out of the TOP10 and replaced by Knutsford Express.
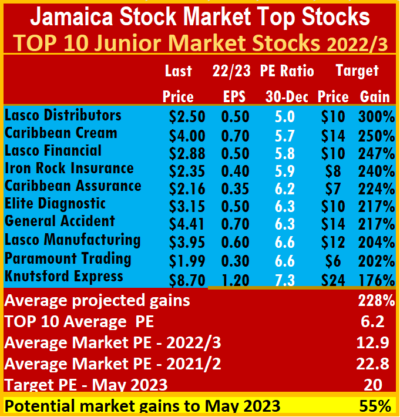 At the end of the week, the average PE for the JSE Main Market TOP 10 is 5.6, well below the market average of 15.3, while the Junior Market Top 10 PE sits at 6.2 versus the market at 12.9, important indicators of the level of the undervaluation of the ICTOP10 stocks. The Junior Market is projected to rise by 228 percent and the Main Market TOP10, an average now of 269 percent, to May 2023.
The Junior Market has 15 stocks representing 32 percent of the market, with PEs from 15 to 35, averaging 21 compared with the above average of the market. The top half of the market has an average PE of 18 and shows the extent of potential gains that lie ahead for the TOP 10 stocks. The situation in the Main Market is similar, with the 20 highest valued stocks priced at a PE of 15 to 110, with an average of 33.5 and 24 excluding the highest valued ones and 22 for the top half excluding the highest valued stock.
 ICTOP10 focuses on likely yearly winners, accordingly, the list includes some of the best companies in the market but not always. ICInsider.com ranks stocks based on projected earnings, allowing investors to focus on the most undervalued stocks and helping to remove emotions in selecting stocks for investments that often result in costly mistakes.
IC TOP10 stocks are likely to deliver the best returns up to the end of May 2023 and are ranked in order of potential gains, computed using projected earnings for the current fiscal year. Expected values will change as stock prices fluctuate, resulting in weekly movements in and out of the lists. Revisions to earnings are ongoing, based on receipt of new information.
Persons who compiled this report may have an interest in securities commented on in this report.
JSE All Jamaica jumps 18,791 points in 2 days
The JSE Main Market enjoyed another big day of trading on Friday to close out the year with strong two days gains, while the Junior Market jumped to sit just below the 4,000 index mark as it closed the year with gains that were less than that of 2021. The US dollar market index had a mild bounce as the year ended with that market rising 19.7 percent for the year.
 Trading ended with an exchange of 205,547,234s hares from 19,368,737 units on Thursday, valued at $1.62 billion versus $113.6 million on the previous day. Kingston Properties contributed the most to trading, with 136 million changing hands for $1.05 billion. The JSE USD market ended with the value of stocks traded amounting to US$5,053 up from US$42,021 on Thursday.
At the close, the Combined Market Index jumped 5,046.42 points to 368,591.98, the All Jamaican Composite Index surged 8,864.59 points to 403,080.36, the JSE Main Index climbed 4,672.83 points to 355,896.64, the Junior Market jumped 74.89 points to 3,986.44 and the JSE US dollar market popped 2.39 points to 233.97.
The market’s PE ratio ended at 22.8 based on 2021-22 earnings and 13.7 times those for 2022-23 at the close of trading.
 Investors need pertinent information to successfully navigate many investment options in the local stock market. The ICInsider.com PE ratio chart and the more detailed daily report charts provide investors with regularly updated information to help decision-making.
Investors should use the chart to help make rational investment decisions by investing in stocks close to the average for the sector and not going too far from it unless there are compelling reasons to do so. This approach helps to remove emotions from investment decisions and put in on fundamentals while at the same time not being too far from the majority of investors. Investors who buy when the price of a stock is close to the average will find that they are not inclined to overpay for a stock.
The ICInsider.com PE Ratio chart covers all ordinary shares on the Jamaica Stock Exchange. It shows companies grouped on an industry basis, allowing easy comparisons between the same sector companies and the overall market.
The net asset value of each company is reported as a guide to assess the value of stocks based on this measure quickly. The chart also shows daily changes in stock prices and the percentage year to date price movement based on the last traded prices. 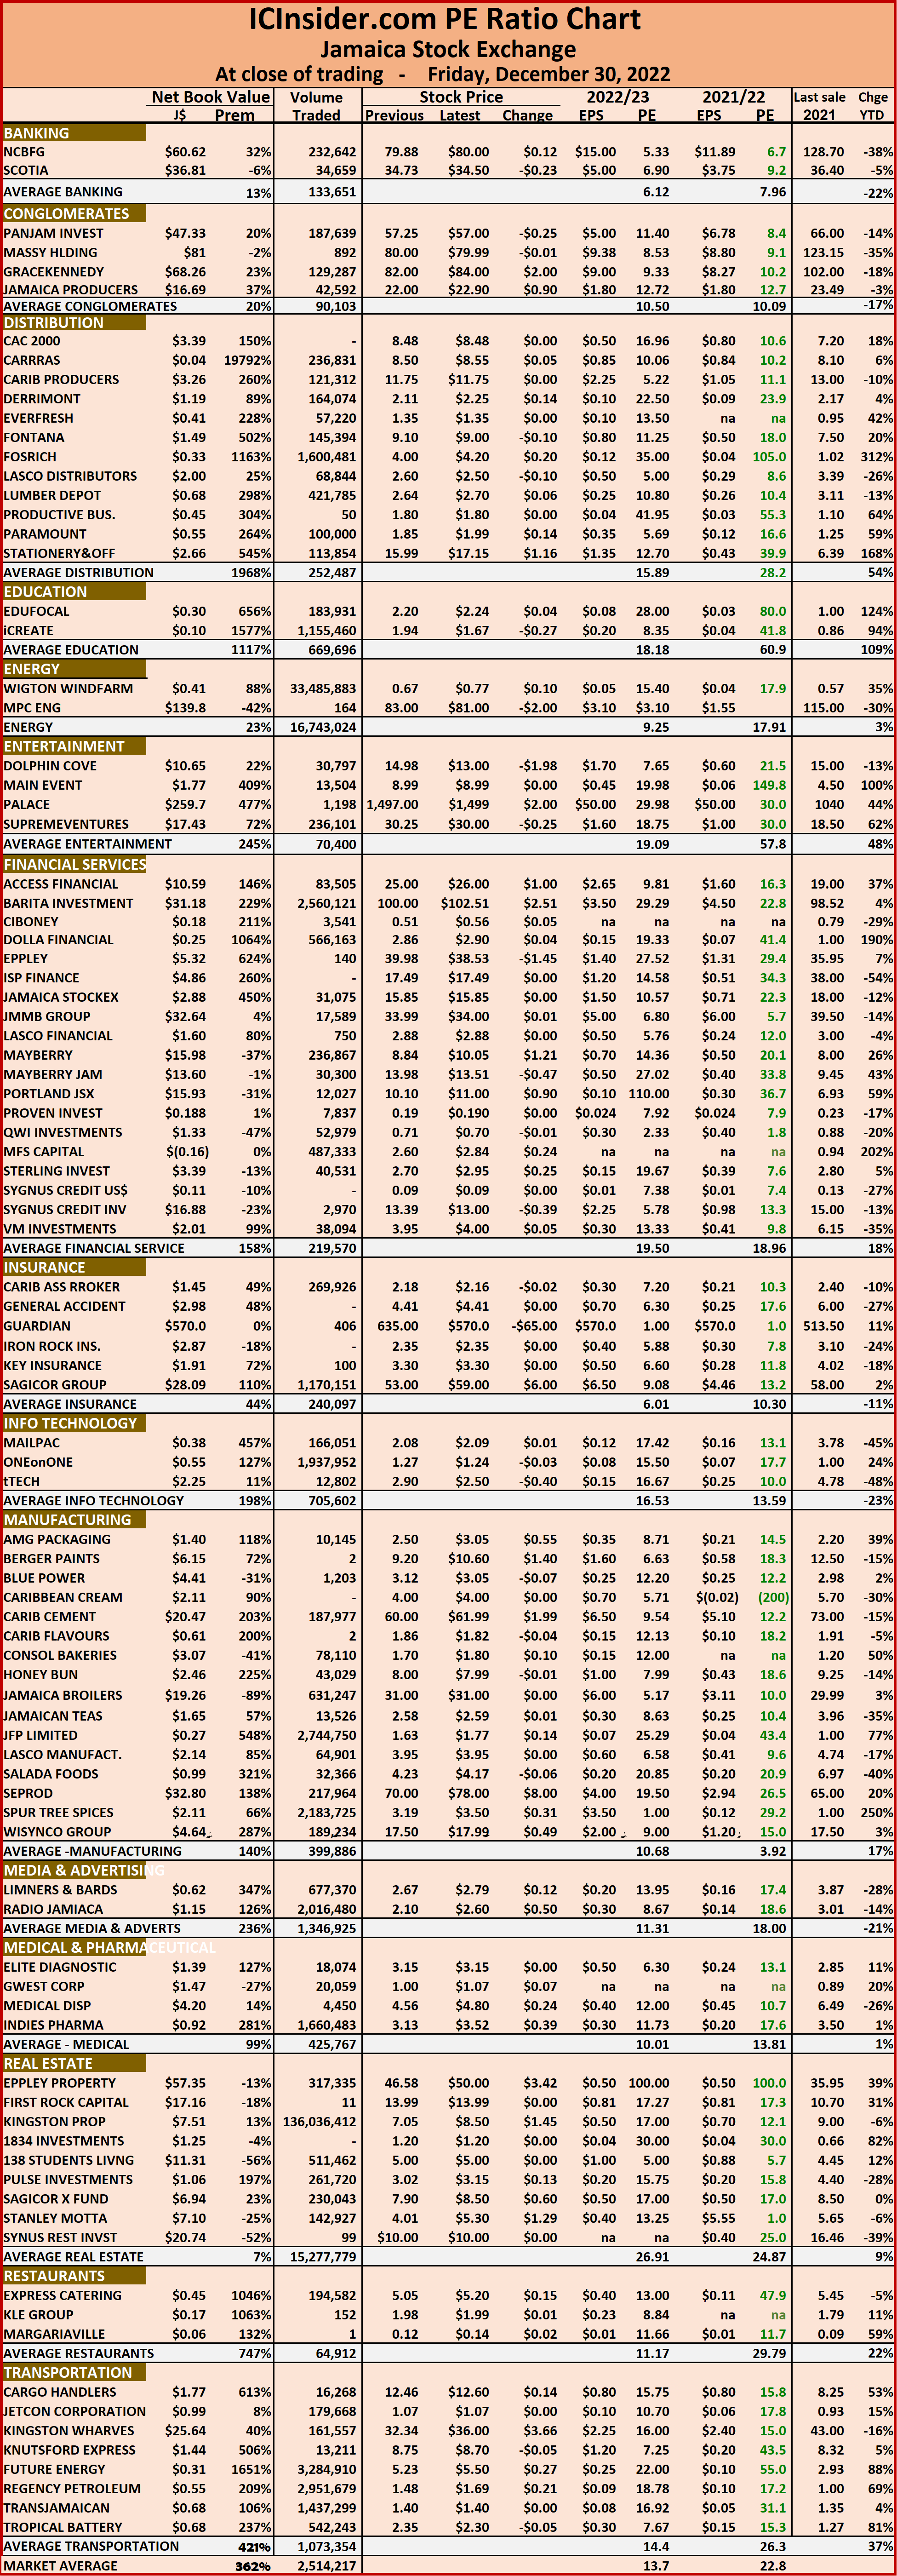 Dividends payable and yields for each company are shown in the Main and Junior Markets’ daily report charts that show the closing volume for the bids and offers.
The EPS & PE ratios are based on 2021 and 2022 actual or projected earnings, excluding major one off items. The PE Ratio is the most popular measure used to determine the value of stocks.
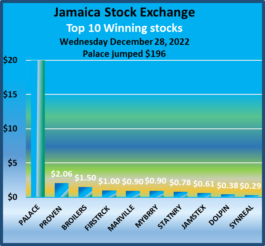
Big JSE Main Market surge
The JSE Main Market index surged sharply on Thursday, while the Junior Market rose moderately and the US dollar market index suffered a sharp reversal after the Jamaica Stock Exchange closed.
 Trading ended, with an exchange of 19,368,737 shares from 32,490,607 units on Wednesday, with a value of $113.6 million versus $98 million on the previous day. The JSE USD market ended with the value of stocks traded amounting to US$42,021 up from US$14,629 on Wednesday.
At the close, the Combined Market Index jumped 5,958.87 points to 363,545.56, the All Jamaican Composite Index surged 9,926.38 points to 394,215.77, the JSE Main Index rose 6,090.77 points to 351,223.81, the Junior Market Index climbed 30.17 points to 3,911.55 and the JSE US dollar market dropped 26.46 points to 231.58.
The market’s PE ratio ended at 22.4 based on 2021-22 earnings and 13.3 times those for 2022-23 at the close of trading.
Investors need pertinent information to successfully navigate many investment options in the local stock market. 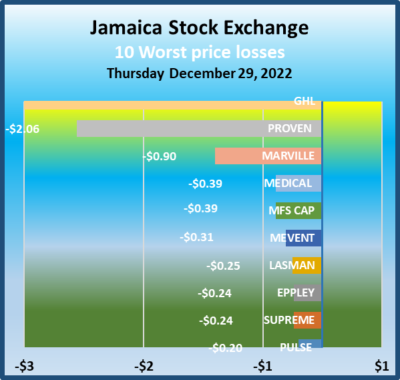 The ICInsider.com PE ratio chart and the more detailed daily report charts provide investors with regularly updated information to help decision-making.
Investors should use the chart to help make rational investment decisions by investing in stocks close to the average for the sector and not going too far from it unless there are compelling reasons to do so. This approach helps to remove emotions from investment decisions and put in on fundamentals while at the same time not being too far from the majority of investors. Investors who buy when the price of a stock is close to the average will find that they are not inclined to overpay for a stock.
The ICInsider.com PE Ratio chart covers all ordinary shares on the Jamaica Stock Exchange. It shows companies grouped on an industry basis, allowing easy comparisons between the same sector companies and the overall market.
The net asset value of each company is reported as a guide to assess the value of stocks based on this measure quickly. The chart also shows daily changes in stock prices and the percentage year to date price movement based on the last traded prices. 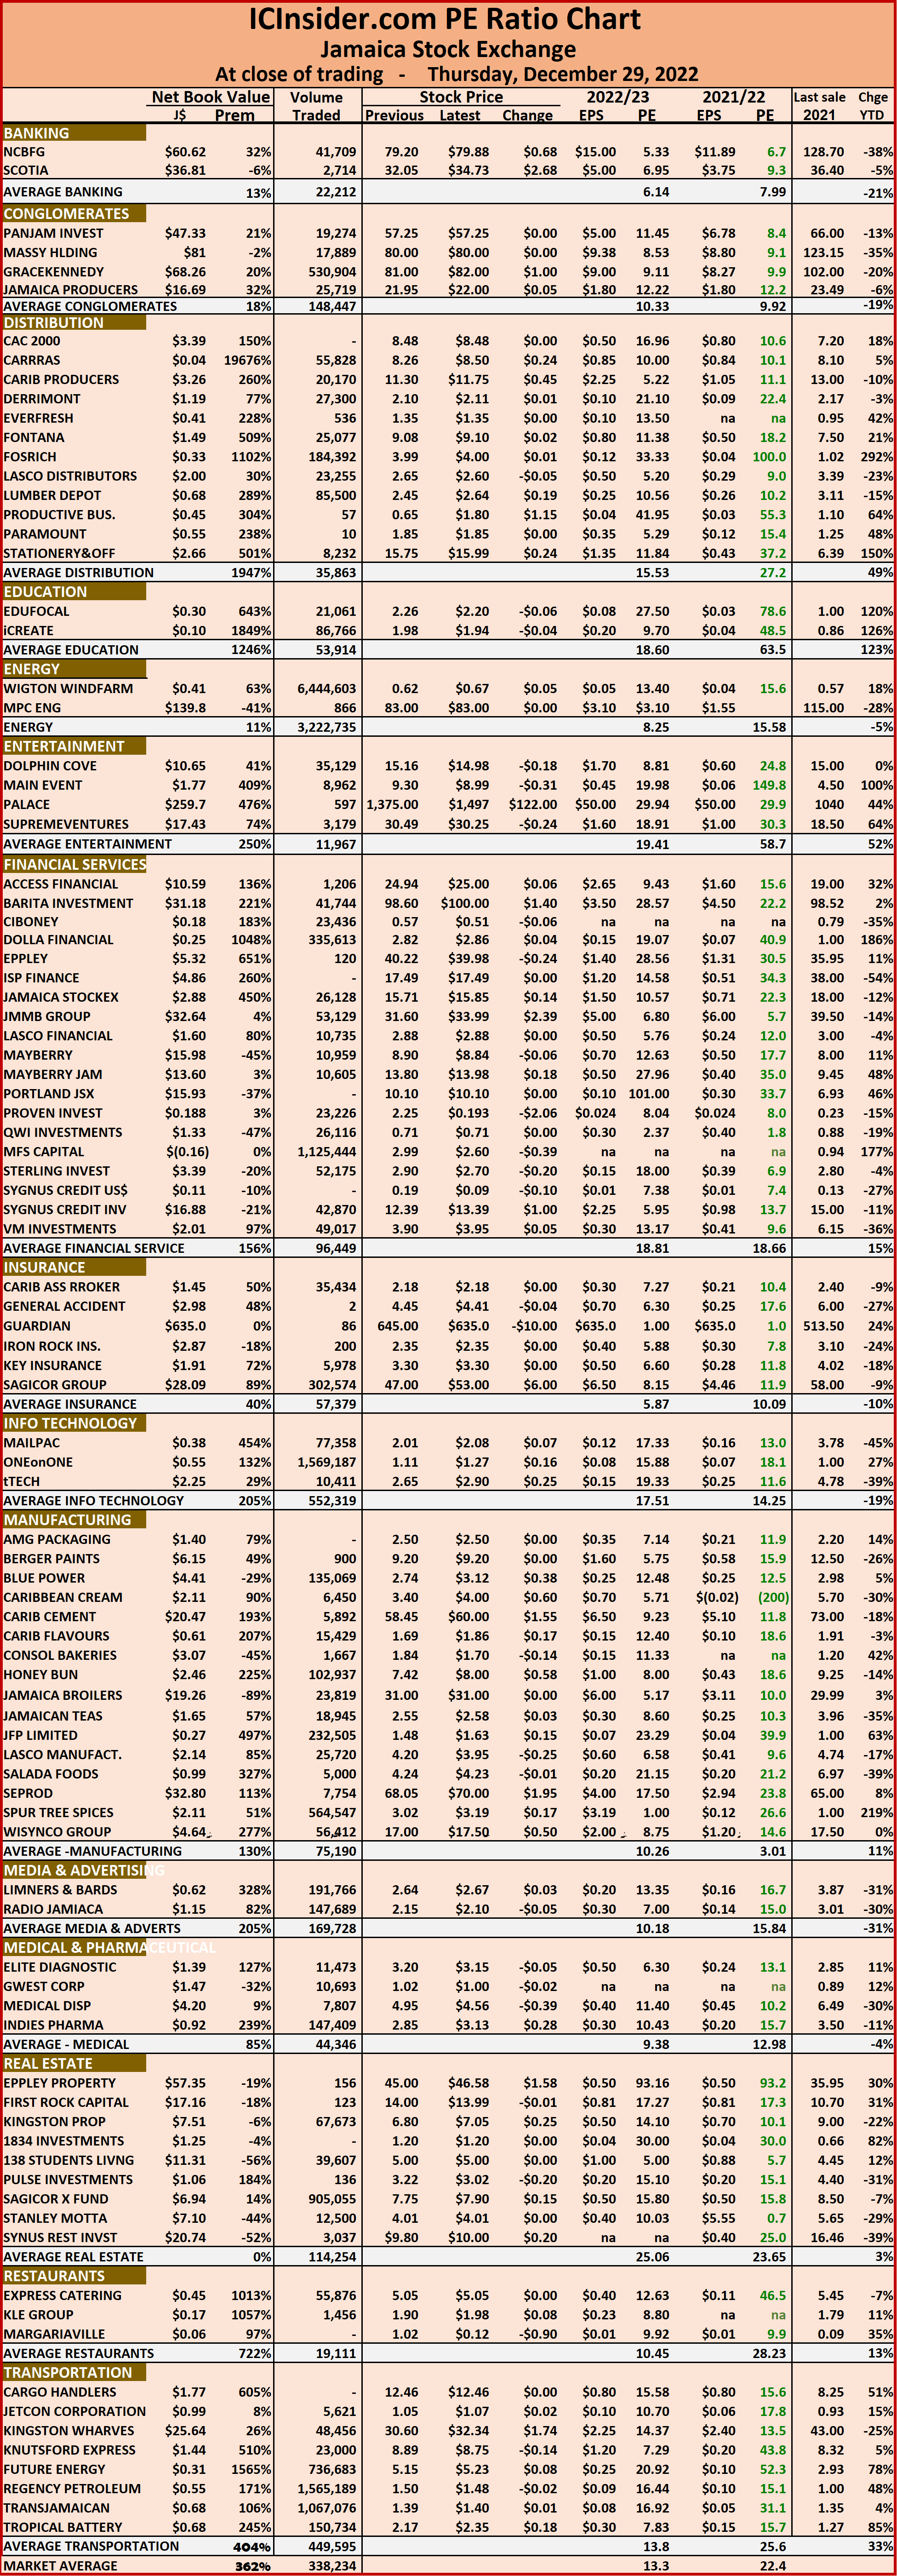 Dividends payable and yields for each company are shown in the Main and Junior Markets’ daily report charts that show the closing volume for the bids and offers.
The EPS & PE ratios are based on 2021 and 2022 actual or projected earnings, excluding major one off items. The PE Ratio is the most popular measure used to determine the value of stocks.
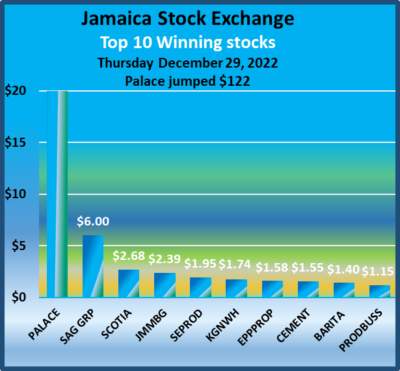
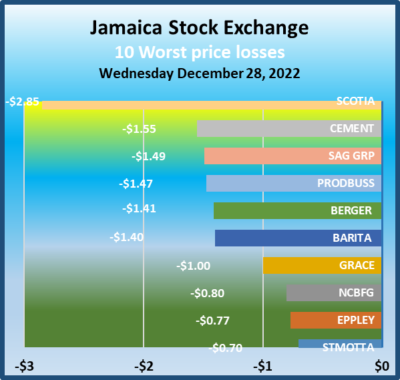
Jamaica Stock Exchange nearly stable,
The JSE Main Market index and the US dollar market index rose on Wednesday after the Jamaica Stock Exchange was closed for the long Christmas holidays, but the Junior Market slipped moderately to start off the last week of the year.
 Trading ended with an exchange of 32,490,607 shares from 57,304,112 units last Friday, with a value of $98 million versus $258.7 million on the previous day. The JSE USD market ended with stocks traded with a value of US$14,629 versus US$699 last Friday.
The Combined Market Index fell 89.14 points to 357,586.69, the All Jamaican Composite Index dipped 178.44 points to 384,289.39, the JSE Main Index rose 169.81 points to 345,133.04, the Junior Market slipped 26.97 points to 3,881.38 and the JSE US dollar market rose 5.46 points to 258.04.
The market’s PE ratio ended at 25 based on 2021-22 earnings and 15 times those for 2022-23 at the close of trading.
Investors need pertinent information to successfully navigate many investment options in the local stock market. The ICInsider.com PE ratio chart and the more detailed daily report charts provide investors with regularly updated information to help decision-making.
 Investors should use the chart to help make rational investment decisions by investing in stocks close to the average for the sector and not going too far from it unless there are compelling reasons to do so. This approach helps to remove emotions from investment decisions and put in on fundamentals while at the same time not being too far from the majority of investors. Investors who buy when the price of a stock is close to the average will find that they are not inclined to overpay for a stock.
The ICInsider.com PE Ratio chart covers all ordinary shares on the Jamaica Stock Exchange. It shows companies grouped on an industry basis, allowing easy comparisons between the same sector companies and the overall market.
The net asset value of each company is reported as a guide to assess the value of stocks based on this measure quickly. The chart also shows daily changes in stock prices and the percentage year to date price movement based on the last traded prices. 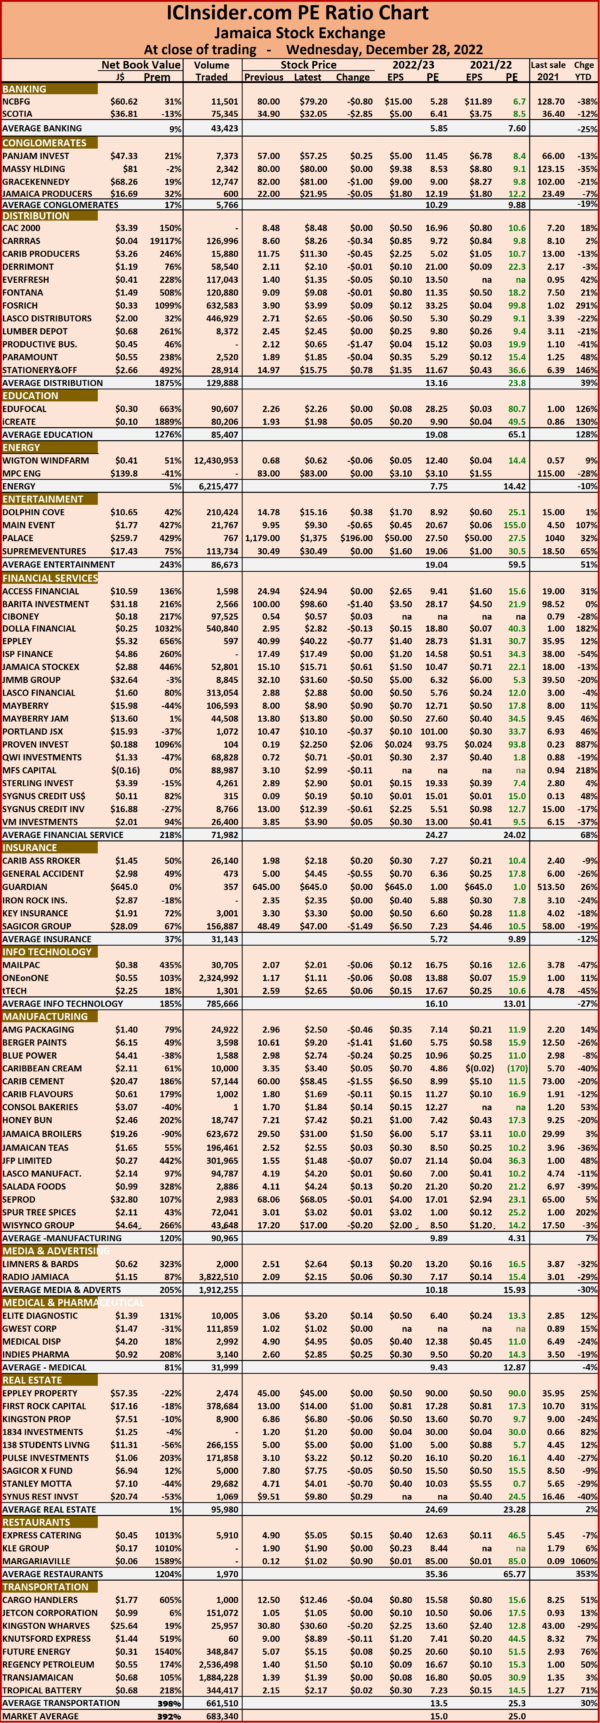 Dividends payable and yields for each company are shown in the Main and Junior Markets’ daily report charts that show the closing volume for the bids and offers.
The EPS & PE ratios are based on 2021 and 2022 actual or projected earnings, excluding major one off items. The PE Ratio is the most popular measure used to determine the value of stocks.


