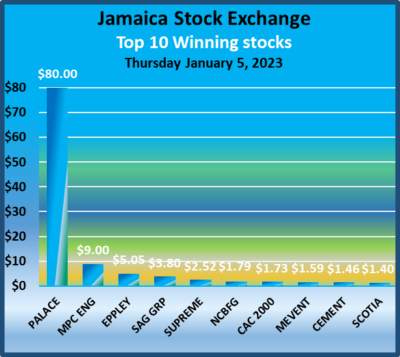
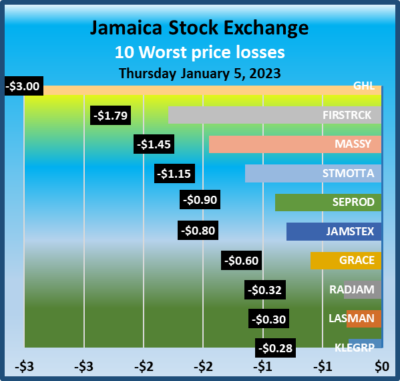
Stocks mostly fell on the JSE Main Market on Thursday, for a second day but vastly less than the significant drop on Wednesday, while the Junior Market recovered some lost grounds suffered over the past two days and the JSE USD market remained flat at the close.
 Trading ended with an exchange of 13,188,780 shares from 18,423,695 units on Wednesday, with a value dropping sharply to just $40 million down from $84.7 million on the previous day. The JSE USD market ended with the value of stocks traded amounting to US$9,508 up from US$3,524 on Wednesday.
At the close, the Combined Market Index fell 1,440.80 points to 358,209.44 the All Jamaican Composite Index dropped 2,146.48 points to 392,484.67, the JSE Main Index shed 1,737.67 points to 345,411.92, the Junior Market index rose 19.61 points to 3,920.85 and the JSE US dollar market closed unchanged at 233.85.
The market’s PE ratio ended at 21.1 based on 2021-22 earnings and 13.2 times those for 2022-23 at the close of trading.
 Investors need pertinent information to successfully navigate many investment options in the local stock market. The ICInsider.com PE ratio chart and the more detailed daily report charts provide investors with regularly updated information to help decision-making.
Investors should use the chart to help make rational investment decisions by investing in stocks close to the average for the sector and not going too far from it unless there are compelling reasons to do so. This approach helps to remove emotions from investment decisions and put in on fundamentals while at the same time not being too far from the majority of investors. Investors who buy when the price of a stock is close to the average will find that they are not inclined to overpay for a stock.
The ICInsider.com PE Ratio chart covers all ordinary shares on the Jamaica Stock Exchange. It shows companies grouped on an industry basis, allowing easy comparisons between the same sector companies and the overall market.
The net asset value of each company is reported as a guide to assess the value of stocks based on this measure quickly. The chart also shows daily changes in stock prices and the percentage year to date price movement based on the last traded prices. 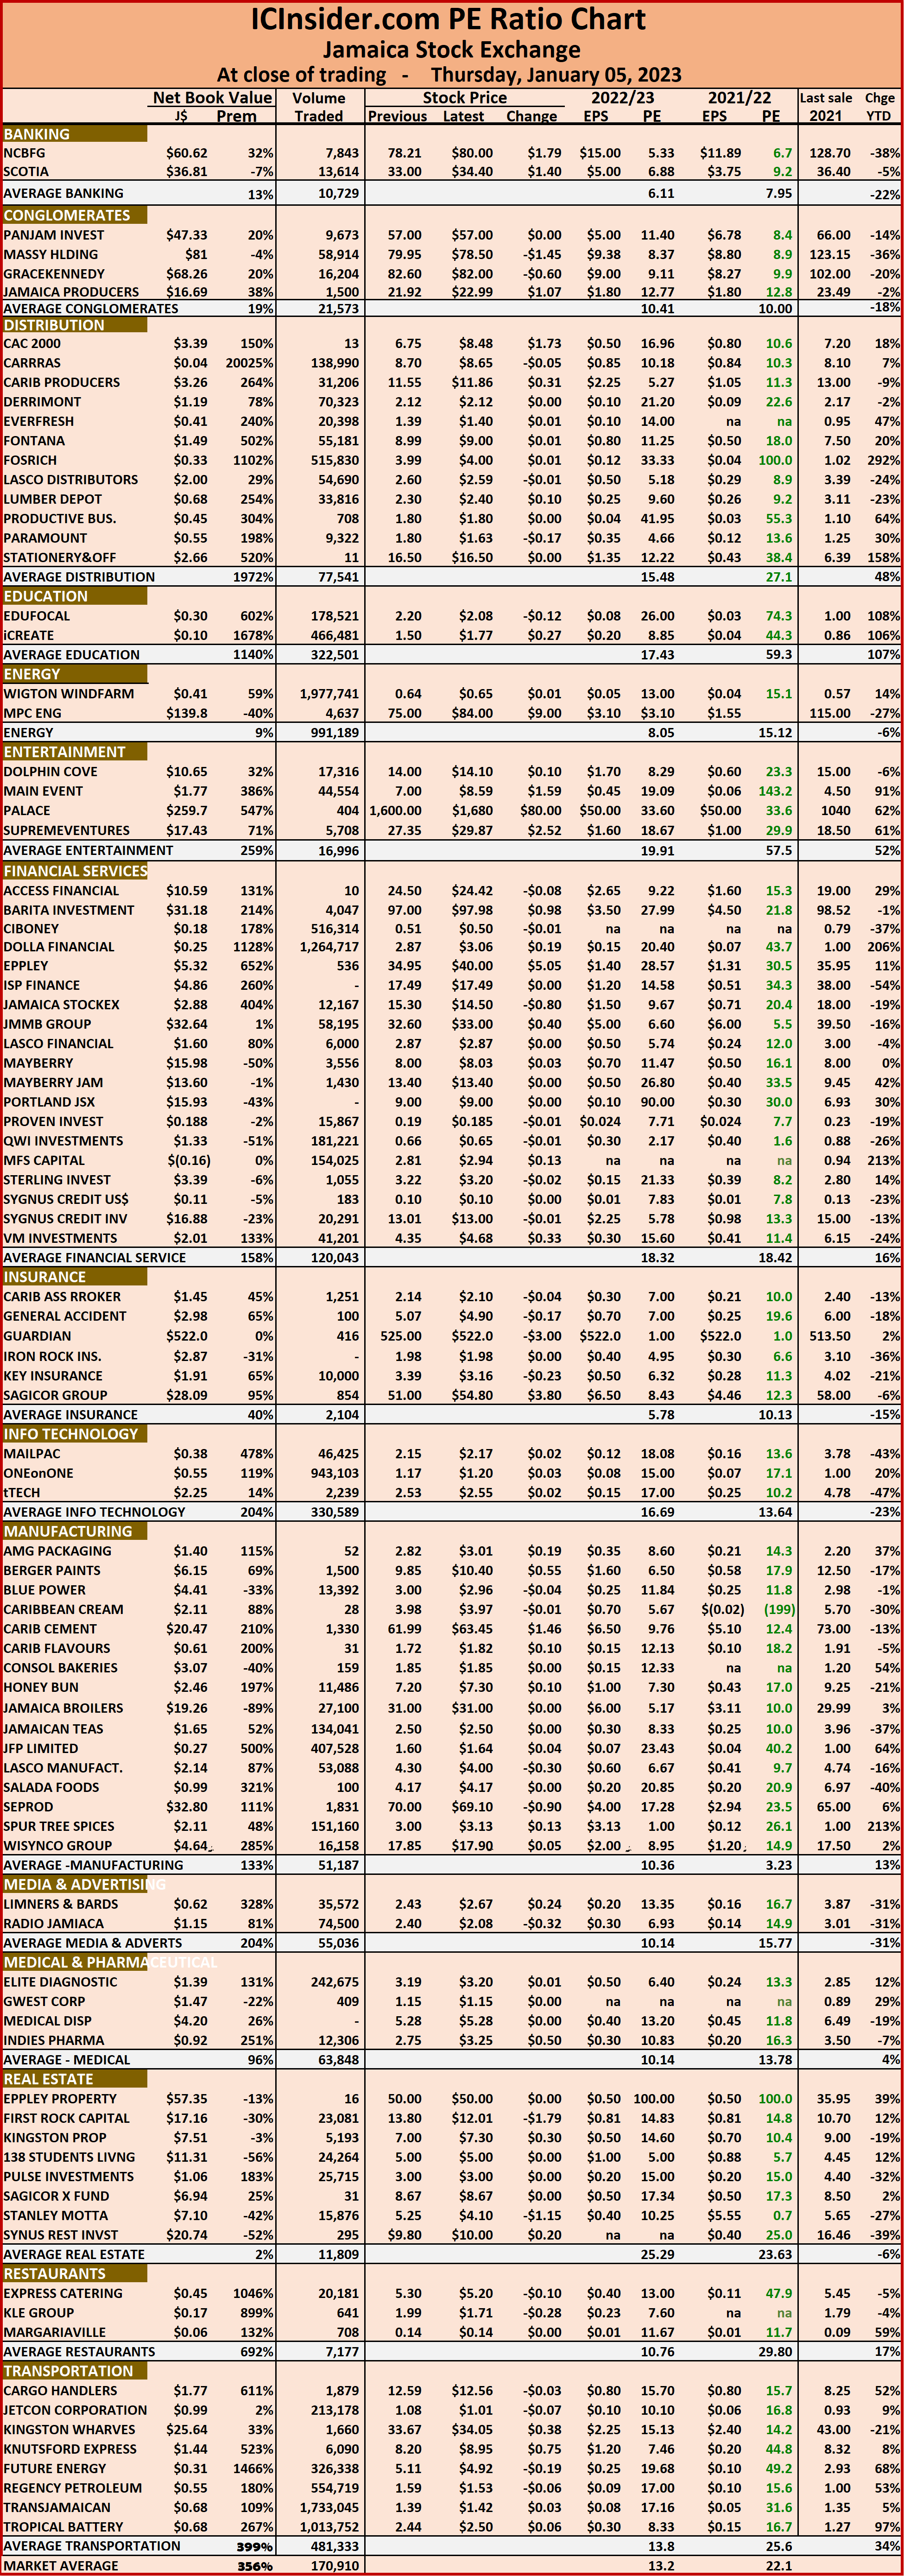 Dividends payable and yields for each company are shown in the Main and Junior Markets’ daily report charts that show the closing volume for the bids and offers.
The EPS & PE ratios are based on 2021 and 2022 actual or projected earnings, excluding major one off items. The PE Ratio is the most popular measure used to determine the value of stocks.


