Trading picked up on the Jamaica Stock Exchange on Friday with the volume and the value of stocks traded climbing above Thursday’s trades and resulting in all three markets of the Jamaica Stock Exchange recording gains in the main indices, but the combined index dipped to close out the week.
 At the close, the JSE Combined Market Index dipped 414.94 points to close at 334,232.98, the All Jamaican Composite Index rose 129.65 points to end at 353,437.71, the JSE Main Index dropped 684.90 points to finish at 320,070.80, the Junior Market Index gained 24.48 points to close trading at 3,887.42, while the JSE USD Market Index rose 9.95 points to 246.53.
There was only one Preference share trading that ended with a notable price change with Productive Business Solutions 10.5 % preference share shedding $100 and ended at $1000.
At the close, investors dealt in 19,541,580 shares in all three markets, up from 10,094,461 stocks on Thursday. The value of stocks traded on the Junior and Main markets ended at $73.3 million, up from $47.9 million on Thursday. Trading on the JSE USD market ended with investors exchanging 595,775 shares for US$31,180 compared with 445,494 units at US$17,444 on Thursday.
 The market’s PE ratio, the most popular measure used to determine the value of stocks ended at 16.9 on 2022-23 earnings and 11.6 times those for 2023-24 at the close of trading. ICInsider.com PE ratio chart and the more detailed daily report charts provide investors with regularly updated information to help decision-making.
The PE ratio chart covers all ordinary shares on the Jamaica Stock Exchange. It shows companies grouped by industry, allowing for easy comparisons between the same sector companies and the overall market. The EPS & PE ratios are based on 2023 and 2024 actual or projected earnings, excluding major one off items.
Investors need pertinent information to successfully navigate numerous investment options in the local stock market. The ICInsider.com PE ratio chart and the more detailed daily report charts provide investors with regularly updated information to help decision-making.
Investors should use the chart to help make rational decisions when investing in stocks close to the average for the sector and not going too far from it unless there are compelling reasons to do so. This approach helps to remove emotions from investment decisions and place them on fundamentals while at the same time not being too far from the majority of investors. Investors who buy when the price of a stock is close to the average will find that they are not inclined to overpay for a stock.
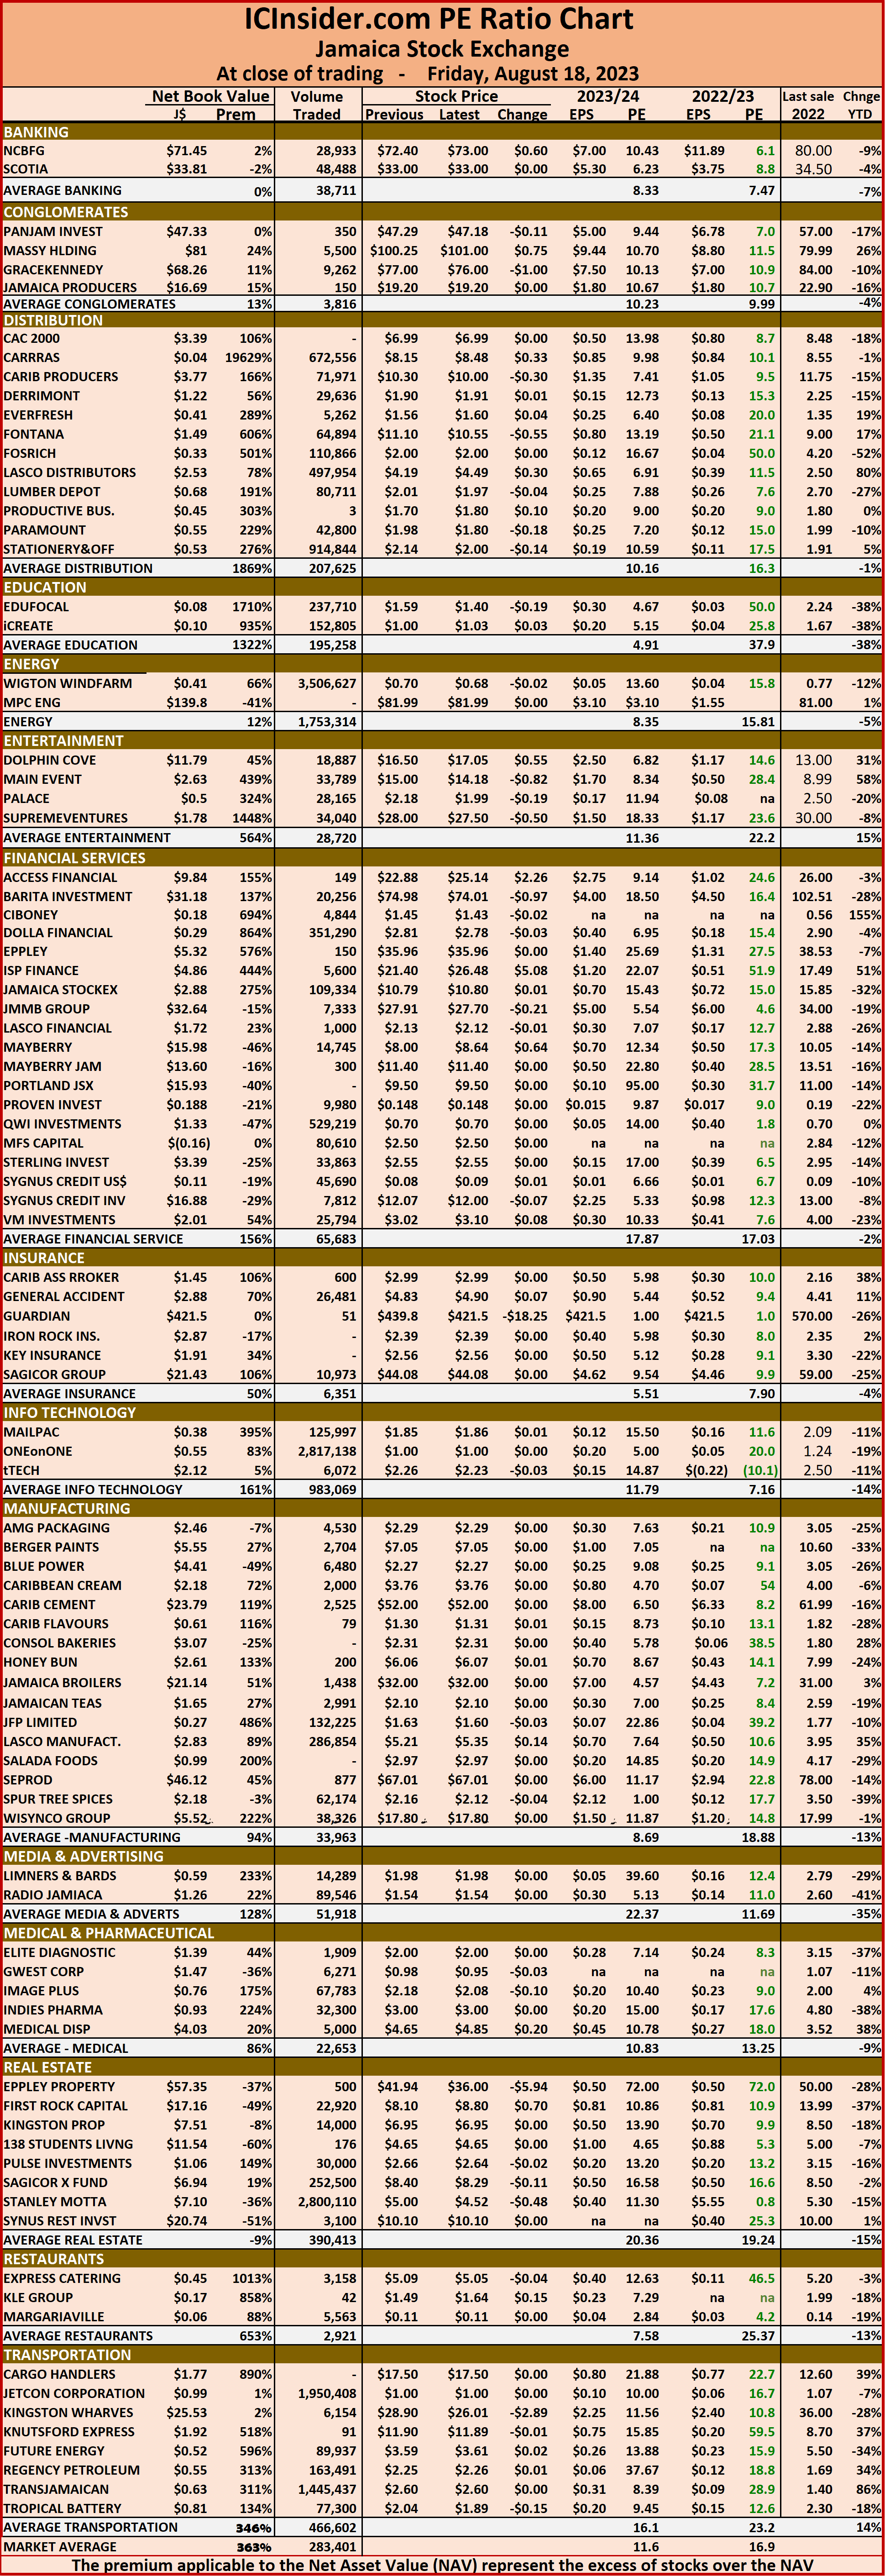 The net asset value of each company is reported as a guide to assess the value of stocks based on this measure quickly. The chart also shows daily changes in stock prices and the percentage year to date price movement based on the last traded prices.
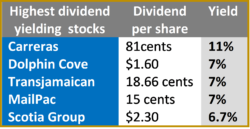
Dividends paid or payable and yields for each company are shown in the Main and Junior Markets’ daily report charts along with the closing volume pertaining to the highest bid and the lowest offer for each company.
 Overall, 445,494 shares were traded for US$17,444, down from 797,307 units at US$115,172 on Wednesday.
 Proven Investments climbed 0.25 of a cent to end at 14.8 US cents in swapping of 60,000 stocks and Transjamaican Highway popped 0.03 of a cent to 1.71 US cents, with 384,261 stocks crossing the exchange.
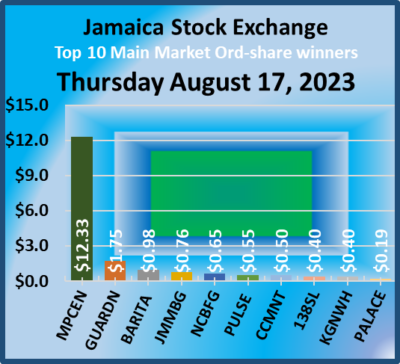 A total of 5,505,100 shares were exchanged for $37,890,404 versus 27,243,669 units at $116,951,925 on Wednesday.
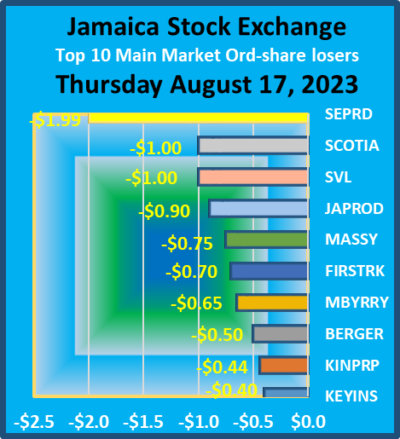 The PE Ratio, a formula used to compute appropriate stock values, averages 13 for the Main Market. The JSE Main and USD Market PE ratios are calculated based on the last traded prices and earnings forecasts by ICInsider.com for companies with the financial year ending up to August 2024.
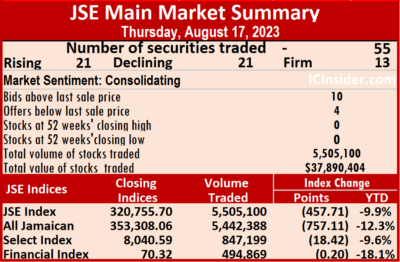 Kingston Properties shed 44 cents in closing at $6.95 as investors traded 14,986 stocks. Kingston Wharves rallied 40 cents to close at $28.90, with 3,673 stock units crossing the market, Massy Holdings dropped 75 cents and ended at $100.25, with 4,035 units clearing the market, Mayberry Investments declined 65 cents to close at $8 after a transfer of 19,470 shares. MPC Caribbean Clean Energy advanced $12.33 in closing at $81.99 with investors trading 1,000 stocks, NCB Financial rose 65 cents to end at $72.40 after 104,630 stocks crossed the exchange, 138 Student Living increased 40 cents to $4.65 in trading 50,330 units, Proven Investments gained 50 cents in closing at $23 in an exchange of 2,211 shares, Pulse Investments advanced 55 cents and ended at $2.66 after traders swapped 132,000 stock units, Scotia Group lost $1 to end at $33 in switching ownership of 53,613 stocks.
 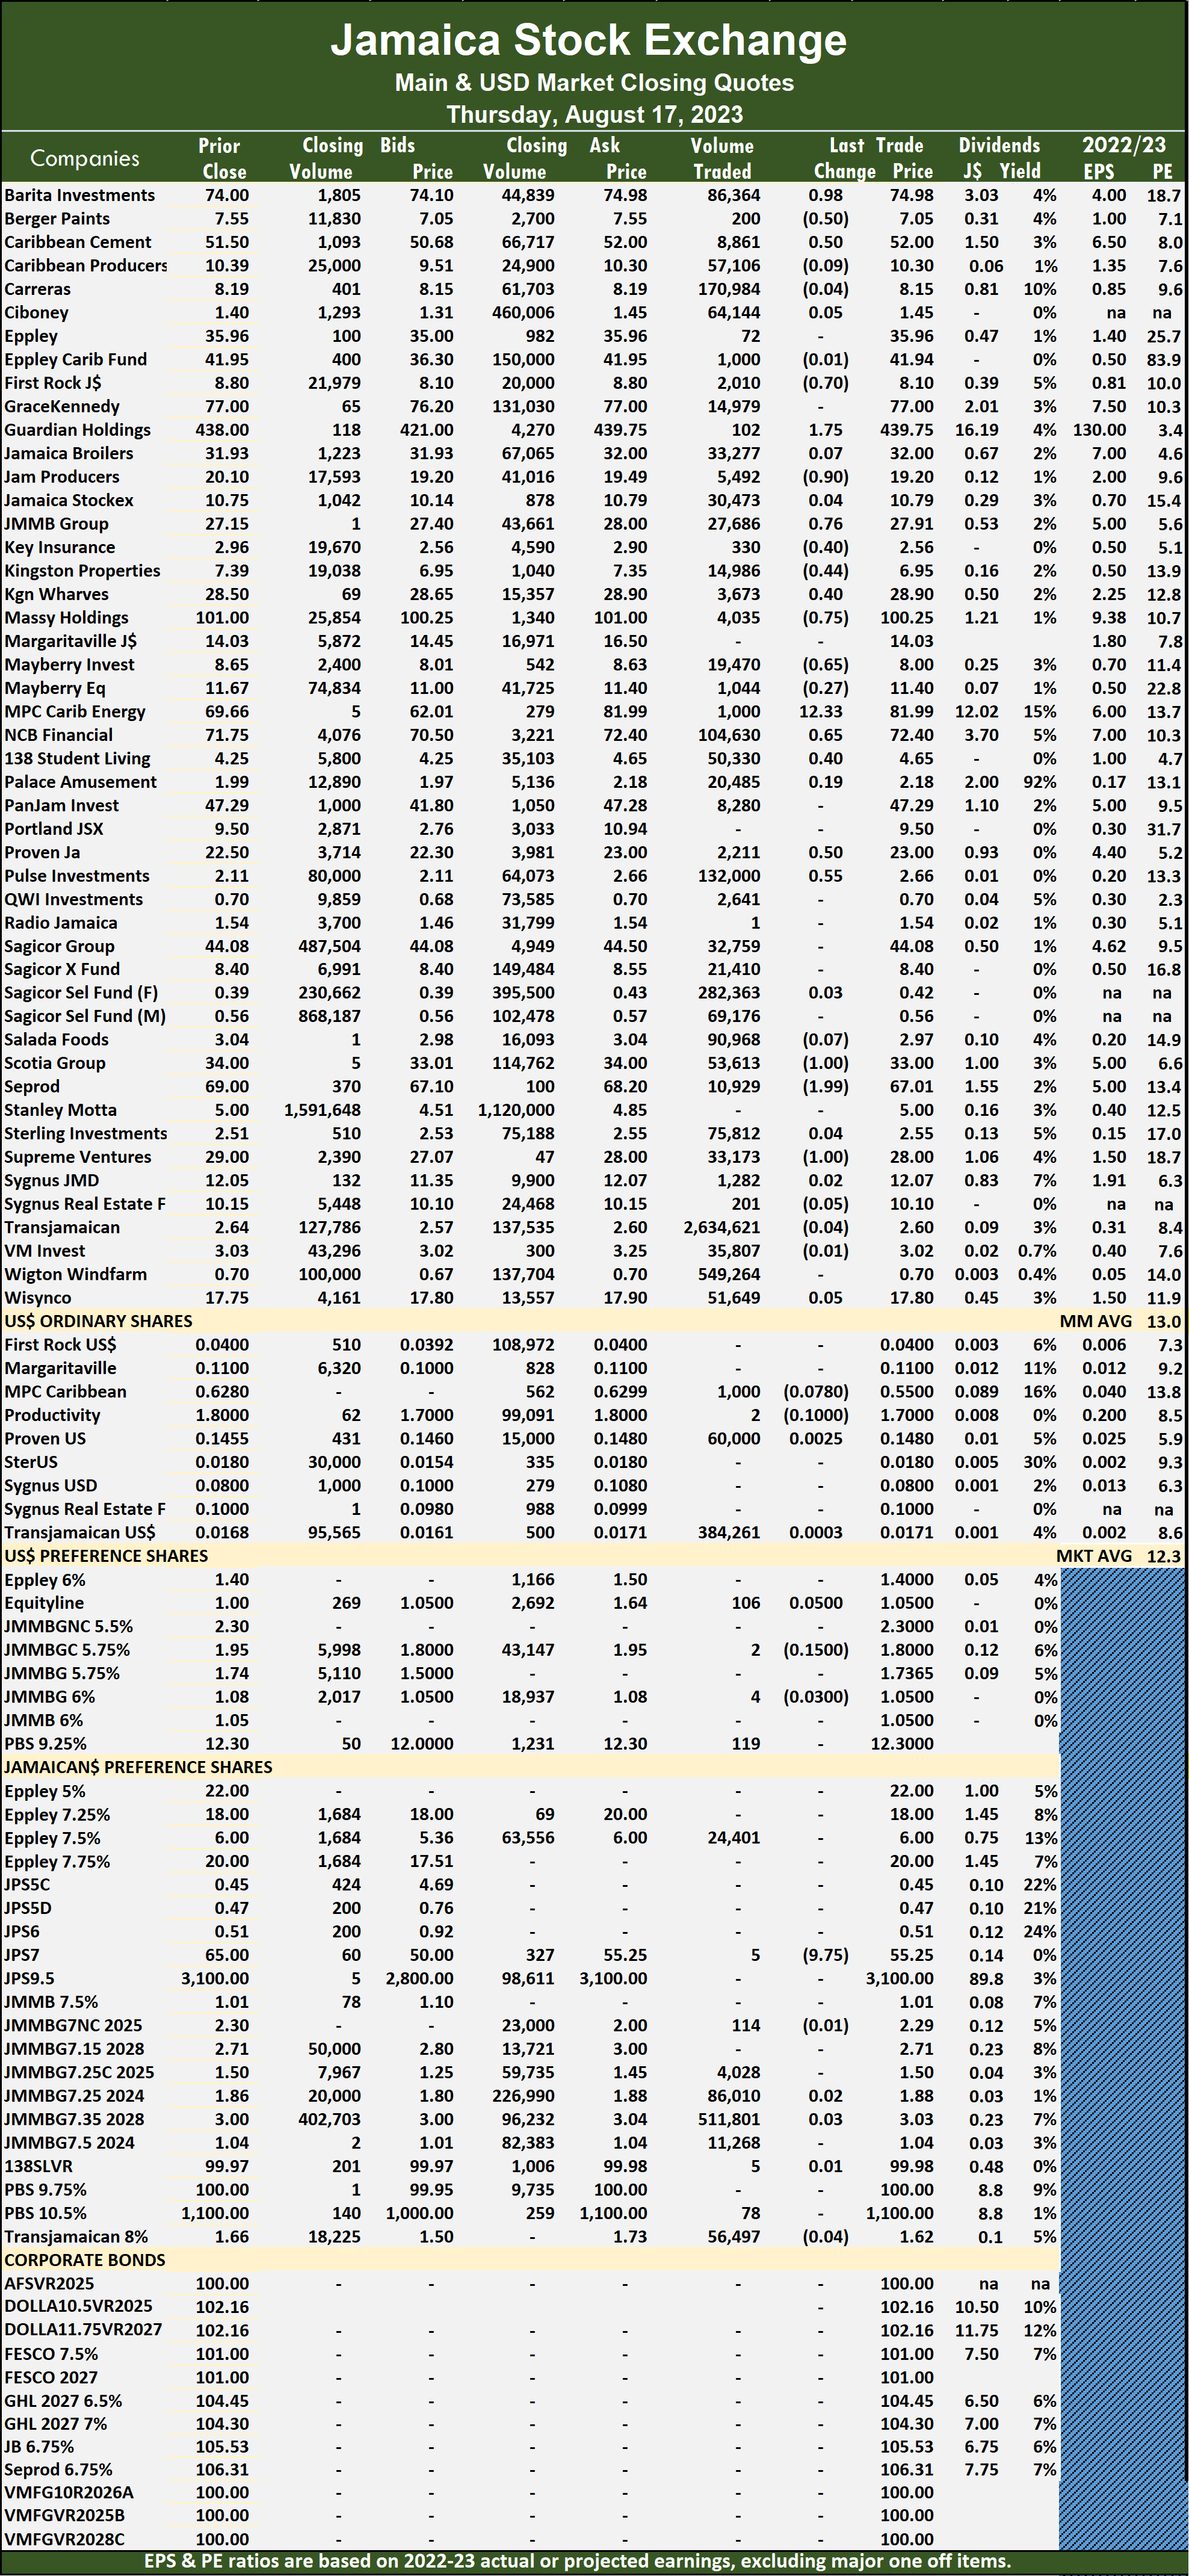 Seprod shed $1.99 to close at $67.01 with an exchange of 10,929 units and Supreme Ventures dropped $1 to $28 with investors transferring 33,173 shares.
 Investors traded a mere 4,143,867 shares for $10,013,554 compared to 15,211,591 units at $44,456,814 on Wednesday.
 The PE ratios of Junior Market are calculated using the last traded price in conjunction with ICInsider.com’s projected earnings for the financial years ending between November 2023 and August 2024.
 Fontana gained 10 cents and ended at $11.10 after trading 23,036 shares. Fosrich shed 8 cents to close at $2 in an exchange of 320,641 units. Future Energy Source dipped 16 cents to end at $3.59, with 1,013,620 stocks crossing the market, General Accident advanced 33 cents to end at $4.83 and closed with an exchange of 5,101 stock units, Honey Bun declined 16 cents to close at $6.06 with a transfer of 8,916 stocks. Iron Rock Insurance popped 29 cents to $2.39 with stakeholders trading one unit, JFP Ltd climbed 11 cents in closing at $1.63 while trading 44,242 stock units, Lasco Distributors rose 9 cents to end at $4.19, with 56,828 shares clearing the market. Lasco Financial rallied 13 cents to $2.13 in an exchange of 125,016 stock units, Limners and Bards gained 17 cents and ended at $1.98, with 240 stocks crossing the exchange, Main Event climbed 61 cents in closing at $15 in traversing the market with 754 shares.
 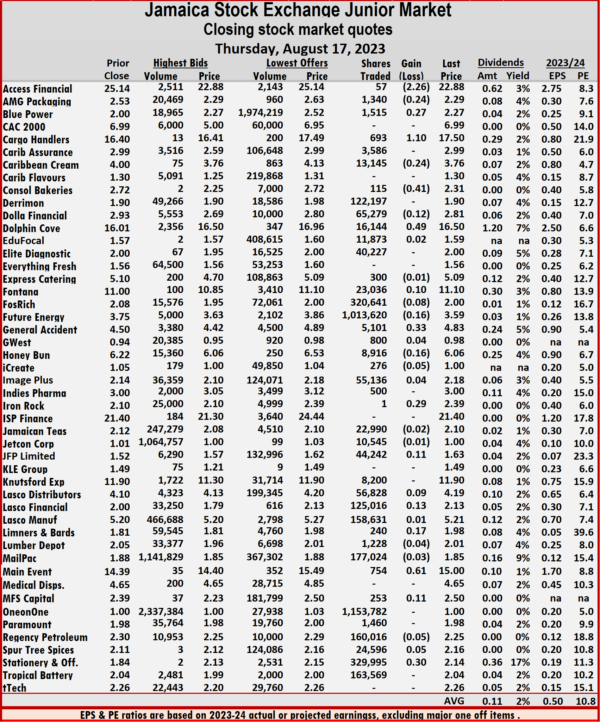 MFS Capital Partners increased 11 cents to close at $2.50, with 253 units changing hands and Stationery and Office Supplies popped 30 cents in closing at $2.14 with an exchange of 329,995 shares.
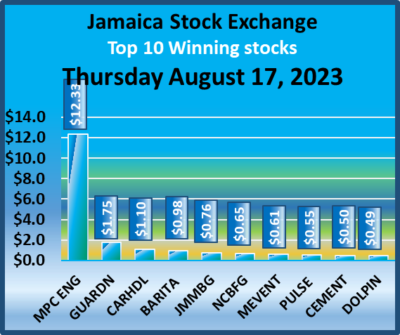 At the close, the JSE Combined Market Index dipped 522.54 points to 334,647.92, the All Jamaican Composite Index dropped 757.11 points to 353,308.06, the JSE Main Index lost 457.71 points to end at 320,755.70, the Junior Market Index fell 10.42 points to finish at 3,862.94, the JSE USD Market Index shed 6.47 points to close at 236.58.
 The market’s PE ratio, the most popular measure used to determine the value of stocks ended at 17.2 on 2022-23 earnings and 11.8 times those for 2023-24 at the close of trading. ICInsider.com PE ratio chart and the more detailed daily report charts provide investors with regularly updated information to help decision-making.
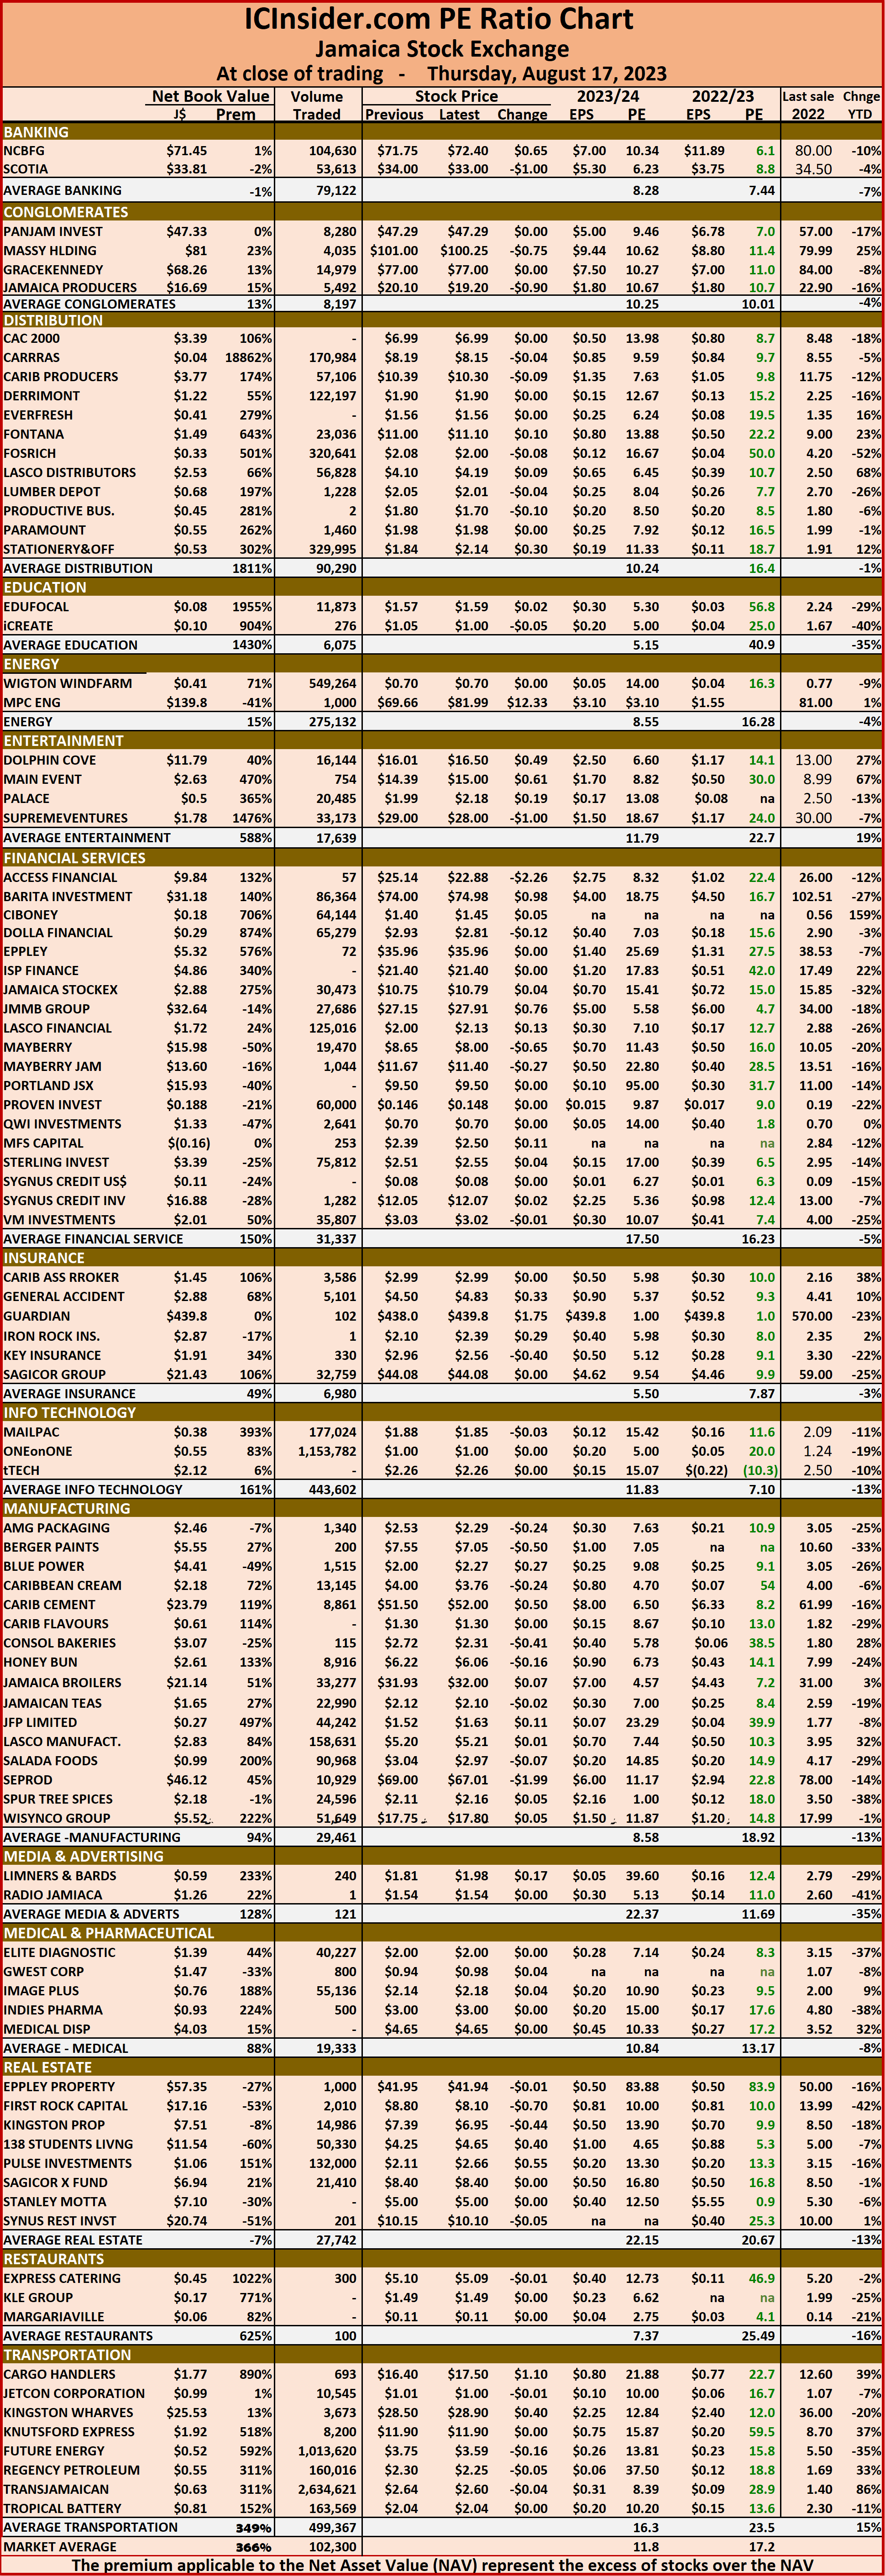 The net asset value of each company is reported as a guide to assess the value of stocks based on this measure quickly. The chart also shows daily changes in stock prices and the percentage year to date price movement based on the last traded prices.
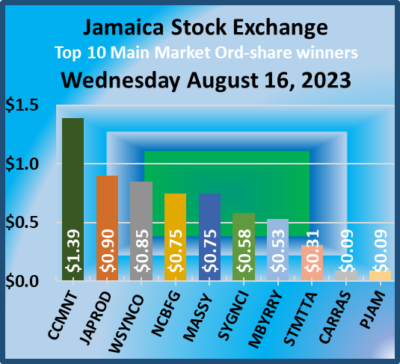 A total of 27,243,669 shares were traded for $116,951,925 compared to 12,623,404 units at $40,299,945 on Tuesday.
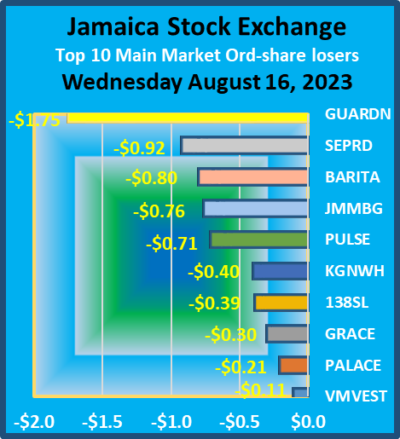 The PE Ratio, a formula used to compute appropriate stock values, averages 12.9 for the Main Market. The JSE Main and USD Market PE ratios are calculated based on the last traded prices and earnings forecasts by ICInsider.com for companies with the financial year ending up to August 2024.
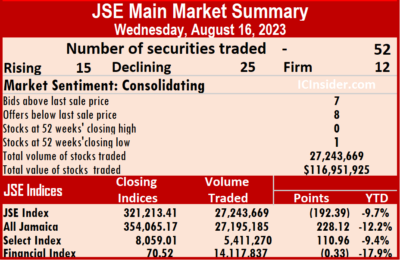 Massy Holdings rallied 75 cents to end at $101, with investors transferring 45,101 units, Mayberry Investments climbed 53 cents to $8.65, with 878 shares crossing the exchange, NCB Financial rose 75 cents to $71.75 after investors traded 23,986 stock units. 138 Student Living lost 39 cents and ended at $4.25 after a transfer of 282 units, Pan Jamaica traded 8,554 shares and rose 9 cents to close at $47.29, but only after hitting an intraday 52 weeks’ low of $40.01, Proven Investments lost 50 cents to close at $22.50 with a transfer of 190 stocks. Pulse Investments shed 71 cents to end at $2.11 while exchanging 24,170 units, Radio Jamaica gained 1 cent to close at $1.54 after hitting an intraday low of $1.40 in trading 101,142 shares, Seprod dipped 92 cents to close at $69 with stakeholders trading 7,423 stocks.
 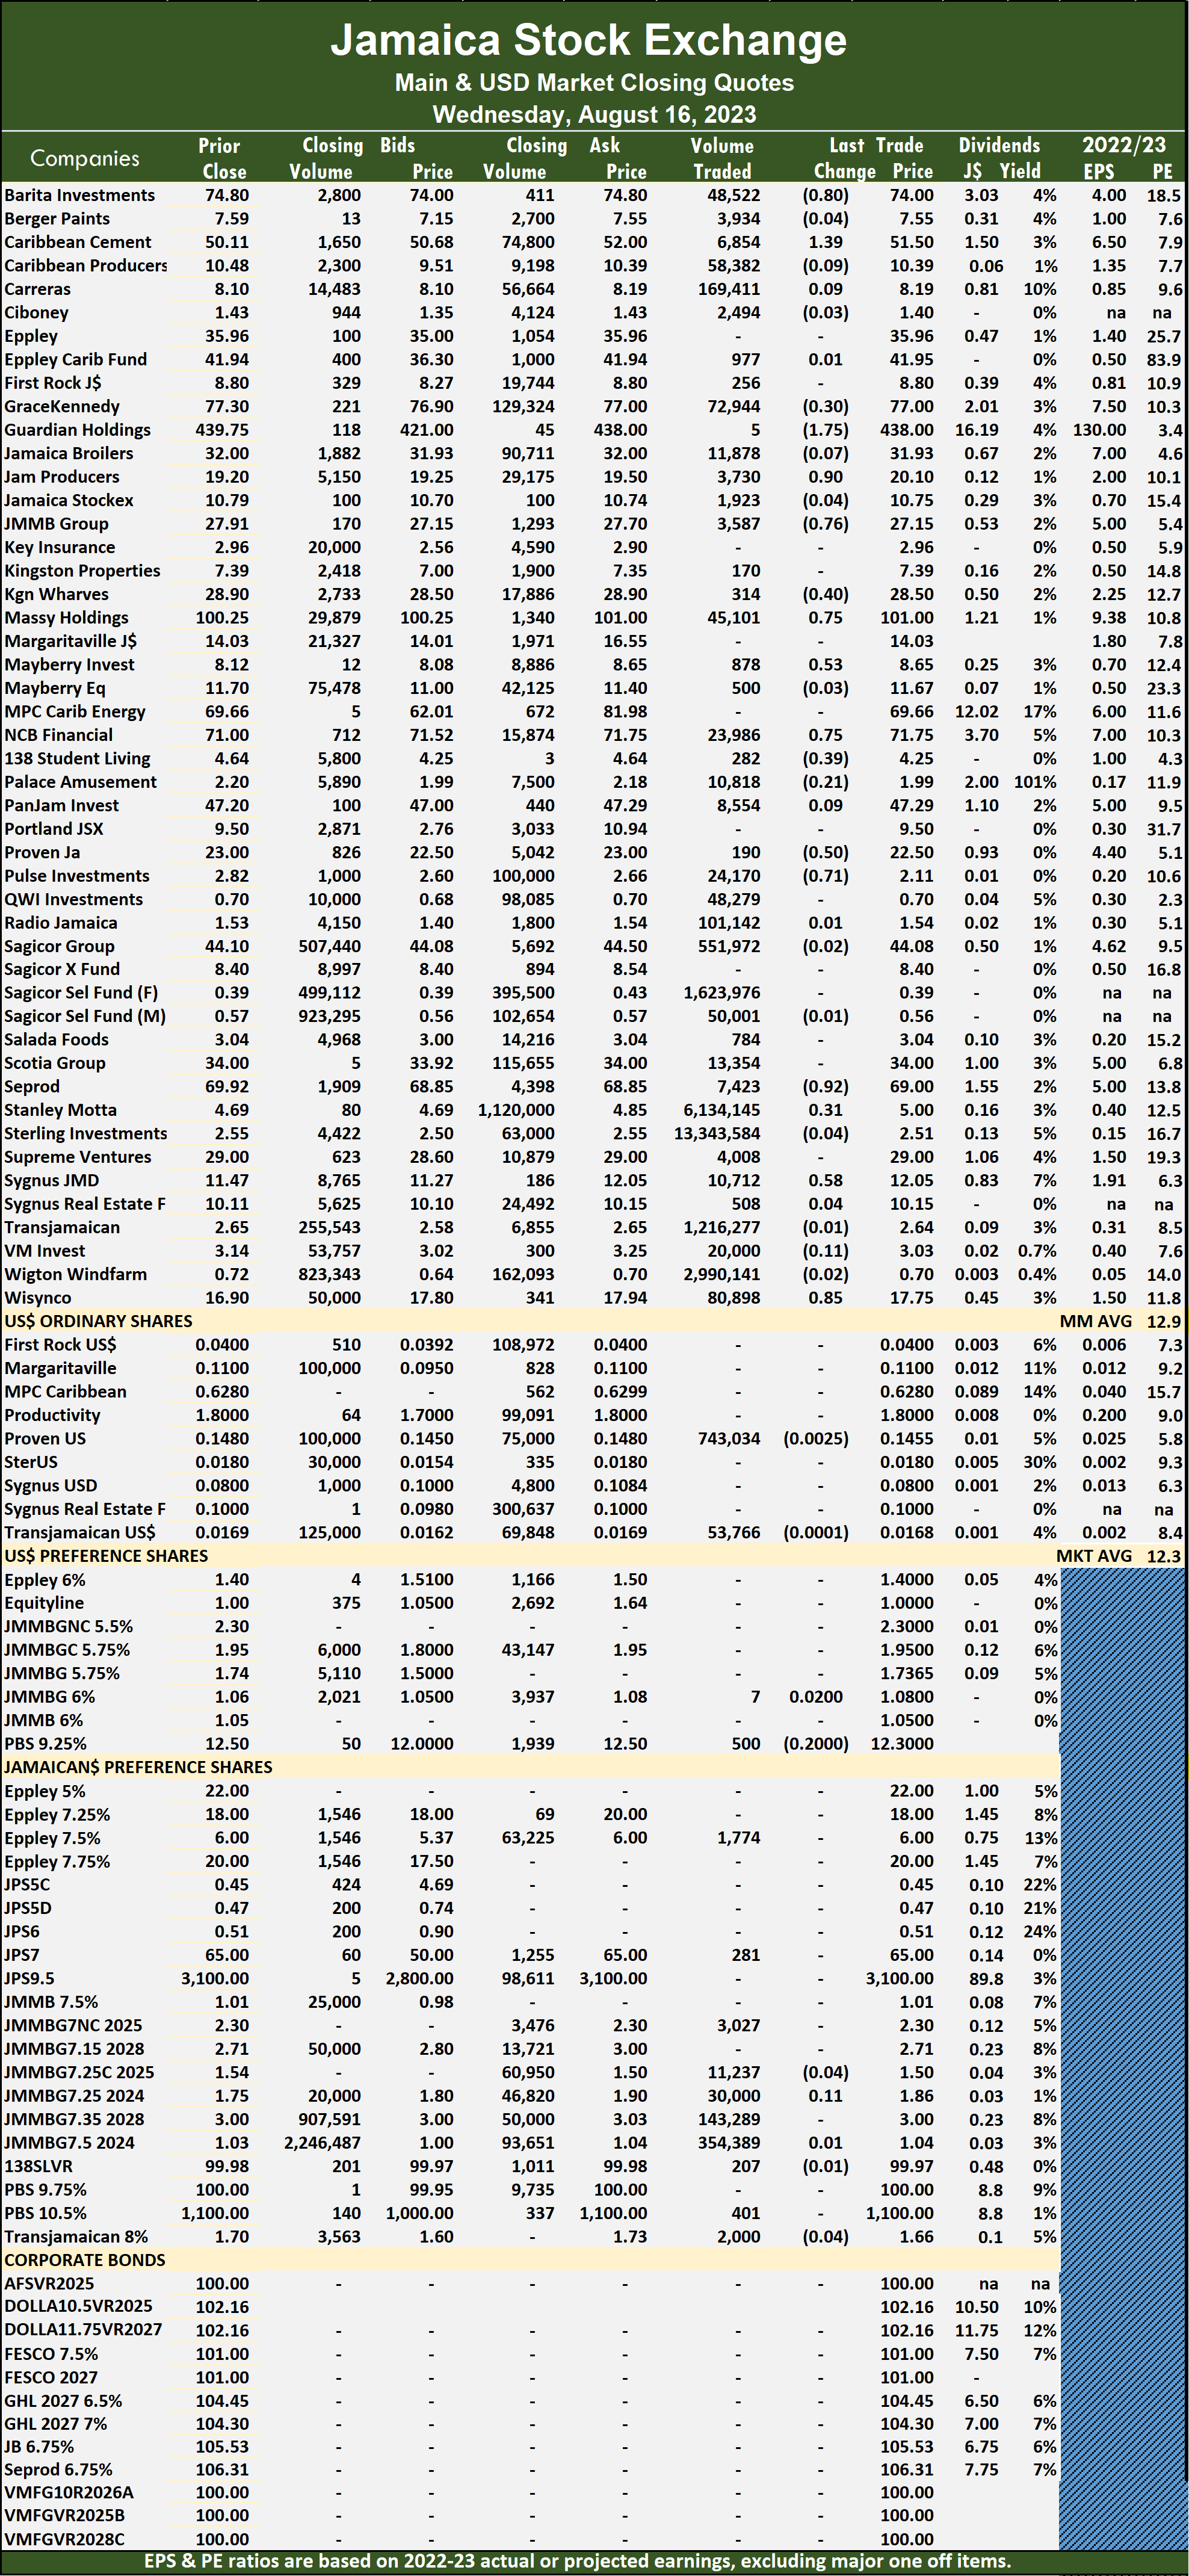 Stanley Motta advanced 31 cents to $5 in an exchange of 6,134,145 shares. Sygnus Credit Investments increased 58 cents to end at $12.05 in switching ownership of 10,712 stock units and Wisynco Group climbed 85 cents to $17.75 in an exchange of 80,898 stocks.
 shares of Lasco Manufacturing, following trading in 42 securities versus 44 on Tuesday and ending with prices of 15 rising, 20 declining and seven closing unchanged.
 Dolla Financial chipped in with 2.88 million units for 18.9 percent market share, ONE on ONE Educational ended with 1.77 million units for 11.7 percent of the market volume and Stationery and Office Supplies with 1.53 million units for 10.1 percent of total volume.
 Dolla Financial gained 23 cents in closing at $2.93 following switching ownership of 2,881,799 shares, EduFocal rose 17 cents to end at $1.57 with an exchange of 3,084,681 stocks, Express Catering rallied 60 cents to end at $5.10 after a transfer of 800 stock units. Fosrich gained 8 cents to end at $2.08, with 97,890 shares crossing the market, Future Energy Source lost 12 cents and ended at $3.75 after an exchange of 247,772 units, Image Plus Consultants dipped 14 cents in closing at $2.14, with 24,527 stock units crossing the exchange. JFP Ltd declined 11 cents to close at $1.52 while traders were exchanging 437,963 stocks, Lasco Financial dropped 15 cents to close at a 52 weeks’ low of $2 after hitting an intraday low of $1.50 in trading 22,140 units,
 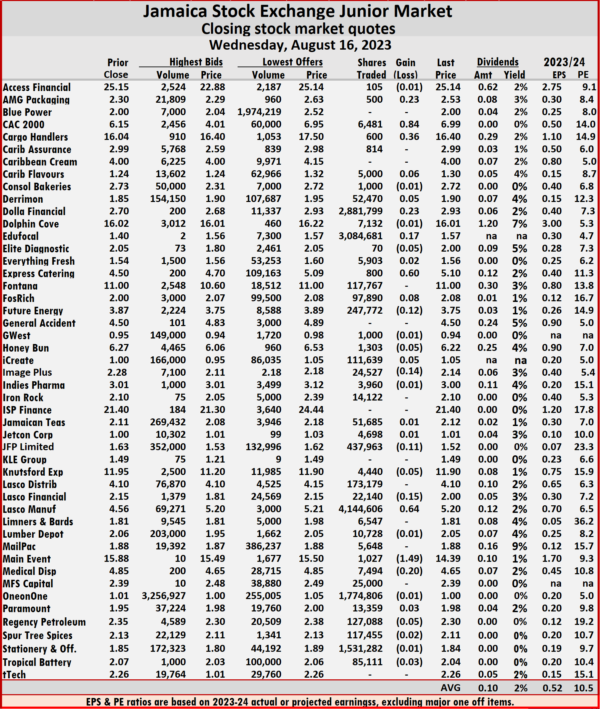 Lasco Manufacturing climbed 64 cents and ended at $5.20 after an exchange of 4,144,606 shares, Main Event shed $1.49 to end at $14.39, with investors transferring 1,027 units and Medical Disposables fell 20 cents to $4.65, with 7,494 stock units clearing the market.
 A total of 797,307 shares were exchanged for US$115,172 compared with 610,587 units at US$16,053 on Tuesday.
 Transjamaican Highway dipped 0.01 of a cent to 1.68 US cents, with 53,766 units passing through the exchange.
 At the close, the JSE Combined Market Index popped 692.51 points to close at 335,170.47, the All Jamaican Composite Index advanced 228.12 points to end at 354,065.17, the JSE Main Index dipped 192.39 points to finish at 321,213.41, the Junior Market Index surged 95.27 points to finish at 3,873.37, while the JSE USD Market Index slipped 2.64 points to close at 243.05.
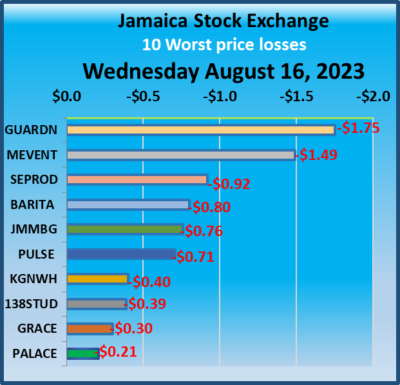 The market’s PE ratio, the most popular measure used to determine the value of stocks ended at 17.3 on 2022-23 earnings and 11.6 times those for 2023-24 at the close of trading. ICInsider.com PE ratio chart and the more detailed daily report charts provide investors with regularly updated information to help decision-making.
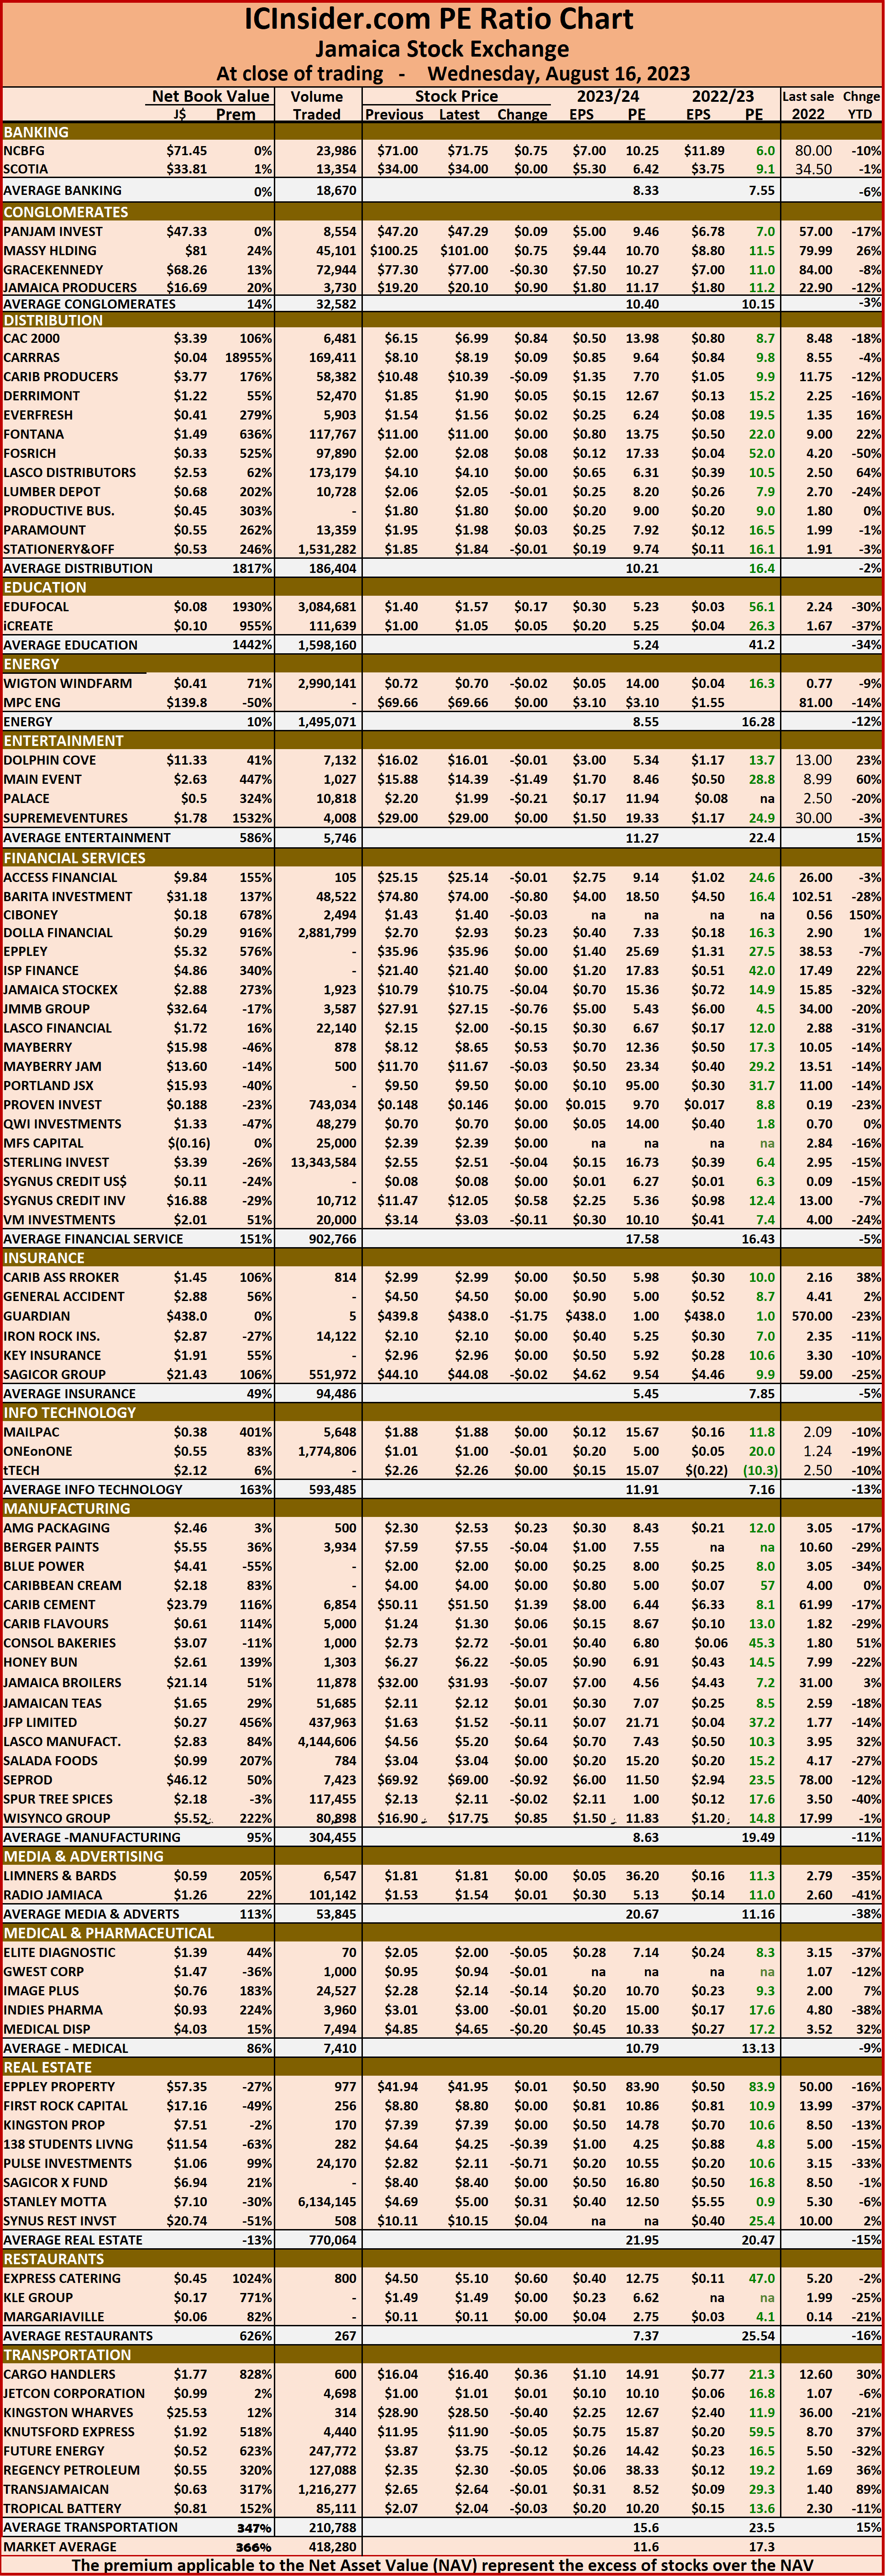 The net asset value of each company is reported as a guide to assess the value of stocks based on this measure quickly. The chart also shows daily changes in stock prices and the percentage year to date price movement based on the last traded prices.
 Overall, 610,587 shares were traded for US$16,053 compared with 155,440 units at US$5,637 on Monday.
 Productive Business Solutions ended at US$1.80 after traders exchanged 6 units, Proven Investments ended at 14.8 US cents, with 1,076 stocks changing hands, Sterling Investments lost 0.18 of a cent in closing at 1.8 US cents as investors exchanged 109 stock units. Sygnus Credit Investments shed 1.5 cents in closing at 8 US cents with shareholders swapping 61,993 shares, Sygnus Real Estate Finance USD share ended at 10 US cents after switching ownership of 10 units and Transjamaican Highway gained 0.09 of a cent to close at 1.69 US cents in an exchange of 546,676 stocks.