The Main and Junior Market slipped at the close of trading but the JSE USD market inched higher on Wednesday on the Jamaica Stock Exchange to close out August, with losses to the market indices, with the markets closing lower for the month after trading ended with a bump in the volume of stocks trading that more than doubled Tuesday’s trades, with the value rising to more than $1 billion dollars.
 At the close of the market, the JSE Combined Index, a measure of the overall market, declined 462.81 points to 373,425.00, the All Jamaican Composite Index popped 146.95 points to 408,382.25, the JSE Main Index dipped 474.78 points to 359,294.69, the Junior Market Index slipped 2.10 points to 4,168.05 and the JSE USD Market Index rose 1.80 points to 205.56.
Trading ended with 96,932,851 shares changing hands with the value at $1.11 billion, compared to $192.76 million, with 41,625,695 shares traded in the overall market on Tuesday. The JSE USD market ended with the value of stocks traded at US$6,401 and US$41,599 on the previous trading day.
The market’s PE ratio ended at 23.3 based on 2021-22 earnings and 12.8 times those for 2022-23 at the close of trading.
Investors need pertinent information to successfully navigate many investment options in the local stock market. The ICInsider.com PE ratio chart and the more detailed daily report charts provide investors with regularly updated information to help decision-making.
Investors should use the chart to help make rational investment decisions by investing in stocks close to the average for the sector and not going too far from it unless there are compelling reasons to do so. This approach helps to remove emotions from investment decisions and put in on fundamentals while at the same time not being too far from the majority of investors. Investors who buy when the price of a stock is close to the average will find that they are not inclined to overpay for a stock.
The ICInsider.com PE Ratio chart covers all ordinary shares on the Jamaica Stock Exchange. It shows companies grouped on an industry basis, allowing easy comparisons between the same sector companies and the overall market.
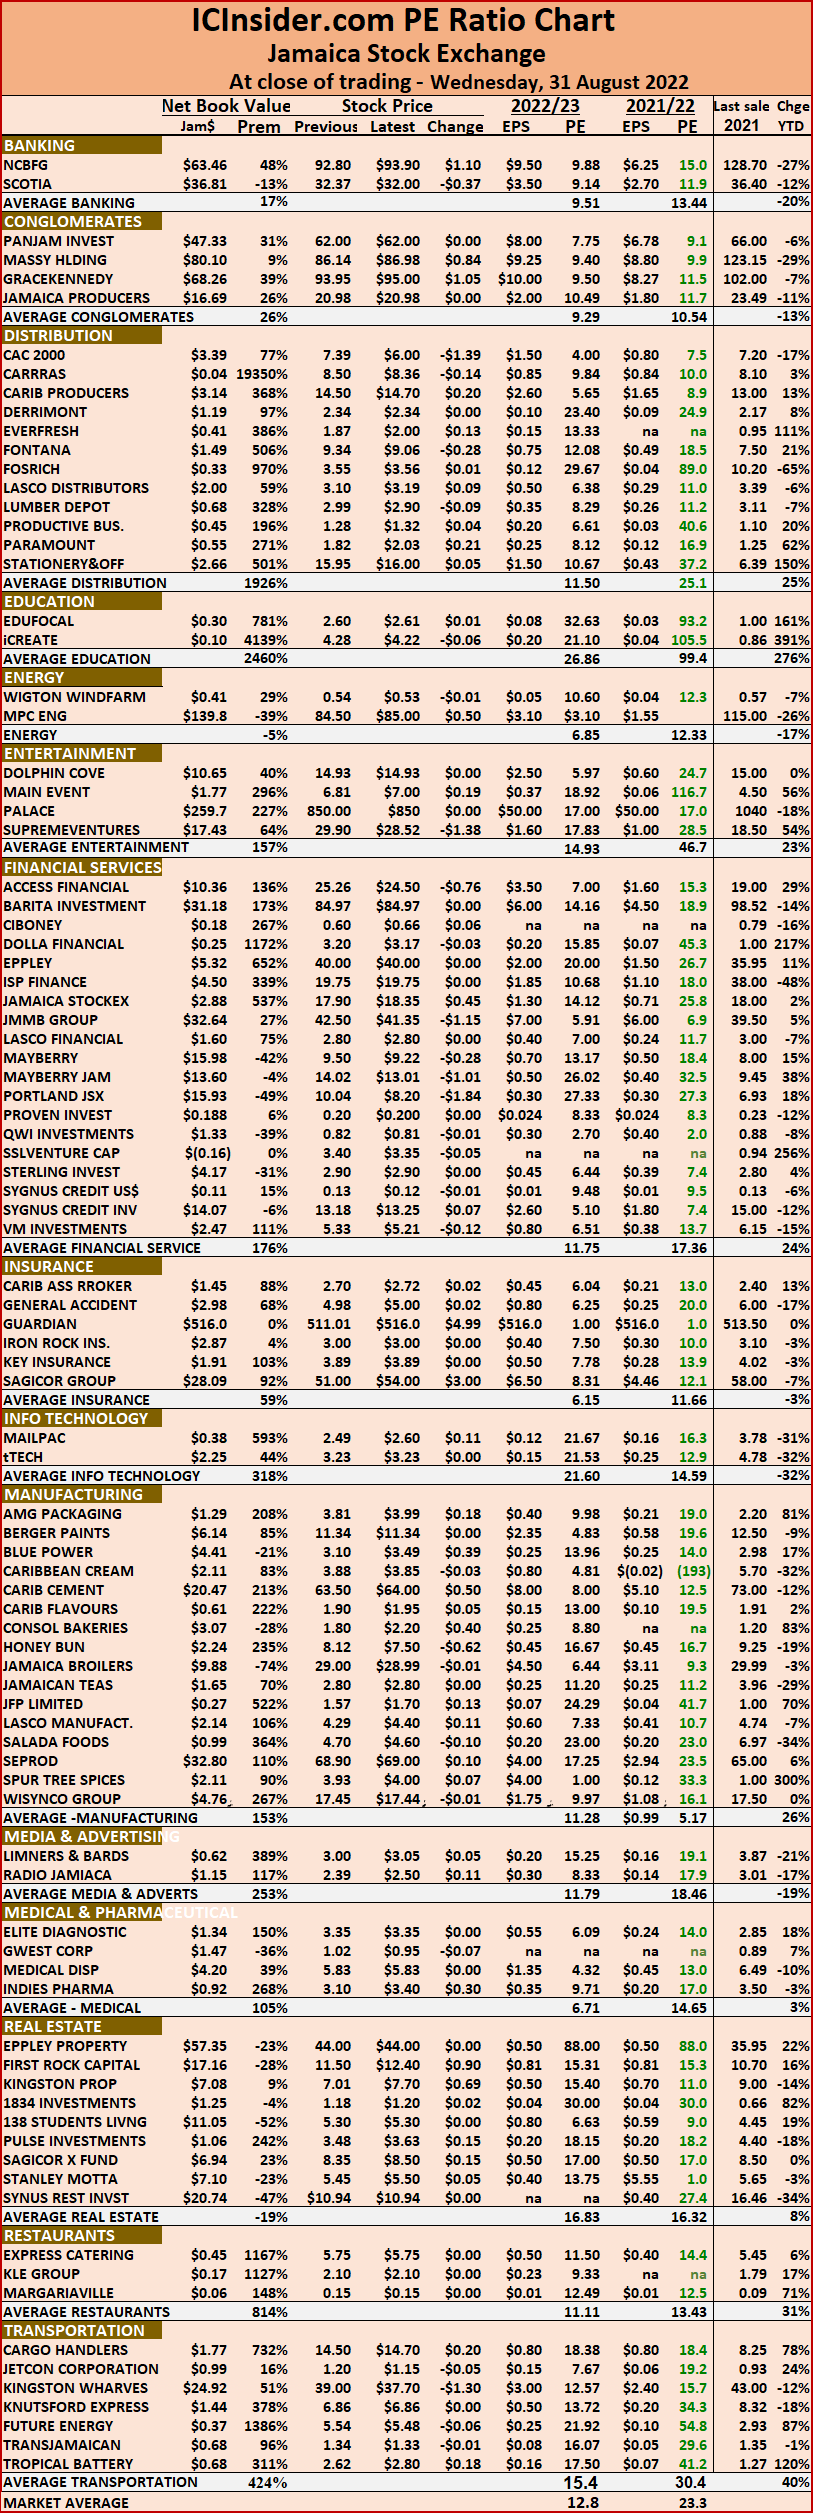 The net asset value of each company is reported as a guide to assess the value of stocks based on this measure quickly. The chart also shows daily changes in stock prices and the percentage year to date price movement based on the last traded prices. Dividends payable and yields for each company are shown in the Main and Junior Markets’ daily report charts that show the closing volume for the bids and offers.
The EPS & PE ratios are based on 2021 and 2022 actual or projected earnings, excluding major one off items. The PE Ratio is the most popular measure used to determine the value of stocks.
 The final numbers include results of Guardian Holdings, and Massy Holdings, two companies with primary listings in Trinidad and Tobago, and the recently listed Dolla Financial. Excluding results for the two Trinidadian based companies, profit rose 39 percent for the rest, from a 27 percent rise in revenues, the data reveal.
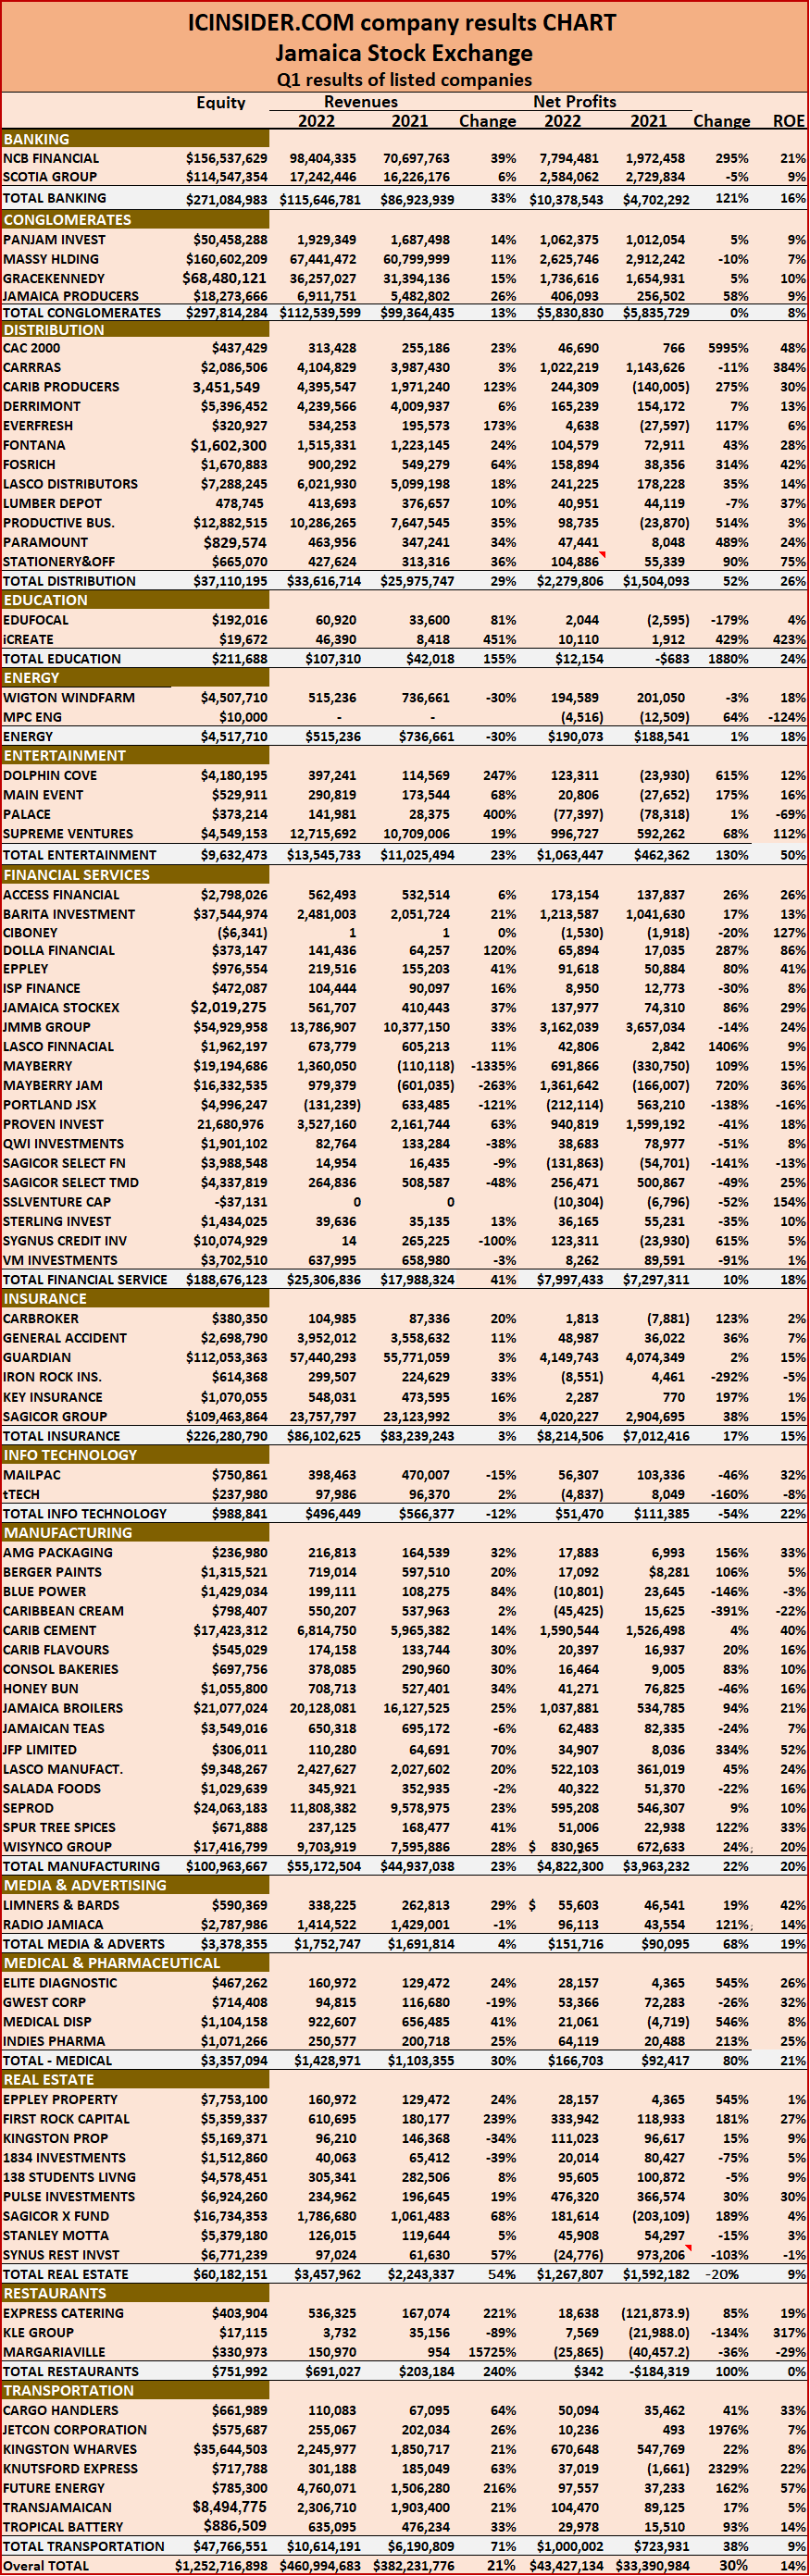 Jamaica Producers’ revenues rose 26 percent to $6.9 billion. Profit jumped 58 percent to $406 million, with second quarter revenues exceeding that of the first quarter and increasing 26 percent over 2021 second quarter to $7.5 billion, with profit rising 30 percent to $458 million as associated companies delivered a significant increase in profit of $191 million versus just $48 million in 2021.

 At the close of trading, the All Jamaican Composite Index rose 528.75 points to 408,235.30, the JSE Main Index rallied 622.71 points to 359,769.47 and the JSE Financial Index shed 0.04 points to settle at 85.52.
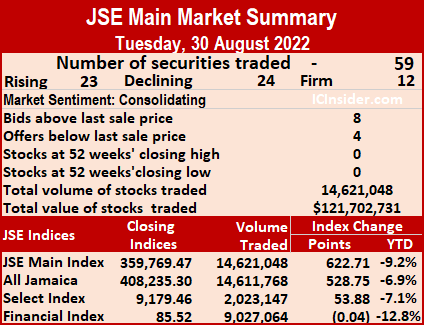 At the close, Berger Paints popped 83 cents to end at $11.34 after 197 shares crossed the exchange, Caribbean Cement rallied $3.50 in closing at $63.50 and trading 32,302 units, Eppley Caribbean Property Fund rose $3.98 to $44 as investors exchanged six stock units. First Rock Real Estate fell 96 cents to $11.50 in trading 38,046 stocks, GraceKennedy advanced 55 cents to $93.95 in switching ownership of 37,033 stock units, Jamaica Stock Exchange gained $1.80 to end at $17.90 with a transfer of 52,975 shares. JMMB Group increased $1.51 in closing at $42.50 with 171,890 stocks clearing the market, Massy Holdings climbed 64 cents to $86.14 with investors transferring 6,785 units, Mayberry Investments increased 38 cents to $9.50 with an exchange of 6,554,435 shares. MPC Caribbean Clean Energy climbed $16.50 to close at $84.50 in exchanging 2,489 stocks, 138 Student Living dipped $1.20 to $5.30 while exchanging 961,825 units, Palace Amusement advanced $139 to end at $850 after trading one stock unit. PanJam Investment gained $2.99 in ending at $62 after a transfer of 576 stock units, Portland JSX rallied $1.04 to close at $10.04 after exchanging 134 units,
 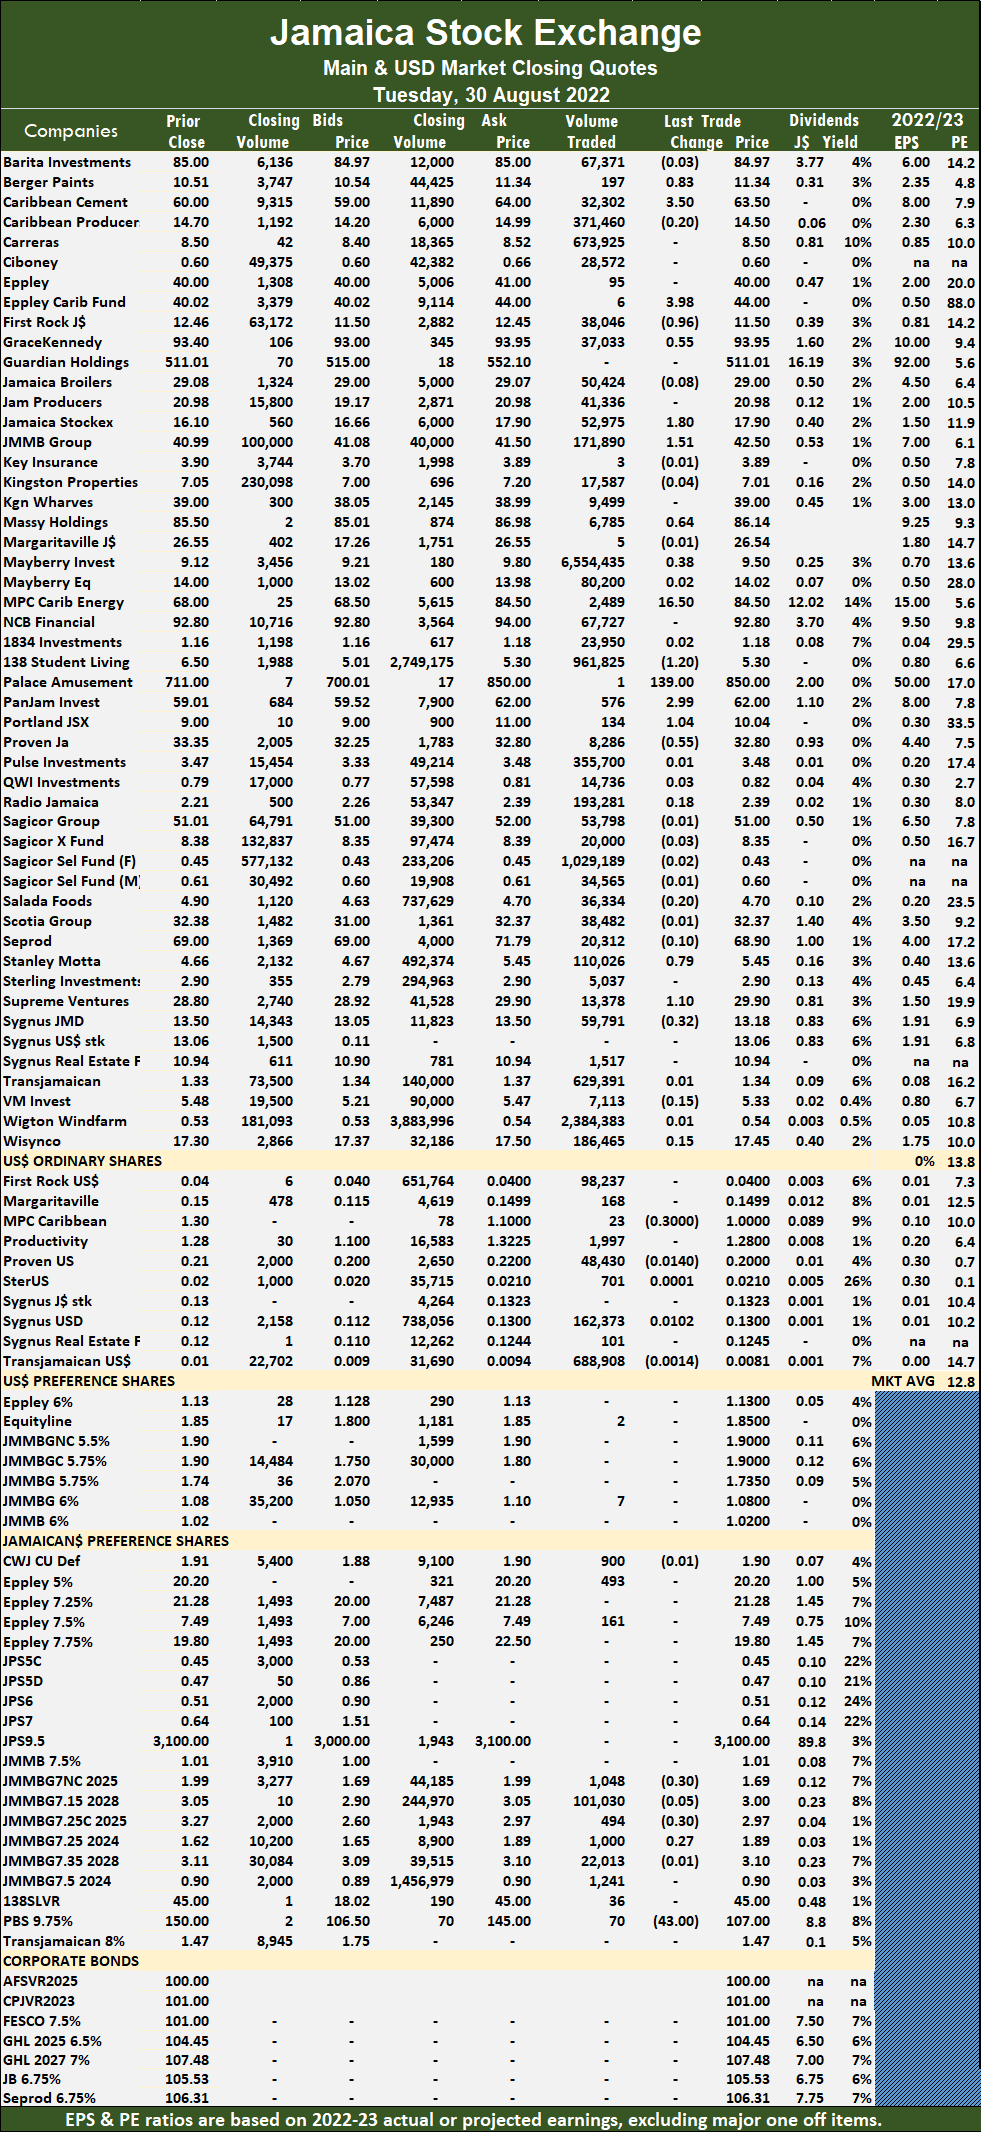 Proven Investments declined 55 cents in closing at $32.80, with 8,286 stocks changing hands. Stanley Motta popped 79 cents in closing at $5.45, with 110,026 shares crossing the market and Supreme Ventures rose $1.10 to close at $29.90 in an exchange of 13,378 stocks.
 Overall, 1,000,947 shares were traded for US$41,599, up from 57,945 units at US$9,558 on Monday. Trading averaged 90,995 units at US$3,782, versus 4,139 shares at US$683 on Monday, with a month to date average of 53,049 shares at US$7,517 versus 50,781 units at US$7,740 on the previous trading day. July ended with an average of 49,665 units for US$3,449.
 Proven Investments lost 1.4 cents to end at 20 US cents after exchanging 48,430 shares, Sterling Investments rallied 0.01 of a cent to 2.1 US cents in switching ownership of 701 stock units. Sygnus Credit InvestmentsUSD share increased 1.02 cents in closing at 13 US cents, with 162,373 units clearing the market, Sygnus Real Estate Finance USD share ended at 12.45 US cents, with 101 stocks changing hands, Transjamaican Highway dipped 0.14 of a cent to end at 0.81 of one US cent in trading 688,908 stocks.
 A total of 26,003,630 shares were exchanged for $71,056,138 up from 10,844,740 units at $34,617,754 on Monday. Trading averaged 590,992 shares at $1,614,912 compared to 240,994 shares at $769,283 on Monday, with the month to date, averaging 363,535 units at $1,202,929 compared to 351,870 units at $1,181,801 on the previous trading day. July closed with an average of 512,709 units at $2,574,304.
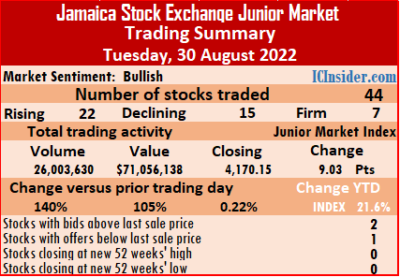 At the close,
 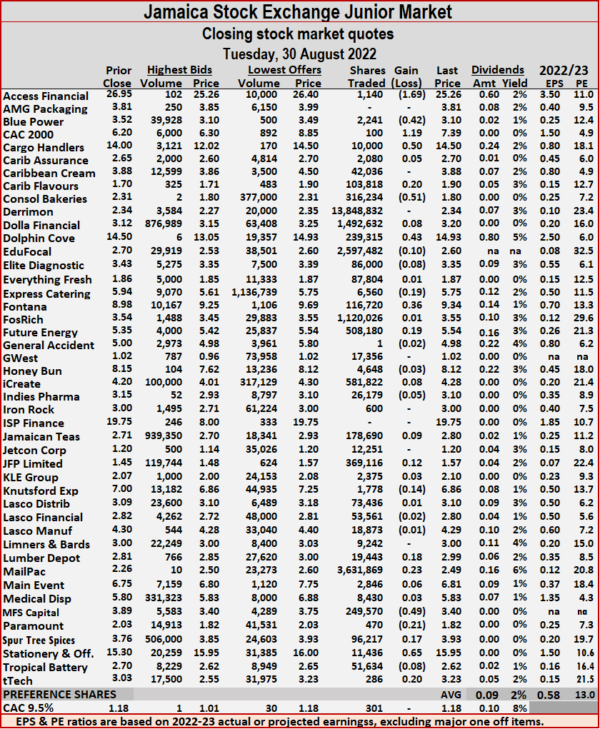 MFS Capital Partners dipped 49 cents to $3.40 with 249,570 stock units changing hands,
  The ICInsider.com PE Ratio chart covers all ordinary shares on the Jamaica Stock Exchange. It shows companies grouped on an industry basis, allowing easy comparisons between the same sector companies and the overall market.
 Investors exchanged 57,945 shares for US$9,558 compared to 117,261 units atUS$13,332 on Friday. Trading averaged 4,139 units at US$683, versus 13,029 shares at US$1,481 on Friday, with a month to date average of 50,781 shares at US$7,740 down from 54,622 units at US$8,321 on the previous trading day. July ended with an average of 49,665 units for US$3,449.
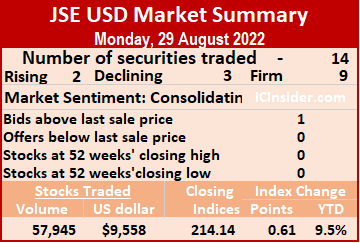 Proven Investments remained at 21.4 US cents, with 581 shares changing hands, Sterling Investments ended at 2.09 US cents after a transfer of 3,320 stocks. Sygnus Credit Investments USD share rallied 0.01 of a cent to 11.98 US cents with the swapping of 7,067 stock units, Sygnus Credit Investments Ja$ share remained at 13.23 US cents after trading 174 units, Sygnus Real Estate Finance USD share remained at 12.45 US cents after trading 629 stock units and Transjamaican Highway gained 0.05 of a cent to close at 0.95 of one US cent, with 92 units crossing the market.
 A total of 22,909,155 shares were traded for $1,091,762,298 compared to 17,038,158 units at $174,268,763 on Friday. Trading averages 375,560 units at $17,897,743 versus 298,915 shares at $3,057,347 on Friday and month to date, an average of 765,882 units at $5,638,283, compared to 788,281 units at $4,934,777 on the previous trading day. July closed with an average of 173,643 units at $1,683,017.
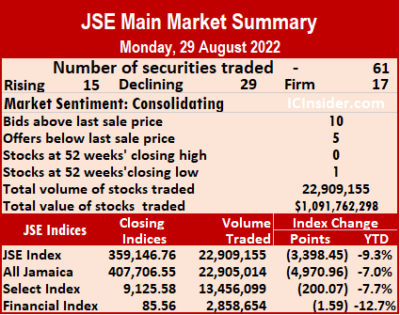 At the close, Berger Paints dropped 94 cents to $10.51 after trading 1,629 shares, Caribbean Producers jumped $1.44 to close at $14.70 after 1,127,687 stocks passed through the market, Eppley fell $1 to $40 with 2,823 units clearing the market. Eppley Caribbean Property Fund lost $4.98 in closing at $40.02, with 820 stock units changing hands, First Rock Real Estate rallied 96 cents to end at $12.46 while exchanging 118 stock units, GraceKennedy shed $1.59 to end at $93.40 in an exchange of 10,773,935 stocks. Guardian Holdings declined $18.99 in closing at $511.01 with a transfer of 57 shares, JMMB Group dipped 51 cents to $40.99 as investors exchanged 29,513 units, Kingston Properties declined 35 cents to close at $7.05 in exchanging 4,555 stock units. Kingston Wharves popped $1.15 to end at $39 after a transfer of 5,323 units, Margaritaville fell $1 to $26.55 in exchanging 58 stocks, Massy Holdings lost $1 to close at $85.50 in trading 3,005 shares. Mayberry Investments dropped 78 cents to end at $9.12 in switching ownership of 535,690 stock units, MPC Caribbean Clean Energy shed $16.49 to $68 after trading 259 units, NCB Financial advanced $1.80 in closing at $92.80 with investors transferring 32,384 stocks. 138 Student Living dipped 75 cents to end at $6.50 with 76,424 shares changing hands, Palace Amusement climbed $11 to close at $711 with the swapping of 123 shares, Portland JSX fell $3 to $9 with an exchange of 95,118 units.
 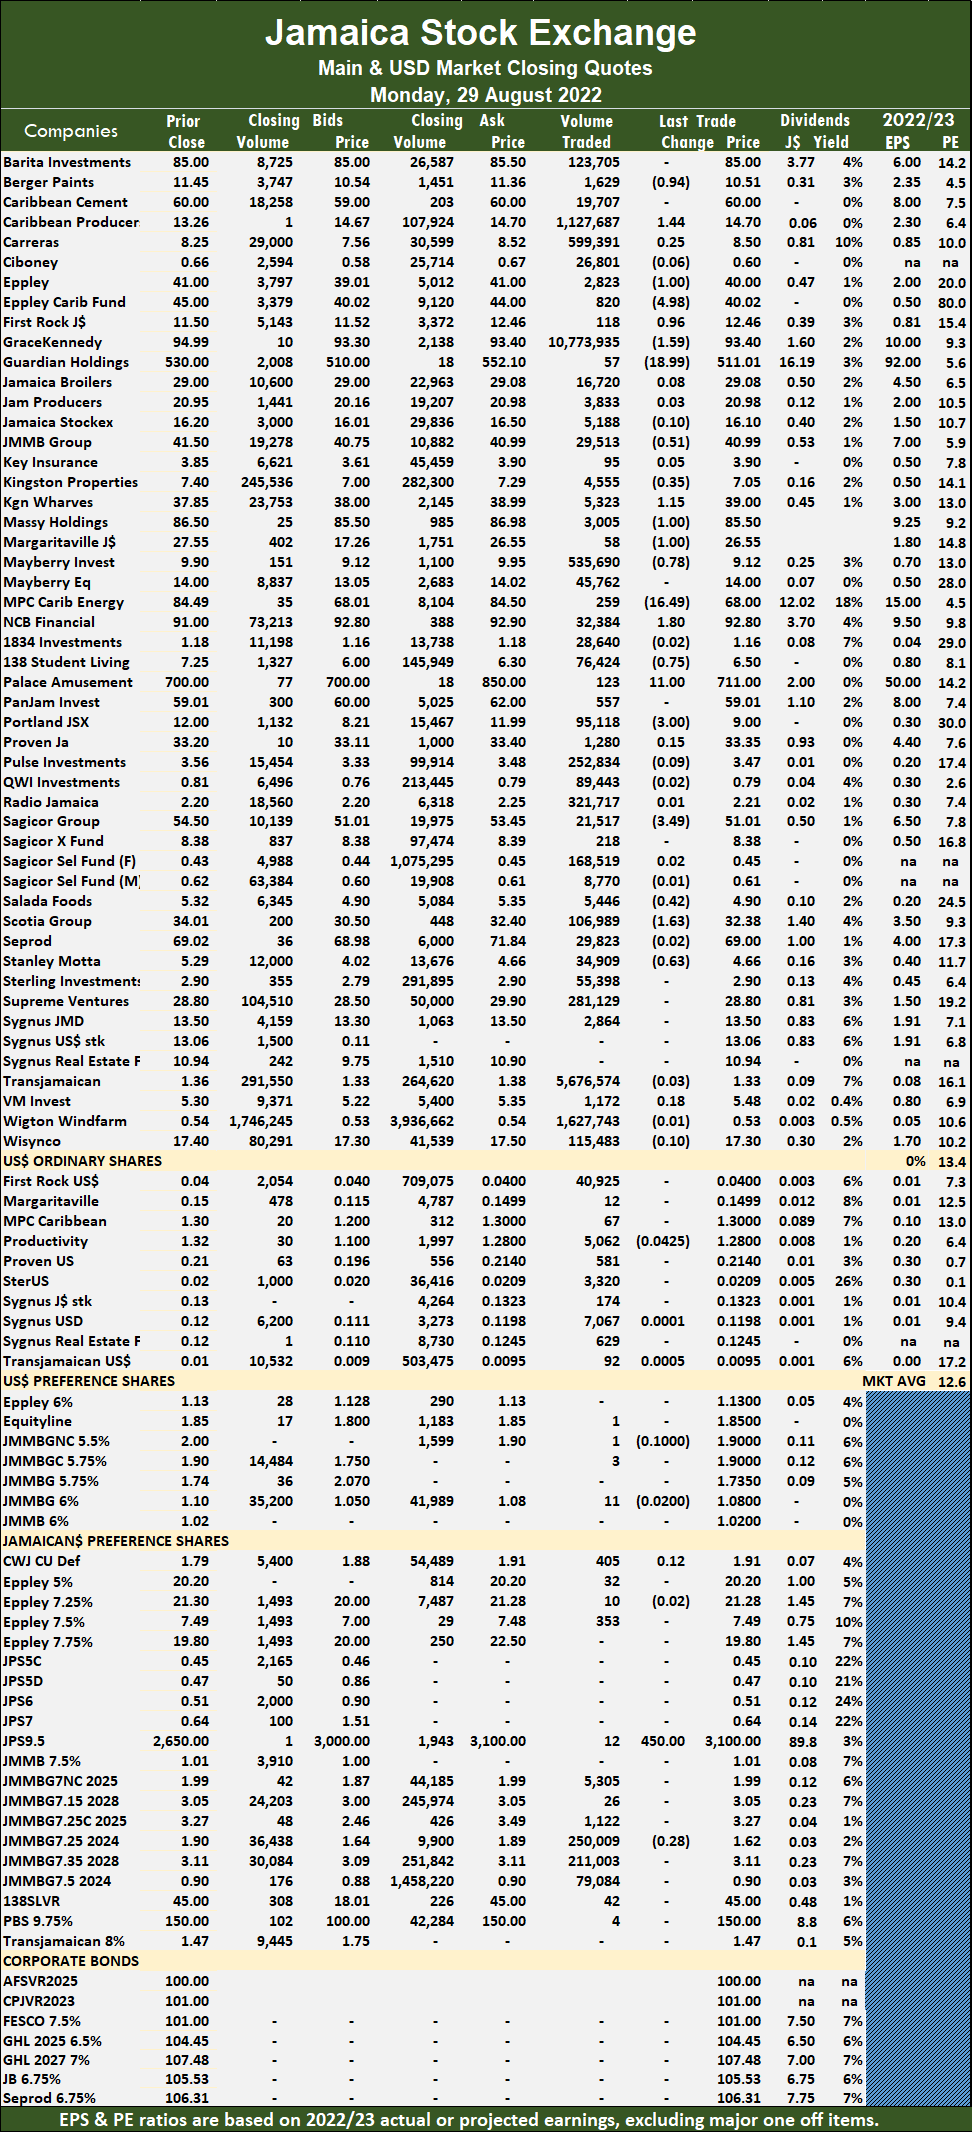 Sagicor Group lost $3.49 after ending at $51.01, with 21,517 stocks crossing the market, Salada Foods shed 42 cents in closing at $4.90 with an exchange of 5,446 stock units, Scotia Group declined $1.63 ending at a 52 weeks’ low of $32.38 after exchanging 106,989 units and Stanley Motta dipped 63 cents in closing at $4.66 with investors transferring 34,909 stock units.
 A sum of 10,844,740 shares were traded for $34,617,754 compared to 11,228,856 units at $38,807,870 on Friday. Trading averaged 240,994 shares at $769,283 on Monday compared to 255,201 shares at $881,997 on Friday, with month to date, averaging 351,870 units at $1,181,801 compared to 358,007 units at $1,204,634 on the previous trading day. July closed with an average of 512,709 units at $2,574,304.
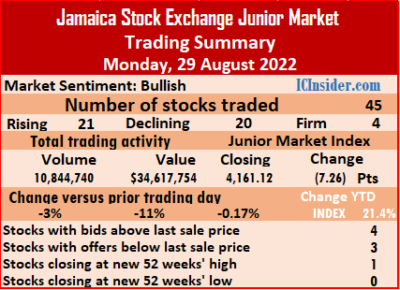 At the close, AMG Packaging dropped 18 cents to $3.81, with 10,798 shares changing hands, Blue Power gained 32 cents to end at $3.52 in trading 256 stock units, CAC 2000 dived $2.05 to close at $6.20 in trading 55 units. Caribbean Assurance Brokers climbed 15 cents to $2.65 after 5,269 stocks crossed the exchange, Caribbean Cream declined 37 cents in closing at $3.88 while exchanging 17,569 shares, Consolidated Bakeries popped 32 cents to a 52 weeks’ closing high of $2.31 after trading 341,603 units. Dolphin Cove gained $1 to end at $14.50 after exchanging 114,990 stocks, Express Catering rallied 34 cents to $5.94 with the swapping of 2,928 stock units, Fontana lost 27 cents in closing at $8.98 after a transfer of 200,507 stock units. Future Energy Source fell 25 cents to $5.35 in an exchange of 835,887 units, General Accident shed 85 cents to end at $5 as investors exchanged 165,751 shares, iCreate fell 10 cents to $4.20, with 151,415 stocks clearing the market. Jamaican Teas rose 13 cents in closing at $2.71, with 249,442 stocks crossing the market, KLE Group advanced 27 cents to $2.07 with an exchange of 405 units, Knutsford Express rallied 16 cents to close at $7 with investors transferring 3,716 shares.
 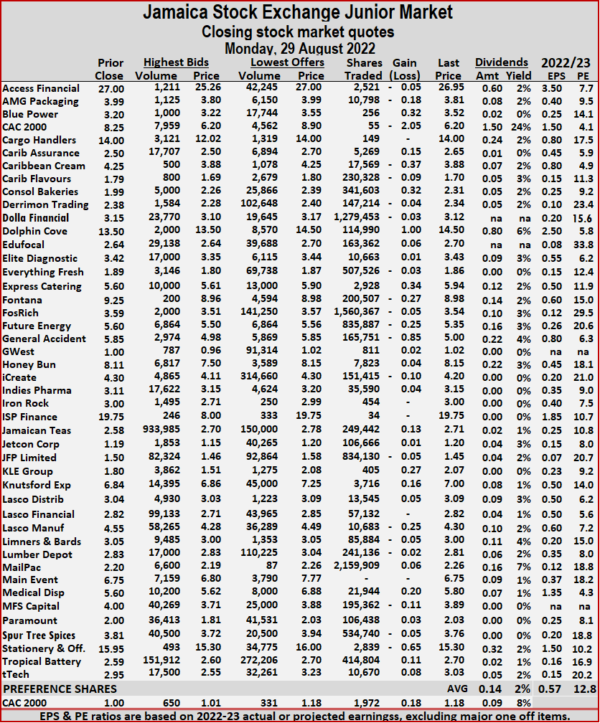 Lasco Manufacturing lost 25 cents in ending at $4.30, trading 10,683 stock units, Medical Disposables popped 20 cents to close at $5.80, with 21,944 stock units crossing the market, MFS Capital Partners declined 11 cents in closing at $3.89 after exchanging 195,362 stocks. Stationery and Office Supplies dipped 65 cents to $15.30 in switching ownership of 2,839 shares and Tropical Battery climbed 11 cents to end at $2.70 with a transfer of 414,804 units.
 The All Jamaican Composite Index fell 4,970.96 points to 407,706.55, the JSE Main Index dropped 3,398.45 points to 359,146.76, the Junior Market Index slipped 7.26 points to 4,161.12 and the JSE USD market Index rallied 0.61 points to 214.14.
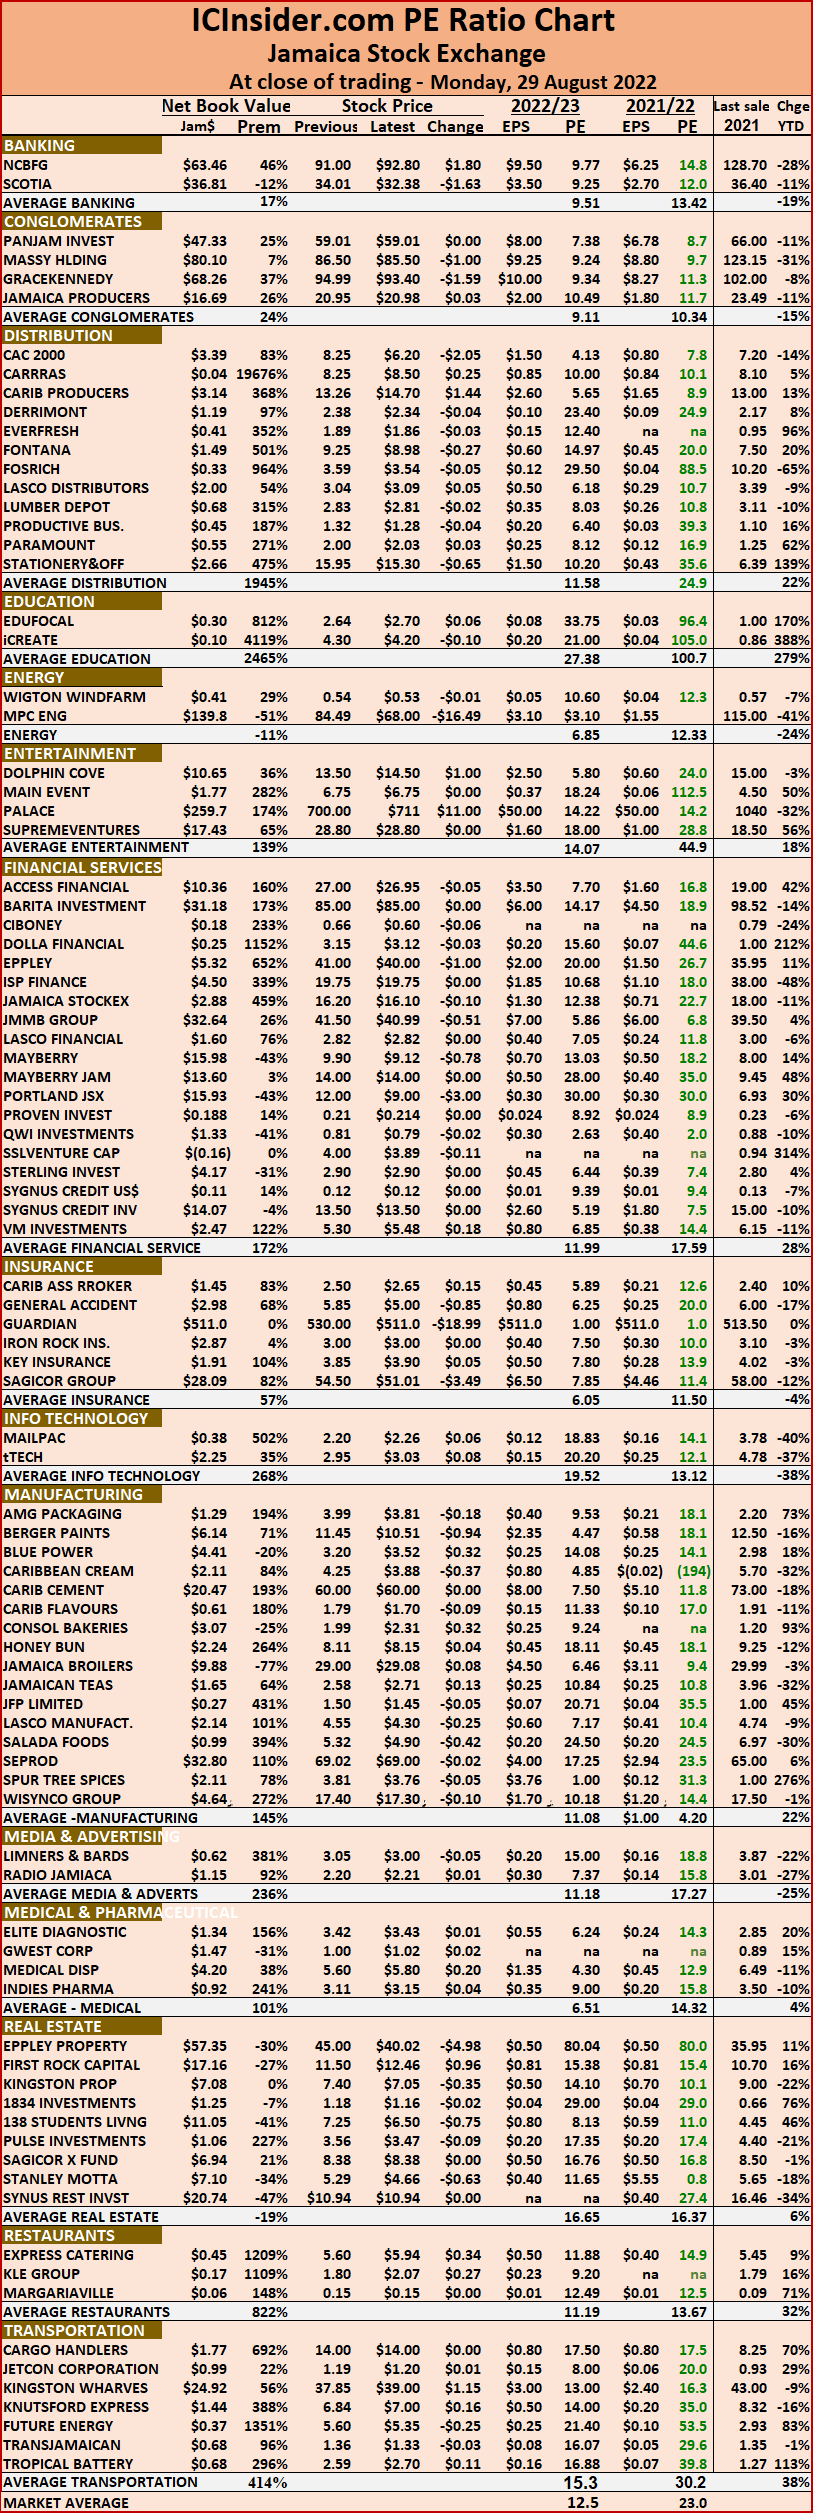 The net asset value of each company is reported as a guide to assess the value of stocks based on this measure quickly. The chart also shows daily changes in stock prices and the percentage year to date price movement based on the last traded prices. Dividends payable and yields for each company are shown in the Main and Junior Markets’ daily report charts that show the closing volume for the bids and offers.


