The value of stocks trading on Friday fell to depressingly low levels, with less than $39 million worth of transactions for the day, but the Junior and the JSE USD markets recorded gains at the close of trading on the Jamaica Stock Exchange on Friday, but the Main Market recorded a modest decline resulting in the JSE Combined Index, a measure of the overall market slipping 389.39 points to close at 367,632.44.
 The All Jamaican Composite Index fell 1,103.98 points to 404,484.30, the JSE Main Index shed 669 points to 353,428.65, the Junior Market Index rallied 25.99 points to 4,133.53 and the JSE USD market Index popped 3.15 points to close at 212.17.
Trading ended, with 10,716,616 shares changing hands, at a mere $38.78 million, down from $139.44 million, with 10,637,320 shares traded in all markets on the previous day. The JSE USD market ended with US$19,700 worth of stocks traded, down from from US$26,259 Thursday.
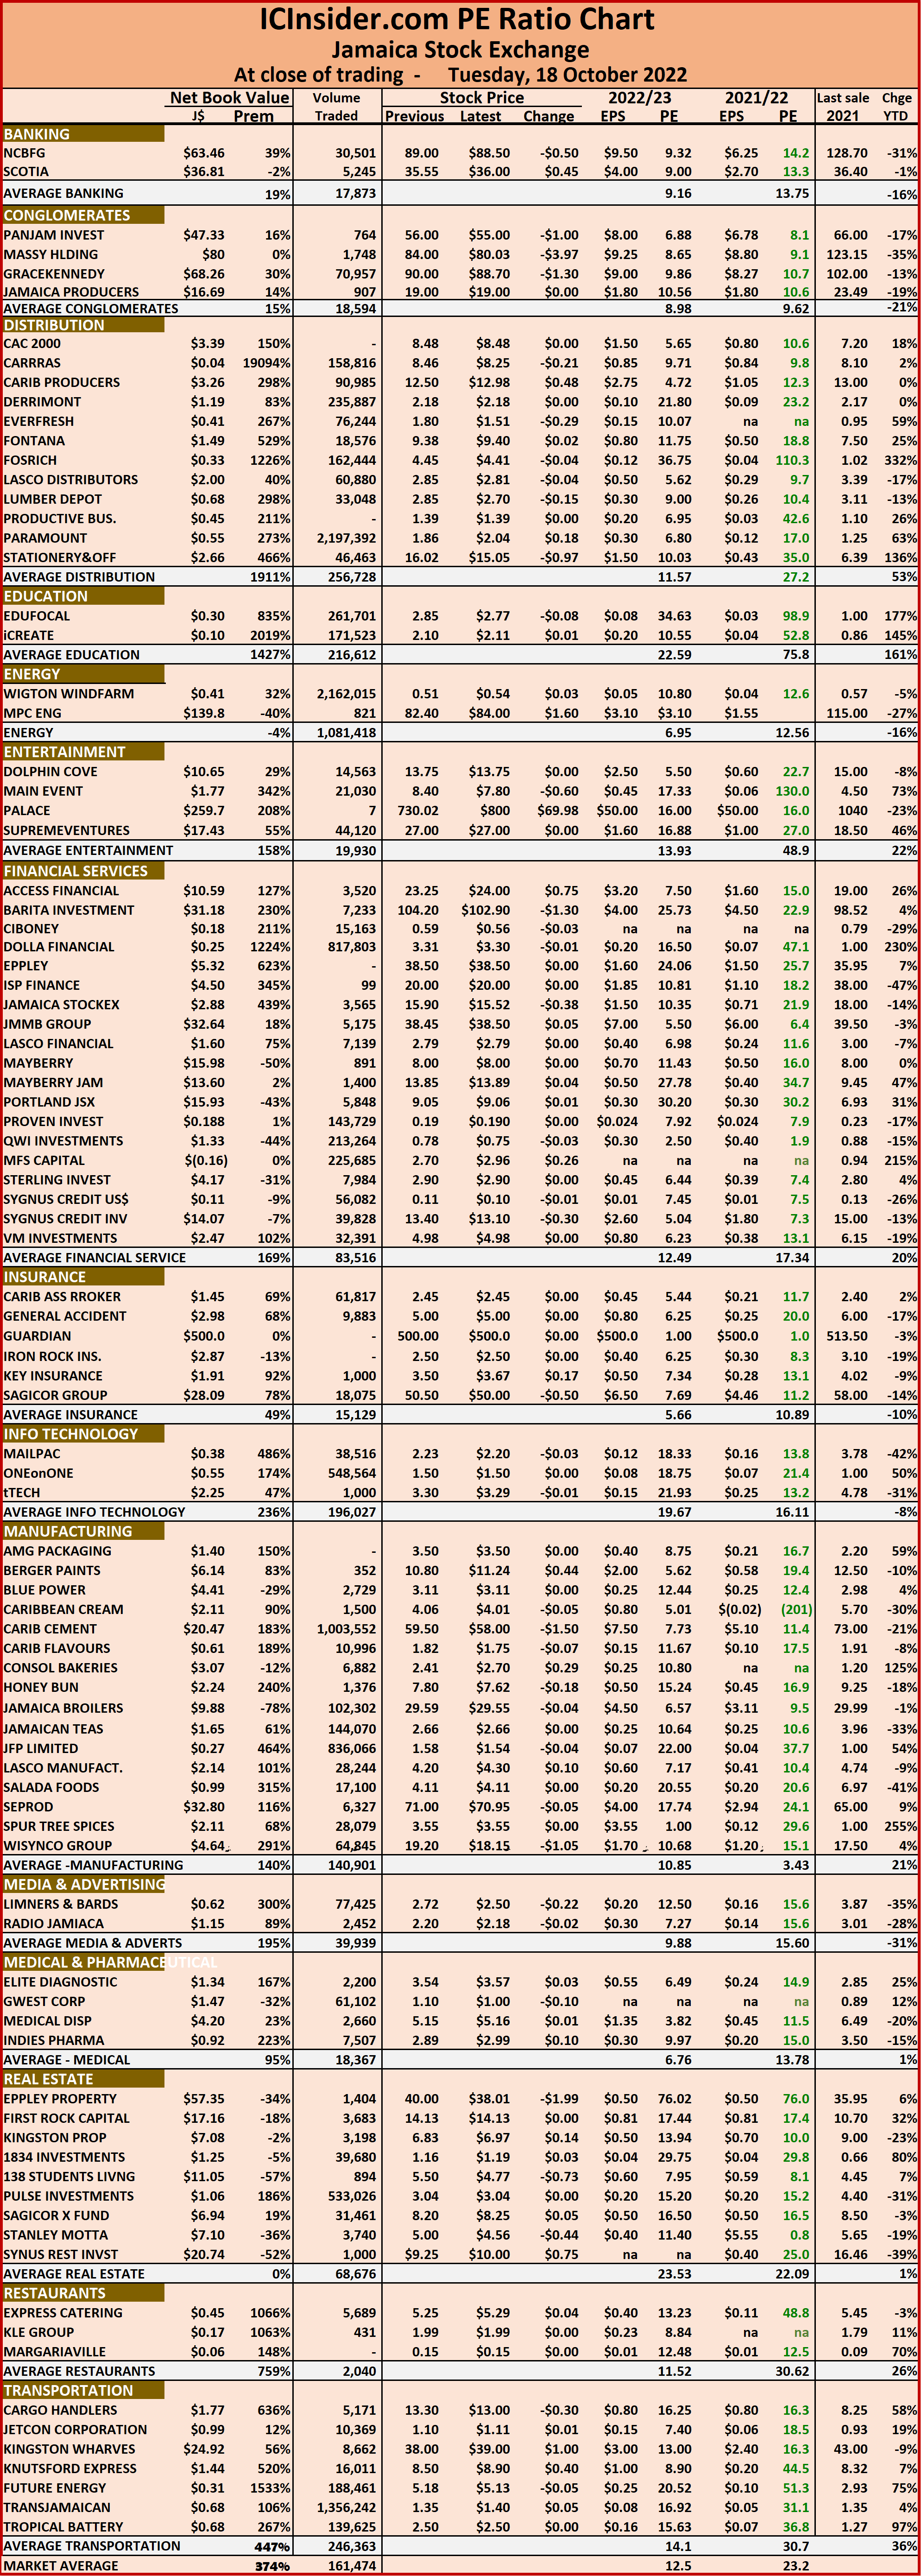
The market’s PE ratio ended at 23.5 based on 2021-22 earnings and 12.6 times those for 2022-23 at the close of trading.
Investors need pertinent information to navigate many investment options in the local stock market successfully. The ICInsider.com PE ratio chart and the more detailed daily report charts provide investors with regularly updated information to help decision-making.
Investors should use the chart to help make rational investment decisions by investing in stocks close to the average for the sector and not going too far from it unless there are compelling reasons to do so. This approach helps to remove emotions from investment decisions and put in on fundamentals while at the same time not being too far from the majority of investors. Investors who buy when the price of a stock is close to the average will find that they are not inclined to overpay for a stock.
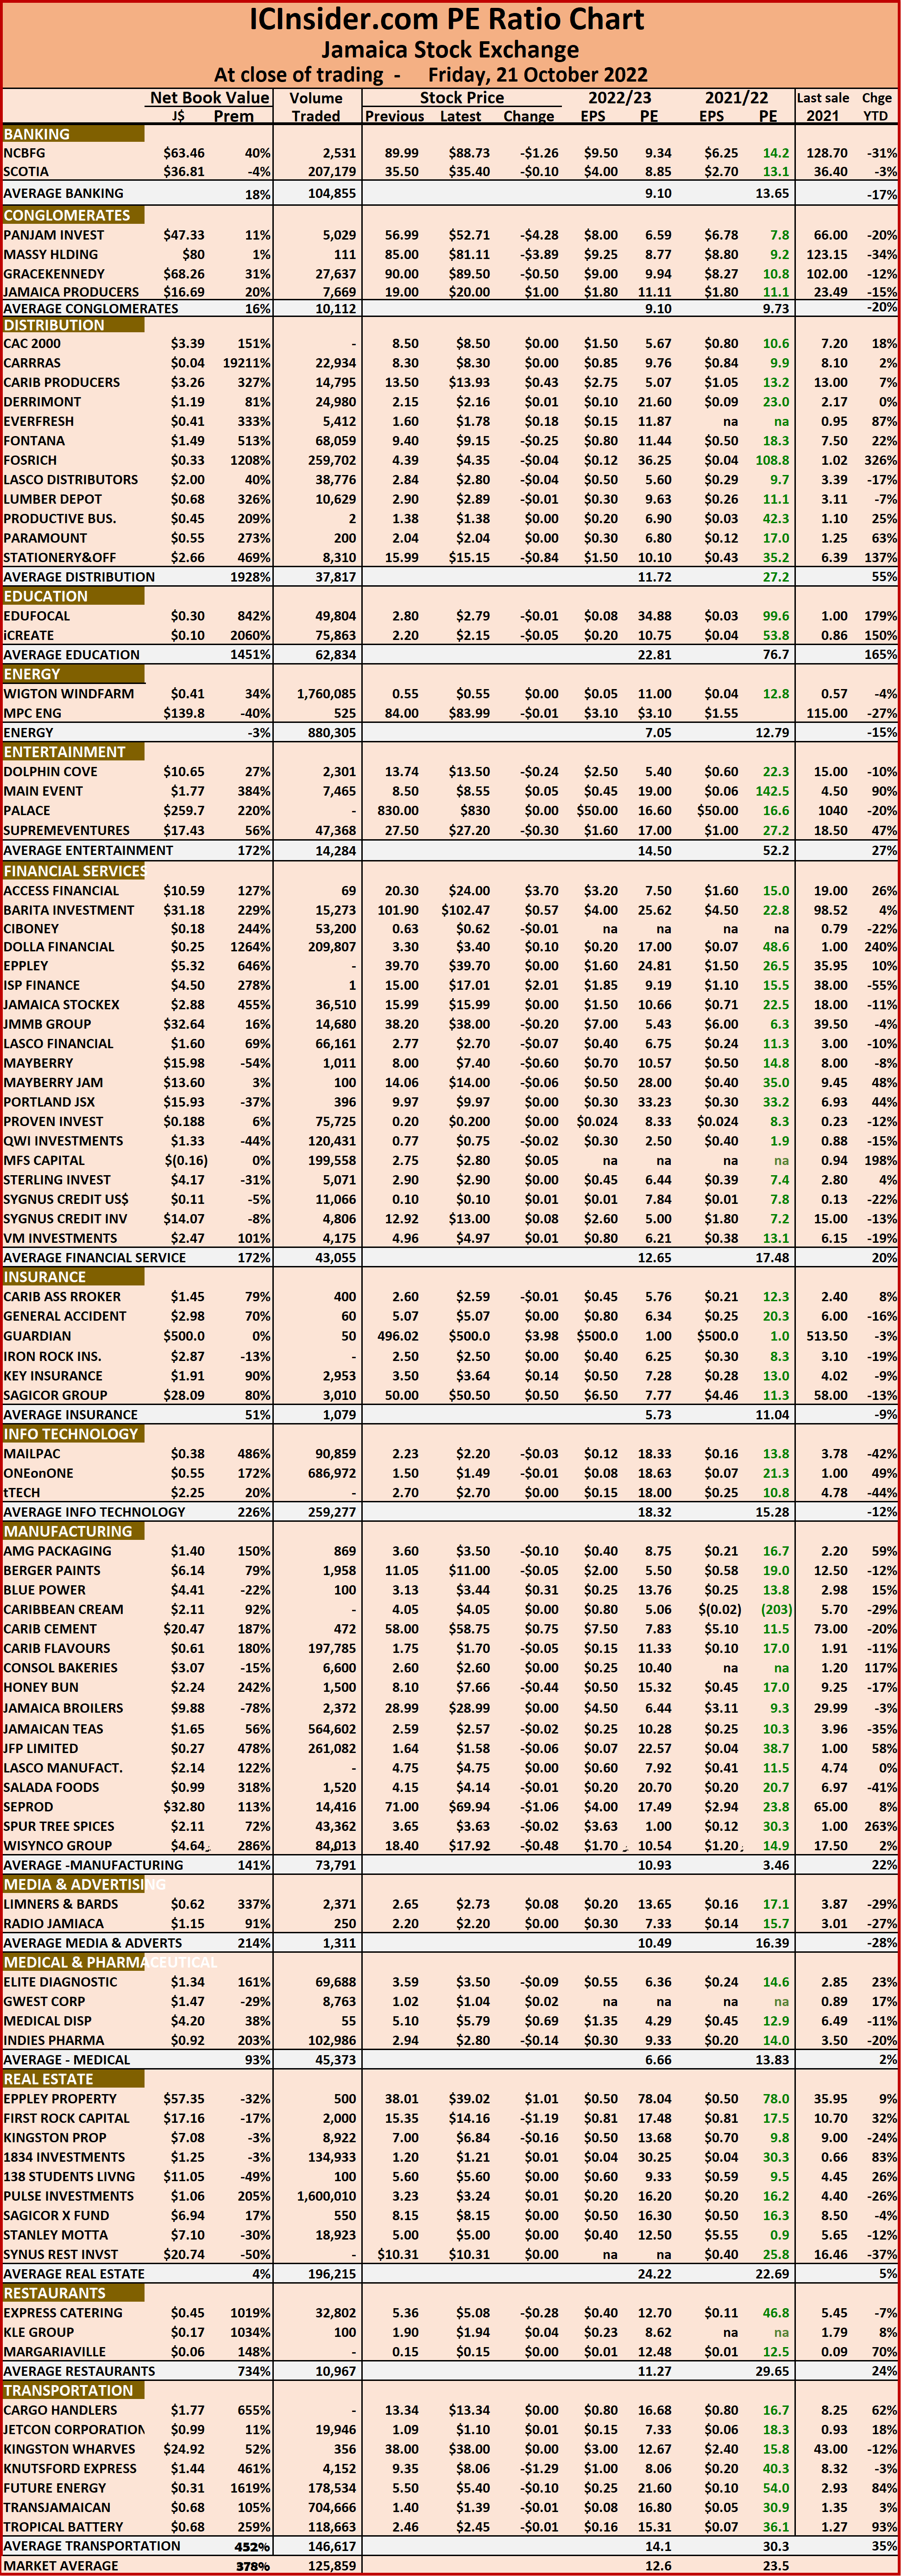 The ICInsider.com PE Ratio chart covers all ordinary shares on the Jamaica Stock Exchange. It shows companies grouped on an industry basis, allowing easy comparisons between the same sector companies and the overall market.
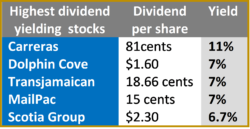
The net asset value of each company is reported as a guide to assess the value of stocks based on this measure quickly. The chart also shows daily changes in stock prices and the percentage year to date price movement based on the last traded prices. Dividends payable and yields for each company are shown in the Main and Junior Markets’ daily report charts that show the closing volume for the bids and offers.
The EPS & PE ratios are based on 2021 and 2022 actual or projected earnings, excluding major one off items. The PE Ratio is the most popular measure used to determine the value of stocks.
 Overall, 311,092 shares were traded for US$26,259 compared to 391,069 units at US$21,025 on Wednesday.
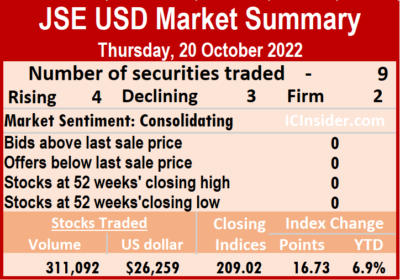 Proven Investments rallied 0.99 of one cent to close at 19.99 US cents in trading 13,486 stock units, Sterling Investments remained at 1.9 US cents after trading 17,710 stocks, Sygnus Credit Investments USD share rose 0.5 of one cent to 9.5 US cents after 2,289 shares changed hands and Transjamaican Highway declined 0.04 of a cent in closing at 0.85 of one US cent in exchange of 219,942 units.
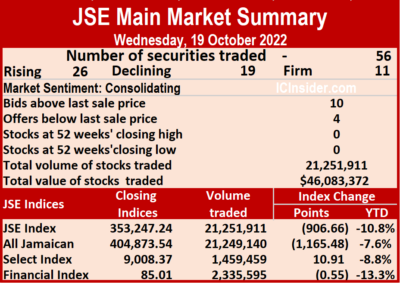
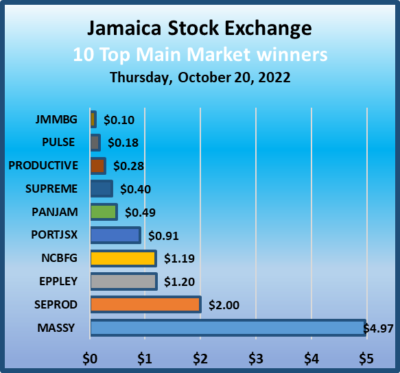 Only 4,041,001 shares were traded for $117,403,602 against 21,251,911 units at $46,083,372 on Wednesday.
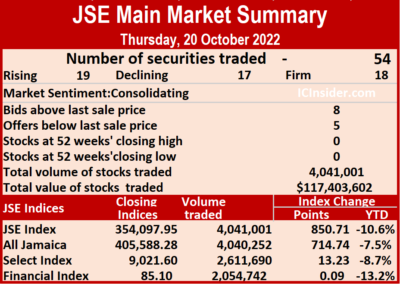 The JSE Main and USD Market PE ratios incorporate ICInsider.com’s projected profit for companies with the financial year ending between November and August 2023.
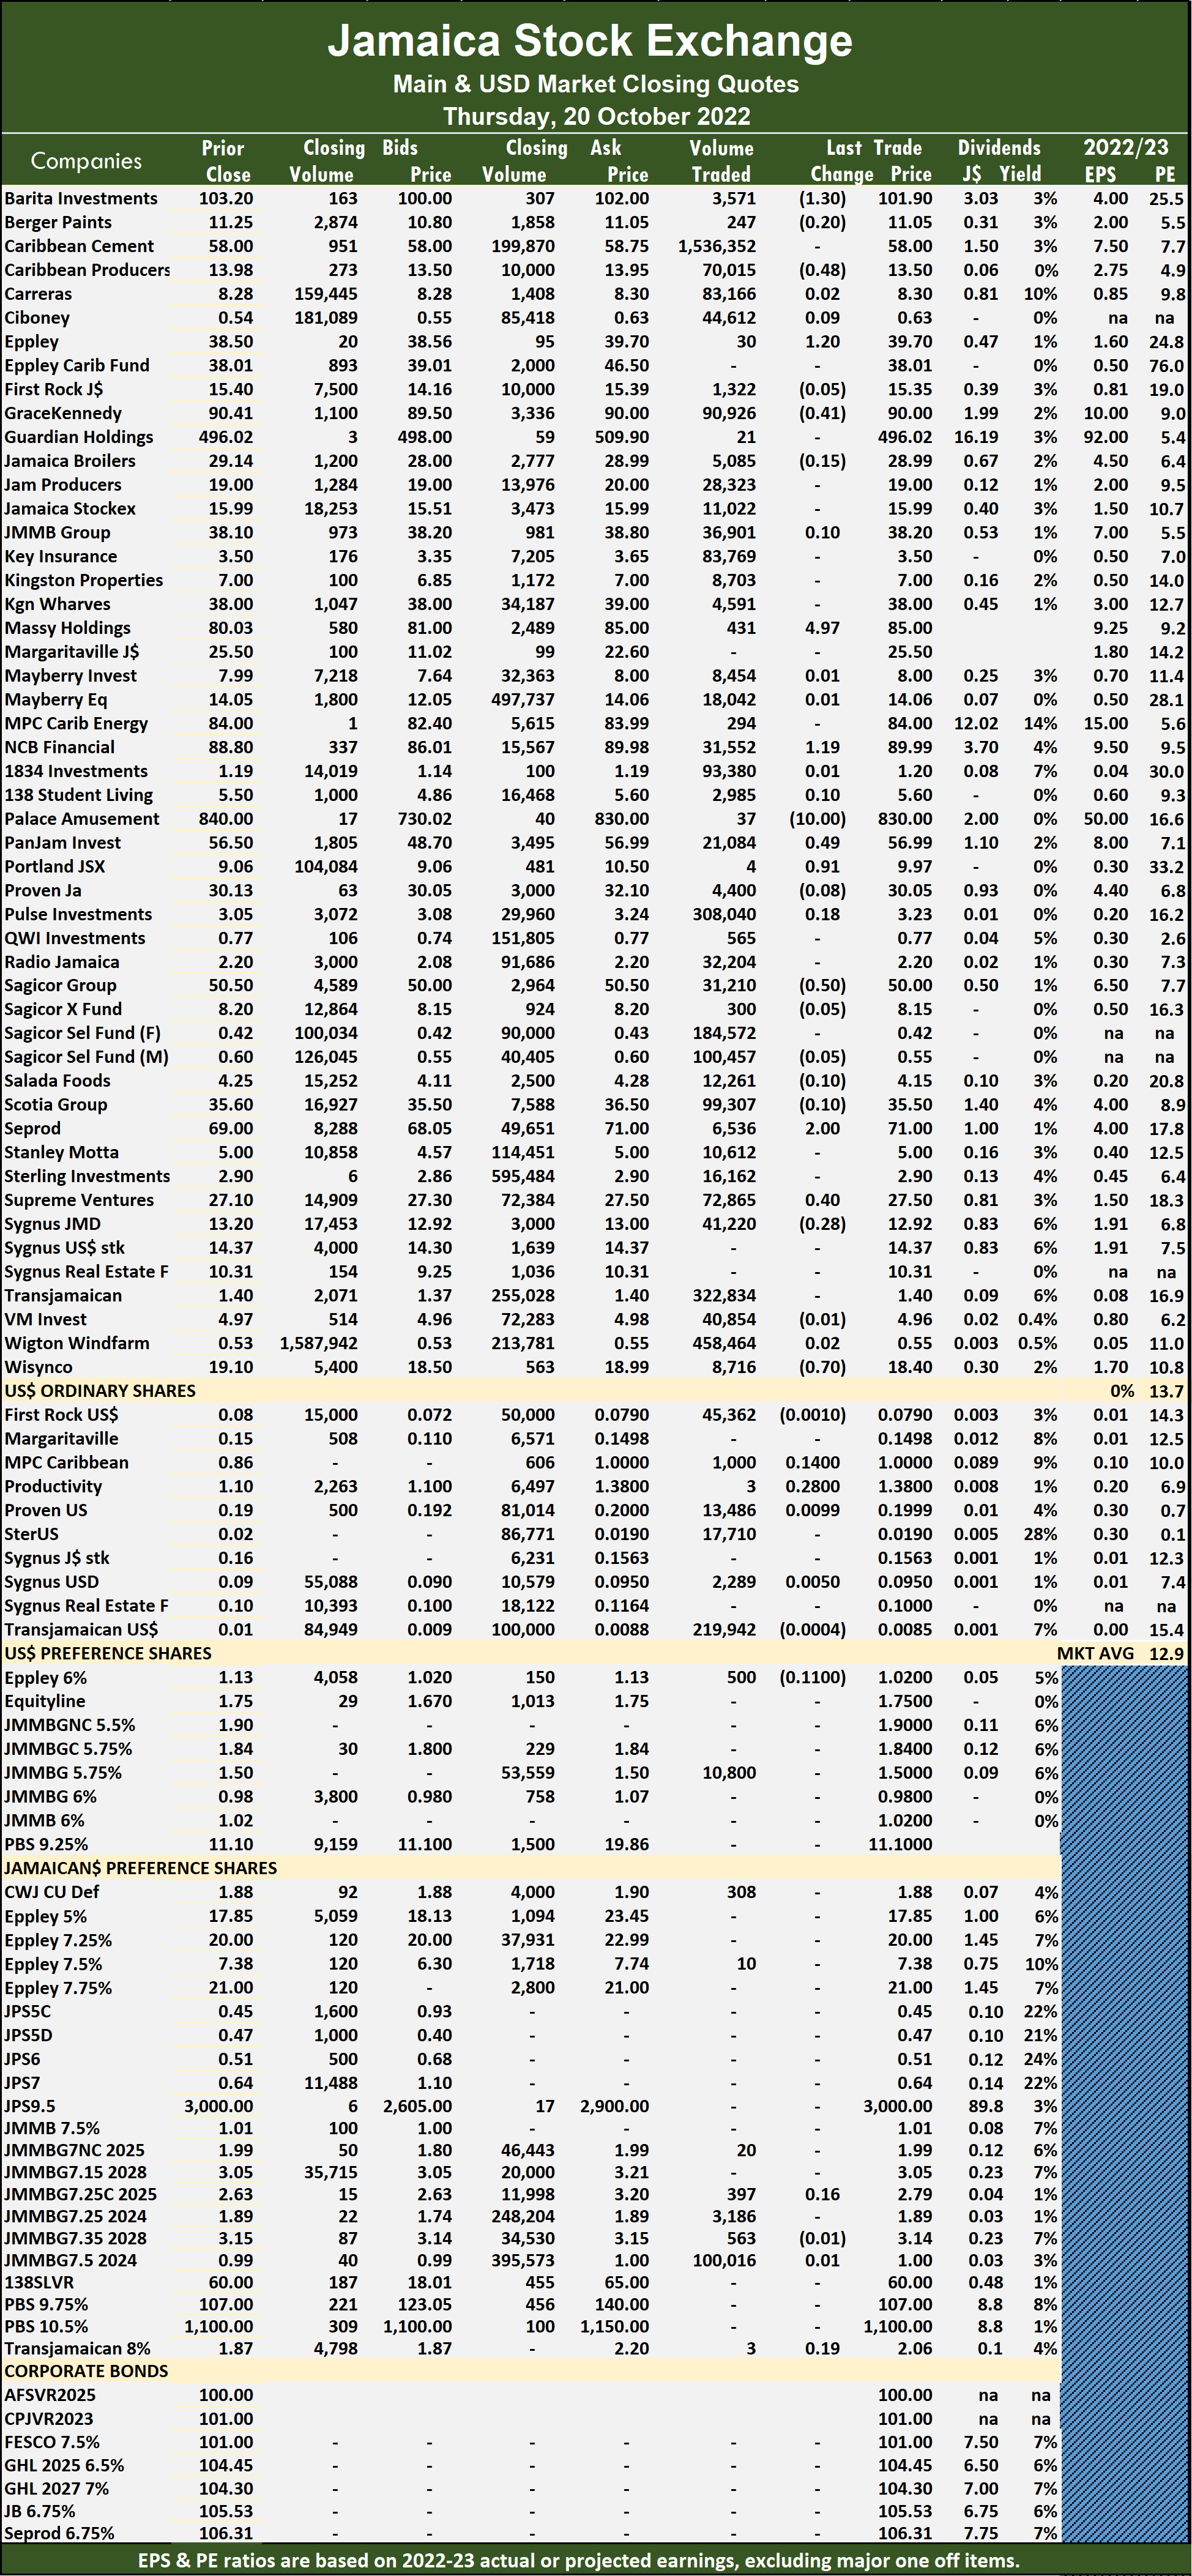 Sagicor Group dropped 50 cents in closing at $50 with 31,210 stocks traded, Seprod rose $2 to $71 in exchanging 6,536 shares, Supreme Ventures advanced 40 cents to $27.50, with 72,865 units changing hands and Wisynco Group lost 70 cents to close at $18.40 after exchanging 8,716 shares.
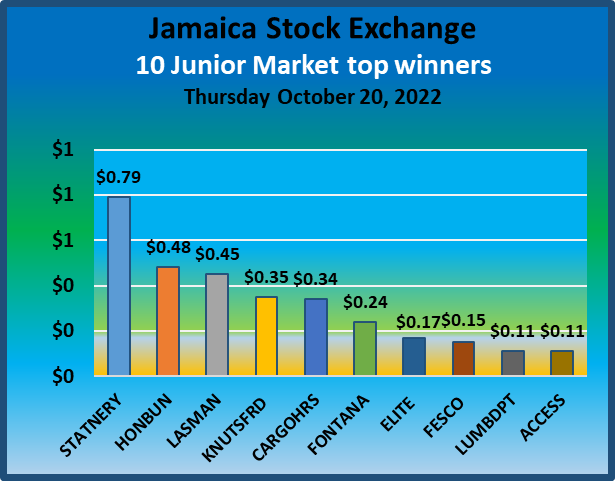 Investors traded 6,285,227 shares for $22,042,267 versus 6,618,235 units at $17,556,220 on Wednesday.
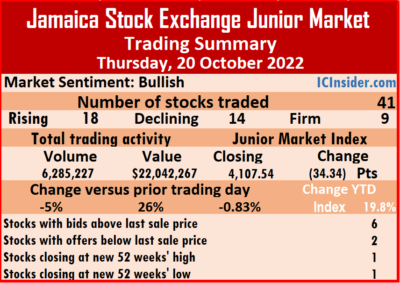 At the close, Access Financial advanced 11 cents to close at $20.30 after an exchange of ten shares, Cargo Handlers increased 34 cents to $13.34 after a transfer of 2,004 stocks, Dolla Financial lost 14 cents to end at $3.30 in an exchange of 1,237,664 stock units. Elite Diagnostic popped 17 cents in closing at $3.59 in trading 15,172 units, Fontana climbed 24 cents to $9.40 with 36,521 stocks changing hands, Future Energy Source rallied 15 cents in closing at $5.50 as investors exchanged 132,818 units. Honey Bun gained 48 cents in ending at $8.10, with 16,661 stock units crossing the market, ISP Finance shed $5 to close at a 52 weeks’ low of $15 after exchanging 400 shares, Knutsford Express rose 35 cents to end at a 52 weeks’ high of $9.35 after trading 30,139 stock units. Lasco Distributors fell 15 cents to $2.84 with the swapping of 8,336 shares, Lasco Manufacturing rallied 45 cents to $4.75 in switching ownership of 2,030,085 units, Lumber Depot advanced 11 cents to close at $2.90 while exchanging 71,107 stocks.
 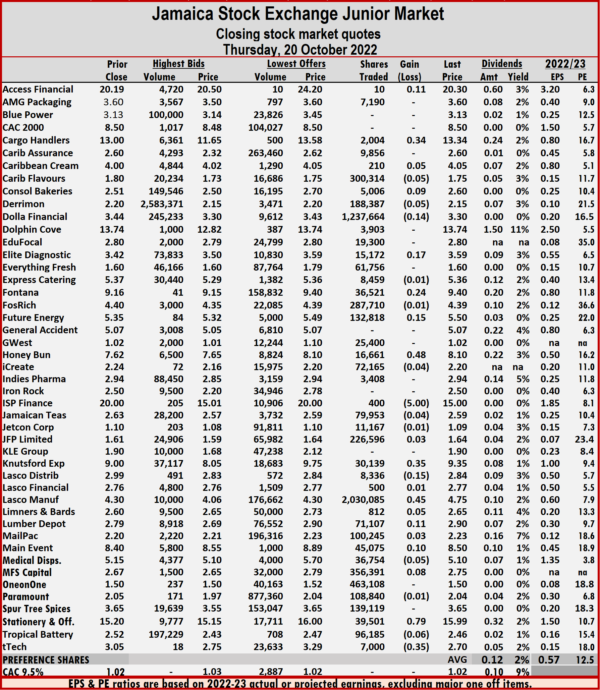 Main Event increased 10 cents to $8.50, with 45,075 shares changing hands, Stationery and Office Supplies popped 79 cents to $15.99, with 39,501 units clearing the market and tTech declined 35 cents in closing at $2.70, with 7,000 stock units passing through the market.
 The All Jamaican Composite Index rule 714.74 points to 405,588.28, the JSE Main Index rallied 850.71 points to354,097.95, the Junior Market Index dropped 34.34 points to 4,107.54 and the JSE USD market Index popped 16.73 points to close at 209.02.
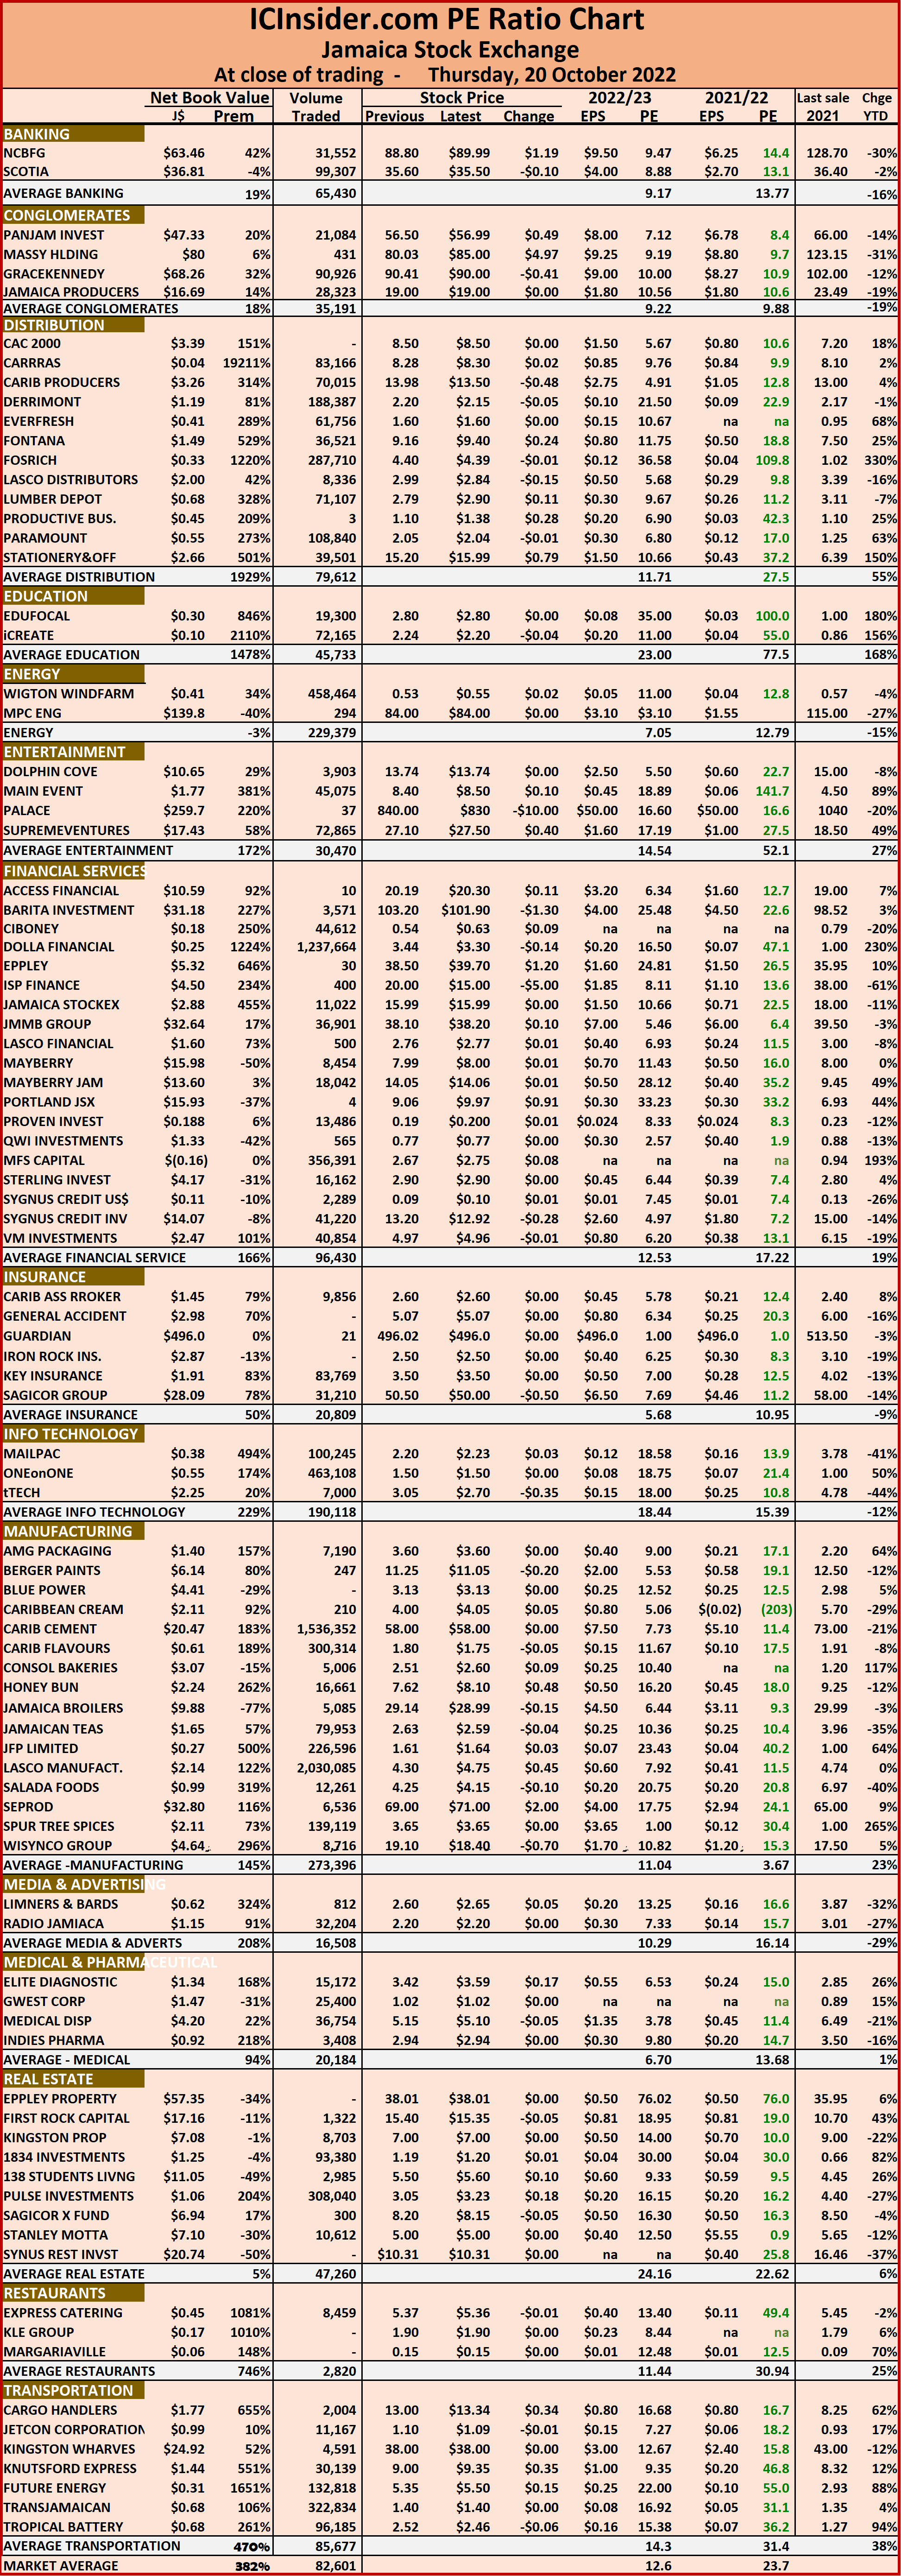 The net asset value of each company is reported as a guide to assess the value of stocks based on this measure quickly. The chart also shows daily changes in stock prices and the percentage year to date price movement based on the last traded prices. Dividends payable and yields for each company are shown in the Main and Junior Markets’ daily report charts that show the closing volume for the bids and offers.
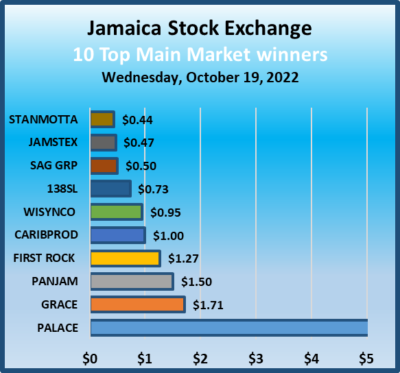
 At the close, Caribbean Producers rallied $1 to $13.98, with 880,504 shares crossing the market, First Rock Real Estate popped $1.27 to $15.40 in trading 50,070 stock units, GraceKennedy gained $1.71 to end at $90.41 as investors exchanged 36,305 units. Guardian Holdings declined $3.98 to $496.02 and closed after ten stocks were exchanged, Jamaica Broilers dropped 41 cents in closing at $29.14 in exchanging 10,212 units, Jamaica Stock Exchange rose 47 cents to end at $15.99 in switching ownership of 3,500 stocks. JMMB Group dipped 40 cents to $38.10 with an exchange of 13,949 shares, Kingston Wharves fell $1 in closing at $38 while exchanging 1,297 stock units, Margaritaville popped $4.15 to close at $25.50 in trading two units. 138 Student Living climbed 73 cents to $5.50, with 260 stock units crossing the exchange, Palace Amusement climbed $40 to $840 after just two shares changed hands, PanJam Investment rose $1.50 to $56.50 in an exchange of 11,455 stocks. Proven Investments shed $2.25 to $30.13 after an exchange of 4,093 units, Sagicor Group gained 50 cents in closing at $50.50 after exchanging 6,657 shares, and trading at a 52 weeks’ intraday low of $49.90. Scotia Group lost 40 cents to close at $35.60, with 100,649 stock units clearing the market,
  Seprod declined $1.95 to $69, with 2,447 stocks crossing the market, Stanley Motta increased 44 cents in ending at $5 with the swapping of 9 stock units and Wisynco Group popped 95 cents to $19.10 with a transfer of 11,410 stocks.In the preference segment, 138 Student Living preference share shed $4 to close at $60 after exchanging 58 shares and Productive Business Solutions 9.75% preference share lost $19.59 in closing at $107 after a transfer of 307 units.Prices of securities trading are those for the last transaction of each stock unless otherwise stated.
 Overall, 391,069 shares were traded for US$21,025 compared to 294,958 units at US$41,204 on Tuesday.
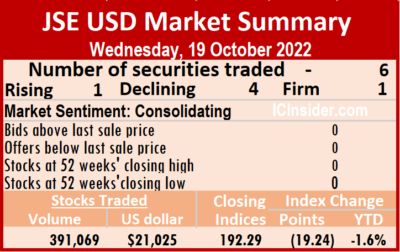 Productive Business Solutions declined 29 cents to US$1.10 as 2,837 units passed through the market, Proven Investments remained at 19 US cents with an exchange of 11,270 stock units. Sterling Investments dipped 0.1 of a cent to 1.9 US cents in trading 28,267 stocks, Sygnus Credit Investments USD share lost 0.51 of a cent to end at 9 US cents with investors transferring 26,898 stocks and Transjamaican Highway shed 0.01 of a cent to end at 0.89 US cents in an exchange of 181,791 units.
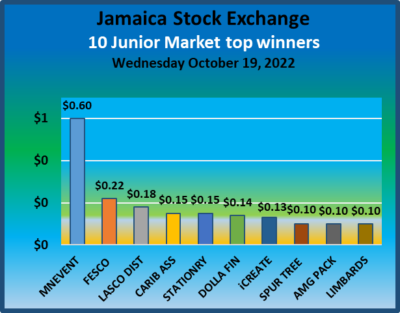 A total of 6,618,235 shares were exchanged for $17,556,220 up from 6,590,370 units at $16,862,106 on Tuesday.
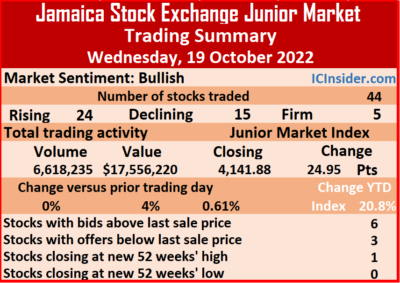 At the close, Access Financial dropped $3.81 in closing at $20.19, with 23 shares changing hands, AMG Packaging climbed 10 cents to $3.60 after trading 454,722 stock units, Caribbean Assurance Brokers rose 15 cents to $2.60 in exchanging 441,293 stock units. Consolidated Bakeries declined 19 cents to $2.51 after an exchange of 38,248 units, Dolla Financial rallied 14 cents to $3.44 in trading 1,040,889 shares, Elite Diagnostic fell 15 cents to close at $3.42 with a transfer of 101,812 stock units. Fontana lost 24 cents to end at $9.16, with 42,852 units clearing the market, Future Energy Source popped 22 cents to $5.35 with the swapping of 301,333 stocks, iCreate rallied 13 cents to $2.24, with 291,871 stock units crossing the market. Knutsford Express rose 10 cents in closing at a 52 weeks’ high of $9 after trading 5,620 shares, Lasco Distributors gained 18 cents to end at $2.99, with 19,778 stocks changing hands, Limners and Bards rallied 10 cents to $2.60 after exchanging 400 units. Main Event rose 60 cents in ending at $8.40 after an exchange of 15,612 stocks,
 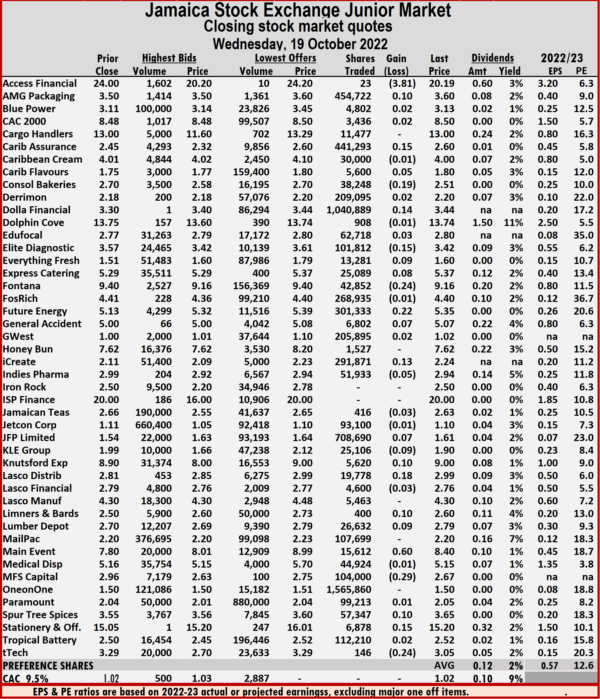 MFS Capital Partners dipped 29 cents in closing at $2.67, with 104,000 shares crossing the market, Spur Tree Spices advanced 10 cents to close at $3.65 after a transfer of 57,347 stock units. Stationery and Office Supplies increased 15 cents to $15.20 with investors transferring 6,878 units and tTech shed 24 cents in closing at $3.05 after finishing the trading of 146 stock units.
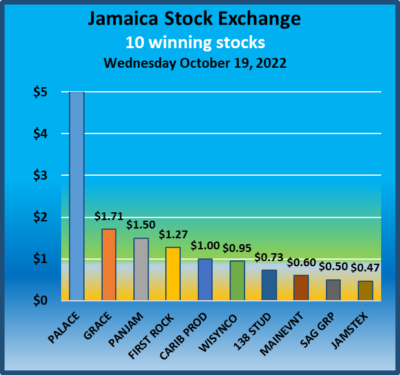
 The ICInsider.com PE Ratio chart covers all ordinary shares on the Jamaica Stock Exchange. It shows companies grouped on an industry basis, allowing easy comparisons between the same sector companies and the overall market.
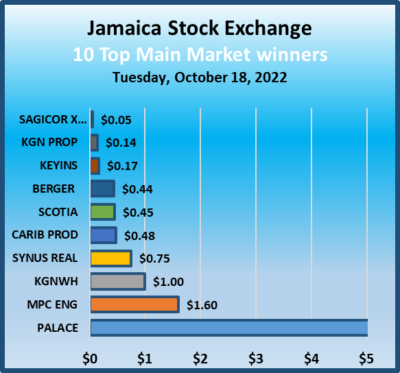
 At the close, Barita Investments dropped $1.30 to $102.90 after a transfer of 7,233 shares, Berger Paints advanced 44 cents to $11.24 with a transfer of 352 stocks, Caribbean Cement declined $1.50 to close at $58 after trading 1,003,552 units. Caribbean Producers popped 48 cents in closing at $12.98, with 90,985 stock units crossing the exchange, Eppley Caribbean Property Fund fell $1.99 to $38.01 after trading 1,404 units, GraceKennedy dipped $1.30 to $88.70 with investors transferring 70,957 stocks. Kingston Wharves rose $1 to $39, with 8,662 shares changing hands, Margaritaville increased $1.95 in closing at $21.35 after an exchange of two stock units, Massy Holdings shed $3.97 to close at $80.03 as investors exchanged 1,748 stocks. MPC Caribbean Clean Energy rallied $1.60 to $84 after switching ownership of 821 stock units, NCB Financial lost 50 cents in closing at $88.50 and exchanging 30,501 units, 138 Student Living declined 73 cents to $4.77 with the swapping of 894 shares. Palace Amusement jumped $69.98 to $800 in trading seven shares, PanJam Investment shed $1 to end at $55 after 764 stocks were traded, Proven Investments climbed $1.38 to close at $32.38, with 3,060 stock units crossing the market. Sagicor Group dropped 50 cents to close at $50, with 18,075 units clearing the exchange, Scotia Group rallied 45 cents to $36 with an exchange of 5,245 shares, Stanley Motta dipped 44 cents to $4.56 after exchanging 3,740 units.
  Sygnus Credit Investments USD share increased $1.31 to $14.37 in an exchange of 824 stock units, Sygnus Real Estate Finance rose 75 cents to 10 in exchanging 1,000 stocks and Wisynco Group fell $1.05 to $18.15 while trading 64,845 stocks.