The Main Market of the Jamaica Stock Exchange declined in trading on Tuesday as the Junior Market JSE USD market closed moderately higher as trading ended with the number of stocks changing hands rising moderately over that on Monday, with a much higher the value, resulting in prices of 31 shares rising and 32 declining.
 At the close of trading, the JSE Combined Market Index fell 2,956.19 points to close at 336,894.23, the All Jamaican Composite Index declined 4,420.59 points to 362,015.66, the JSE Main Index dropped 3,062.56 points to end the day at 323,947.96. The Junior Market Index dipped 2.92 points to end at 3,781.03 and the JSE USD Market Index popped 1.19 points to settle at 242.61.
At the close of trading, 11,538,316 shares were exchanged in all three markets, marginally up from 11,094,504 units on Monday, with the value of stocks traded on the Junior and Main markets amounted to $162.75 million, well over the $40.23 million on the previous trading day and the JSE USD market closed with an exchange of 86,667 shares for US$14,748 compared to 152,339 units at US$5,545 on Monday.
In Main Market activity, Sagicor Group led trading with 3.04 million shares followed by Wigton Windfarm with 1.63 million stock units, Transjamaican Highway with 1.13 million stocks and General Accident with 1.08 million shares.
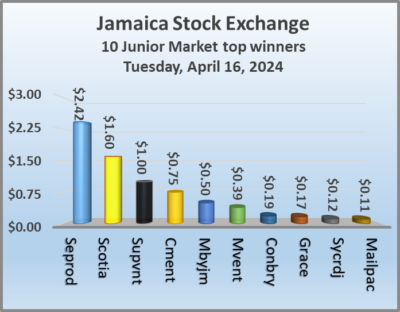
In Junior Market trading, One Great Studio led trading with 1.06 million shares followed by Spur Tree Spices with 1.05 million units and ONE on ONE Educational with 199,059 units for 6.4 percent market share.
 In the preference segment, Jamaica Public Service 7% advanced $3.01 to end at $50, 138 Student Living preference share climbed $5 in closing at $215, Productive Business Solutions 9.75% preference share skidded $3.45 and ended at $115 and Sygnus Credit Investments C10.5% popped $5.49 to finish at $109.49.
The market’s PE ratio, the most popular measure used to determine the value of stocks, ended at 20 on 2023-24 earnings and 13.4. times those for 2024-25 at the close of trading. ICInsider.com PE ratio chart and the more detailed daily charts provide investors with regularly updated information to help decision-making.
The PE ratio chart covers all ordinary shares on the Jamaica Stock Exchange, grouped by industry, allowing for easy comparisons within a sector and the overall market. The EPS & PE ratios are based on 2023 and 2024 actual or projected earnings, excluding major one off items.
Pertinent information is required to navigate numerous investment options successfully in the stock market. The ICInsider.com PE ratio chart and the more detailed daily report charts provide investors with regularly updated information to help decision-making.
The chart should be used in making rational decisions when investing in stocks close to the average for the sector, not going too far from it unless there are compelling reasons to do so. This approach helps to remove emotions from investment decisions and place them on fundamentals while at the same time not being too far from the majority of investors.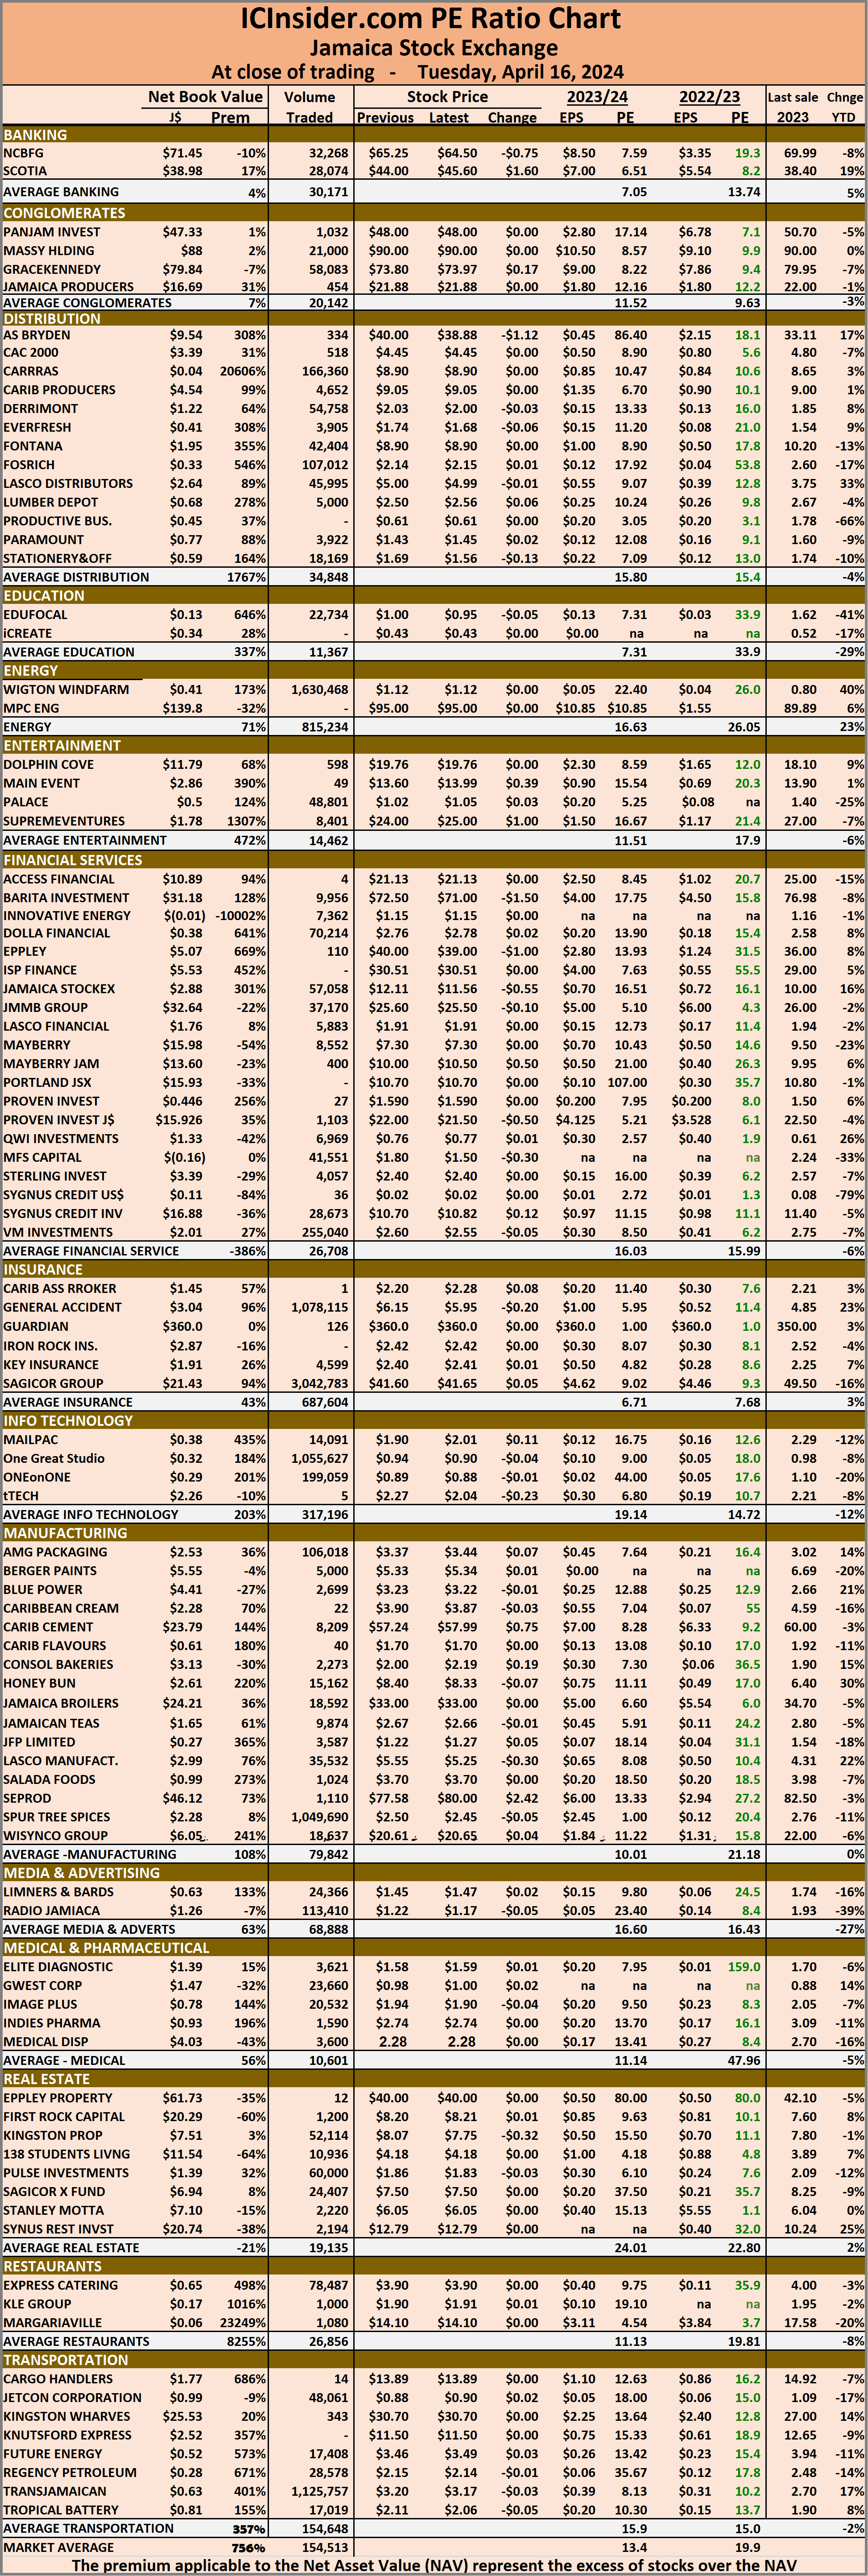 Investors who buy when the price of a stock is close to the average will find that they are not inclined to overpay for a stock.
The net asset value of each company is reported as a guide for investors to quickly assess the value of stocks based on this measure. The chart also shows daily changes in stock prices and the percentage year to date price movement based on the last traded prices.
Dividends paid or payable and yields for each company are shown in the Main and Junior Markets’ daily report charts, along with the closing volume of the highest bid and the lowest offer for each company.
 The market ended trading of 6,145,603 shares at $29,633,029 compared to 10,926,398 units at $160,297,742 on Friday.
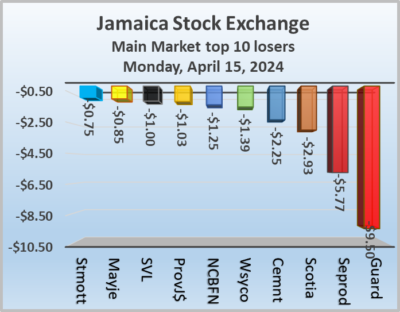 The Main Market ended trading with an average PE Ratio of 13.1. The JSE Main and USD Market PE ratios are based on the last traded prices and earnings forecasts by ICInsider.com for companies with the financial year ending around August 2025.
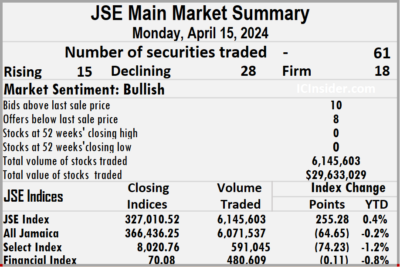 Scotia Group declined $2.93 to end at $44 in an exchange of 3,421 units, Seprod dipped $5.77 in closing at $77.58 with 9,441 stocks clearing the market, Stanley Motta slipped 75 cents to close at $6.05 with an exchange of 4,597 stock units. Supreme Ventures skidded $1 to $24 after 126,649 shares crossed the market and Wisynco Group dropped $1.39 to finish at $20.61 as investors exchanged 51,035 units.
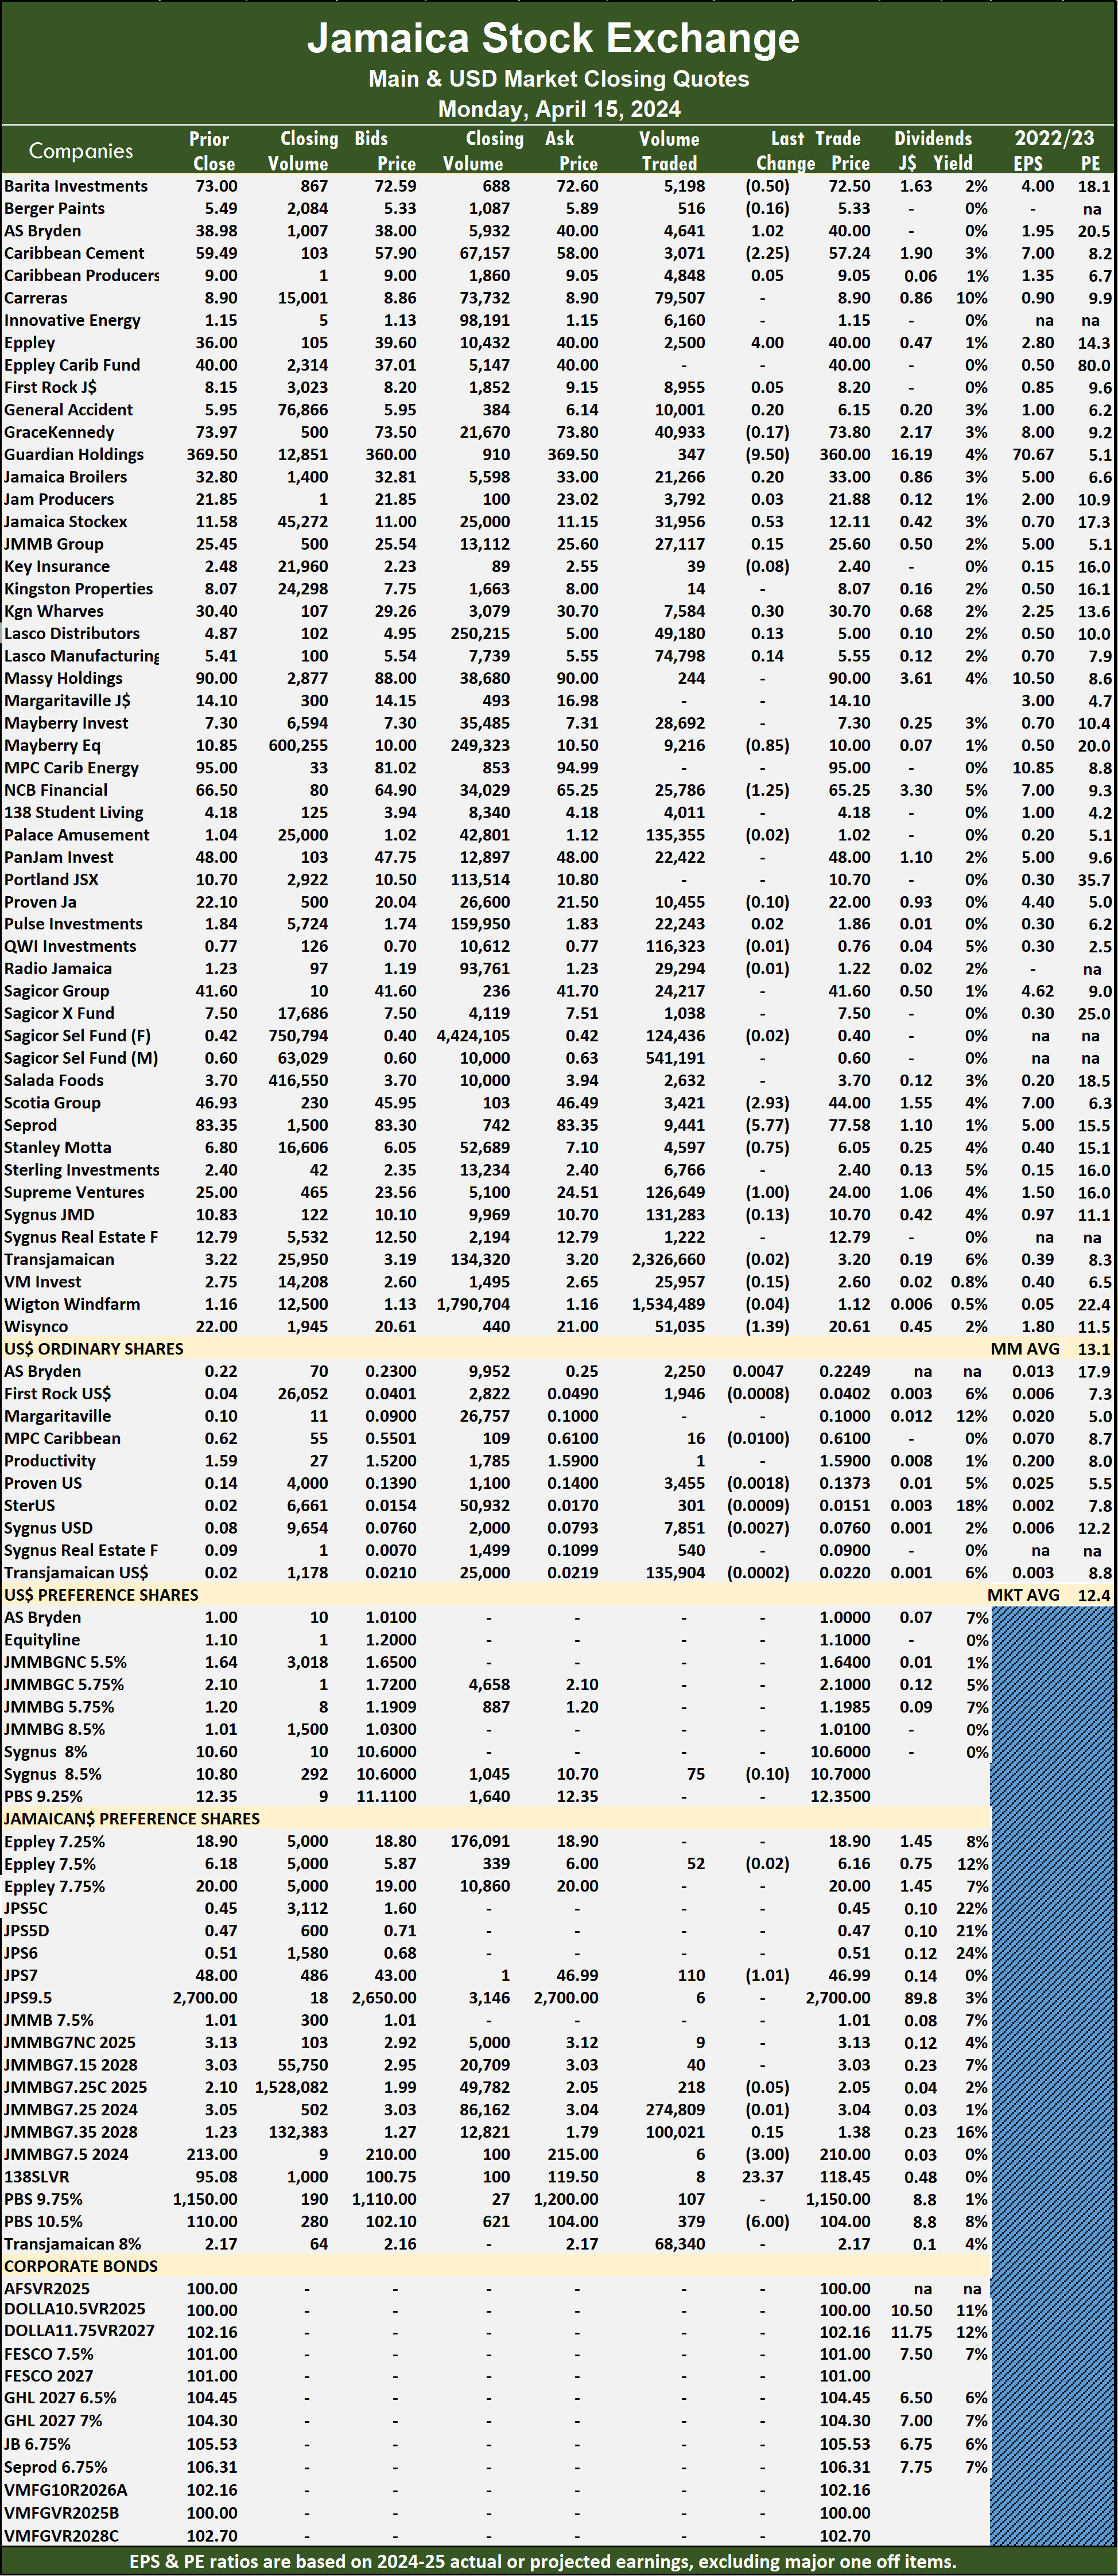 Prices of securities trading are those for the last transaction of each stock unless otherwise stated.
 The market closed with an exchange of 152,339 shares for US$5,545 compared to 9,705 units at US$1,717 on Friday.
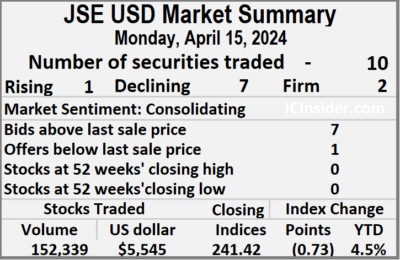 MPC Caribbean Clean Energy fell 1 cent to 61 US cents with an exchange of 16 shares. Productive Business Solutions remained at US$1.59, with one stock unit crossing the market, Proven Investments dipped 0.18 of a cent to end at 13.73 US cents in swapping 3,455 shares, Sterling Investments lost 0.09 of a cent to close at 1.51 US cents with 301 stocks clearing the market. Sygnus Credit Investments slipped 0.27 of one cent to 7.6 US cents with investors swapping 7,851 units, Sygnus Real Estate Finance USD share ended at 9 US cents after a transfer of 540 stock units and Transjamaican Highway slipped 0.02 cent in closing at 2.2 US cents, with 135,904 shares changing hands.
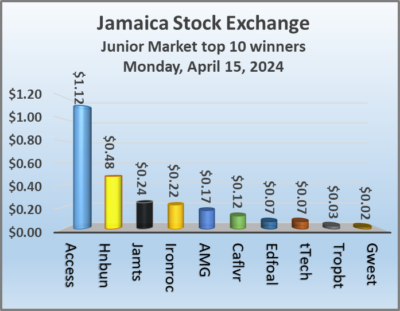 The market closed trading of 4,798,812 shares for $10,594,590 compared with 3,153,277 units at $5,829,829 on Friday.
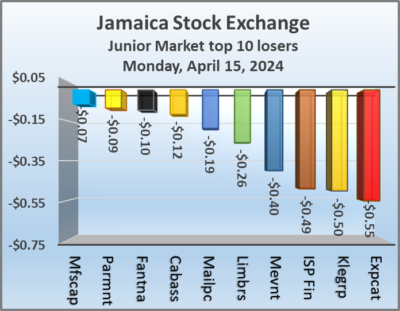 Investor’s Choice bid-offer indicator shows three stocks ended with bids higher than their last selling prices and seven with lower offers.
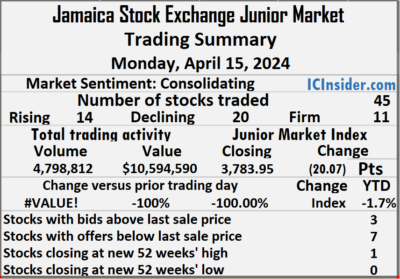 ISP Finance dropped 49 cents to close at $30.51 with investors swapping 4 stocks, Jamaican Teas advanced 24 cents to end at $2.67 with a transfer of 16,616 units, Jetcon Corporation lost 7 cents in closing at 88 cents, with 54 stock units crossing the market. KLE Group skidded 50 cents to $1.90 with investors transferring 10 shares, Limners and Bards sank 26 cents to close at $1.45 with 44,863 units clearing the market, Mailpac Group declined 19 cents in closing at $1.90 after trading 327,193 stocks. Main Event slipped 40 cents and ended at $13.60, with 8,274 stock units crossing the market, MFS Capital Partners sank 7 cents to finish at $1.80 with an exchange of 38,315 shares and tTech rose 7 cents to end at $2.27 in trading 2 units.
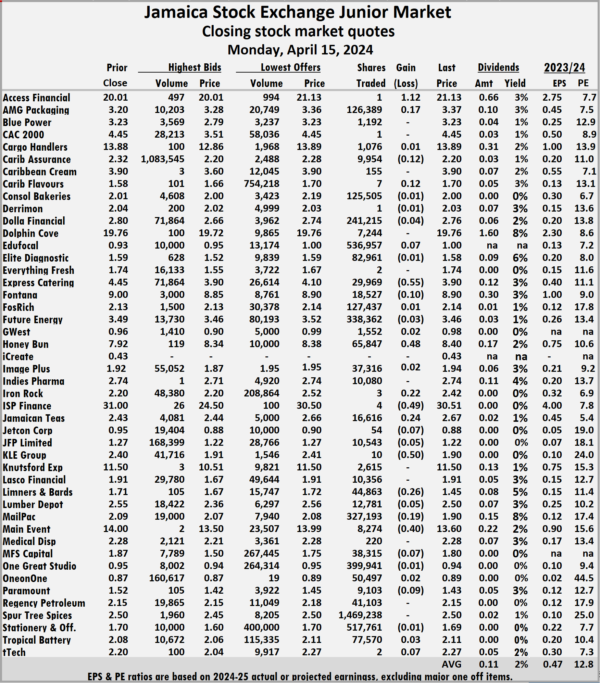 Prices of securities trading are those for the last transaction of each stock unless otherwise stated.
 At the end of trading, the JSE Combined Market Index gained 104.84 points to close at 339,850.42, the All Jamaican Composite Index skidded 64.70 points to 366,436.25, but the JSE Main Index gained 255.28 points to end at 327,010.52. The Junior Market Index skidded 20.07 points to conclude trading at 3,783.95 and the JSE USD Market Index sank 0.73 points to 241.42.
 In the preference segment, Jamaica Public Service 7% slipped $1.01 and ended at $46.99, 138 Student Living preference share lost $3 to end at $210, Productive Business Solutions 9.75% preference share popped $23.37 in closing at $118.45 and Sygnus Credit Investments C10.5% dipped $6 to close at $104.
 This approach helps to remove emotions from investment decisions and place them on fundamentals while at the same time not being too far from the majority of investors. Investors who buy when the price of a stock is close to the average will find that they are not inclined to overpay for a stock.
 In a review of the ICTOP10, the earnings for the current year were confirmed at 45 cents for
 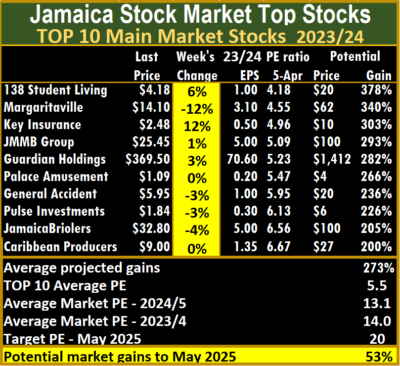 The average PE for the JSE Main Market ICTOP 10 stands at 5.5, well below the market average of 13.2 and the Junior Market TOP10 sits at 7.4 over half of the market, with an average of 12.6.
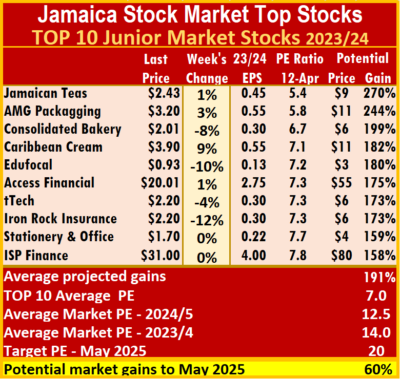 ICTOP10 focuses on likely yearly winners, accordingly, the list includes some of the best companies in the market, but this is not always so. ICInsider.com ranks stocks based on projected earnings, allowing investors to focus on the most undervalued stocks and helping to remove emotions in selecting stocks for investments that often result in costly mistakes.
 Trading closed with an exchange of 10,926,398 shares for $160,297,742 compared to 16,091,472 units at just $32,718,333 on Thursday.
 The Main Market ended trading with an average PE Ratio of 13.2. The JSE Main and USD Market PE ratios are based on the last traded prices and earnings forecasts by ICInsider.com for companies with the financial year ending around August 2025.
 Mayberry Group popped 30 cents to end at $7.30 as investors traded 784 shares. NCB Financial climbed $1.50 to $66.50 in switching ownership of 7,884 units, Proven Investments declined by 33 cents to $22.10, with 17,399 stock units crossing the market, Sagicor Real Estate Fund skidded 52 cents to finish at $7.50 in an exchange of 74,563 stock units. Stanley Motta slipped 30 cents to end at $6.80 with investors dealing in 2,000 shares, Supreme Ventures rose 40 cents to finish at $25 with a transfer of 29,121 stocks and Wisynco Group climbed $1 and ended at $22, with 57,591 units changing hands.
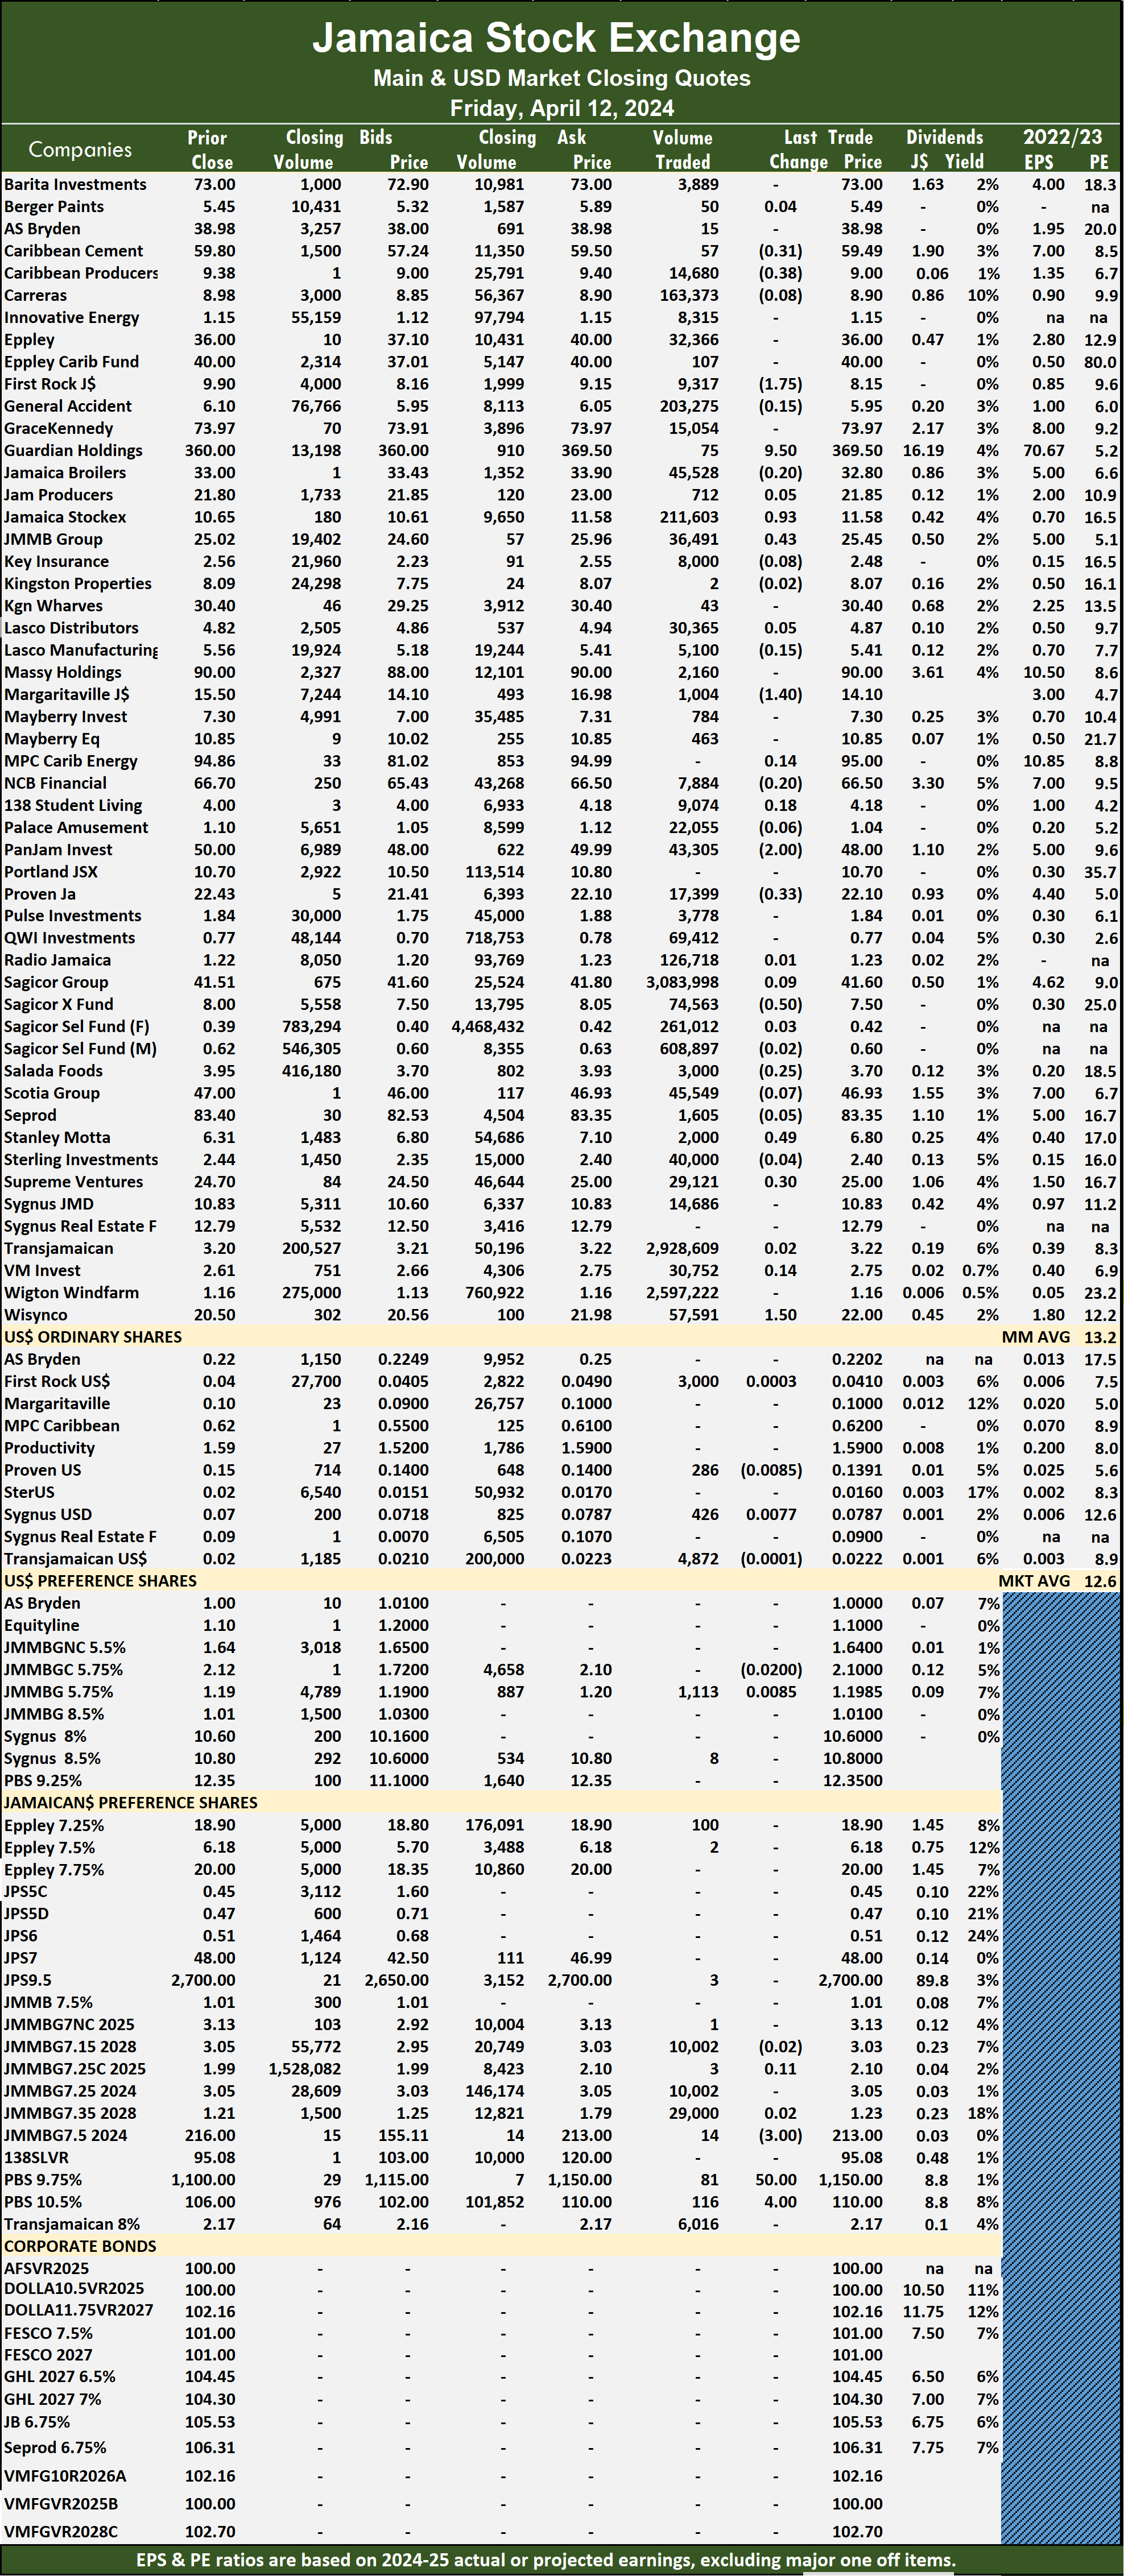 Prices of securities trading are those for the last transaction of each stock unless otherwise stated.
 The market closed with an exchange of 9,705 shares for US$1,717 down sharply on 326,941 units at US$17,135 on Thursday.
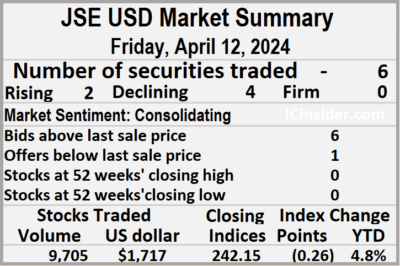 Proven Investments lost 0.09 of a cent in closing at 13.91 US cents, with 286 units crossing the market, Sygnus Credit Investments shed 0.09 of a cent to end at 7.87 US cents with trading of 426 shares and Transjamaican Highway declined 0.03 cent to finish at 2.22 US cents with 4,872 stock units clearing the market.
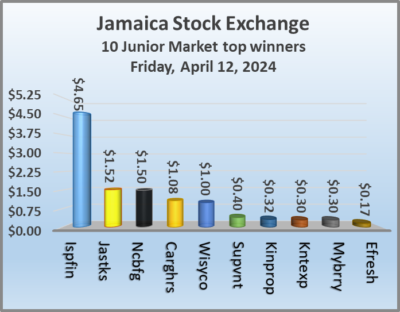 At the close of trading on Friday, the JSE Combined Market Index shed 1,284.91 points to end at 339,745.60, the All Jamaican Composite Index skidded 1,102.99 points to close at 366,500.95, the JSE Main Index fell 1,547.35 points to 326,755.24. The Junior Market Index popped 28.47 points to end trading at 3,804.02 and the JSE USD Market Index slipped 0.26 points to settle at 242.15.
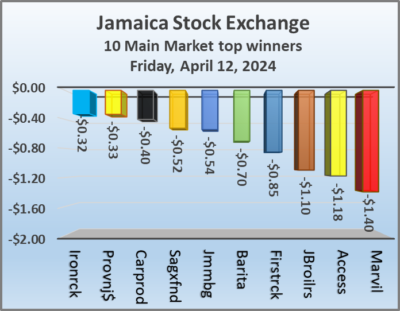 In the preference segment, 138 Student Living preference share fell $3 to end at $213 and Sygnus Credit Investments C10.5% gained $4 in closing at $110.
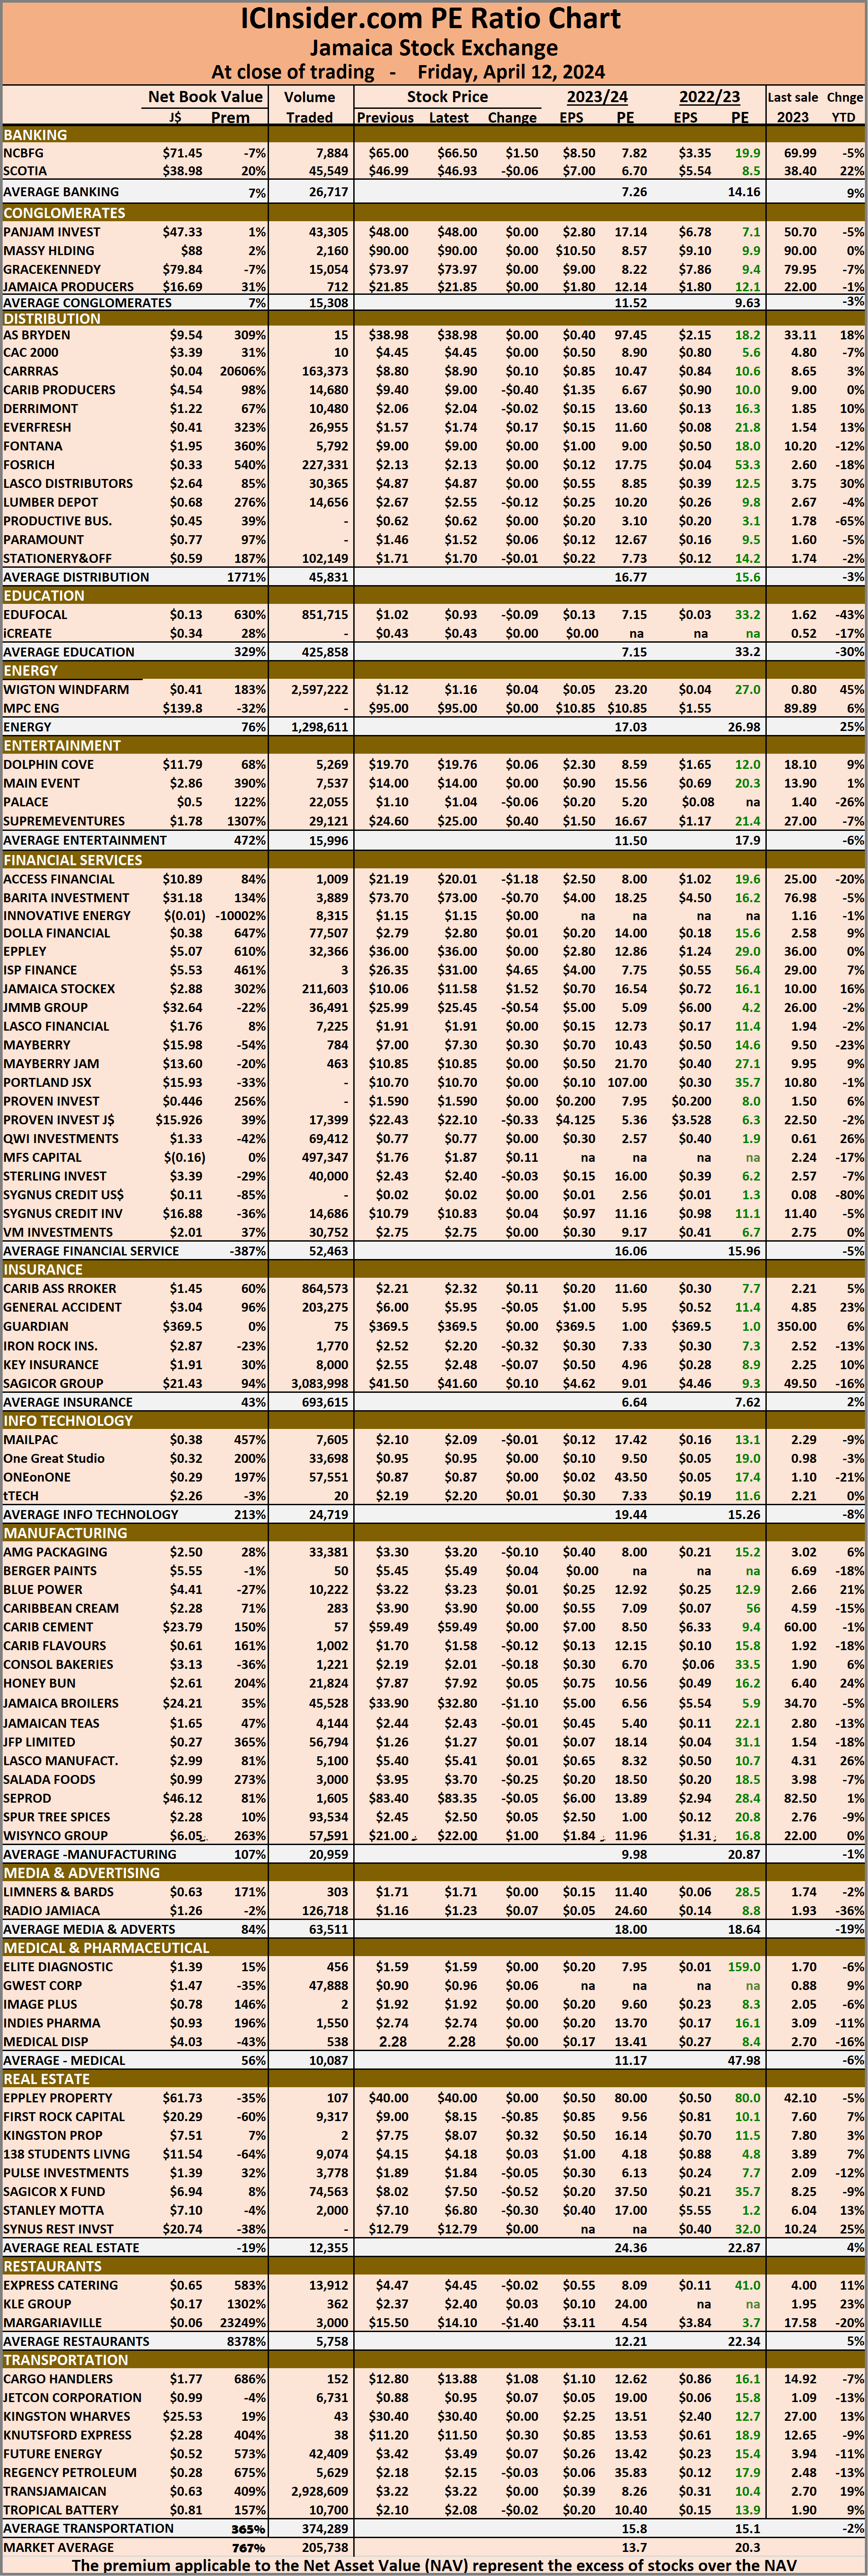 Investors who buy when the price of a stock is close to the average will find that they are not inclined to overpay for a stock.
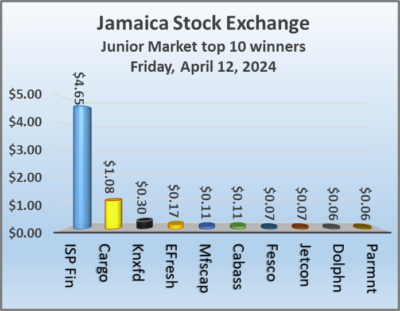 At the close of trading, the Junior Market Index climbed 28.47 points to wrap-up trading at 3,804.02.
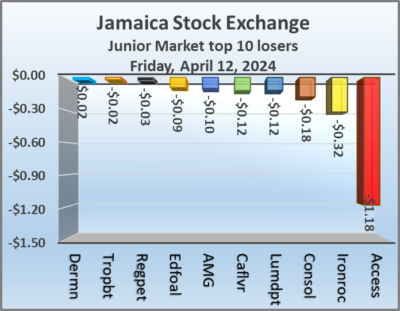 Investor’s Choice bid-offer indicator shows no stock ending with a bid higher than the last selling price and two with lower offers.
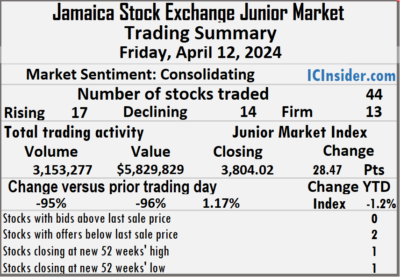 Honey Bun rose 5 cents and ended at a 52 weeks’ closing high of $7.92 after 21,824 shares were traded, Iron Rock Insurance lost 32 cents to finish at $2.20, with 1,770 units crossing the market, ISP Finance rose $4.65 to end at $31 after a transfer of a mere 3 stock units, Jetcon Corporation advanced 7 cents to close at 95 cents, with 6,731 stock units changing hands. Knutsford Express gained 30 cents to $11.50 in an exchange of 38 shares, Lumber Depot shed 12 cents to end at $2.55, after 14,656 stocks passed through the market and MFS Capital Partners popped 11 cents in closing at $1.87 after an exchange of 497,347 units.
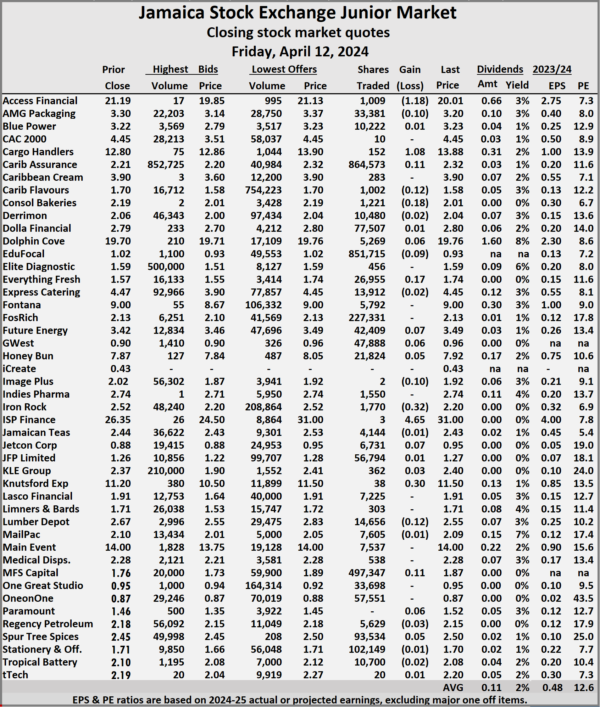 Prices of securities trading are those for the last transaction of each stock unless otherwise stated.