The total amount of funds entering the Jamaica Stock Exchange markets surged on Thursday over Wednesday but the Main and Junior markets suffered declines after opening up in the morning sessions but the JSE USD market inched higher.
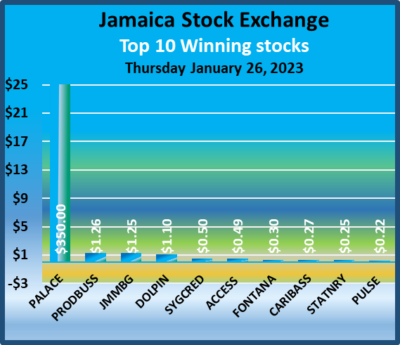 At the close of market action Palace Amusement surged to a record high of $3,250 after posting a gain of $350 as trading on the market ended with an exchange of 29,715,470 shares down from 44,186,085 units on Wednesday, with a value of $285.4 million from a mere $71.79 million on the previous day. Trading on the JSE USD market resulted in investors exchanging US$36,261 versus US$3,947 on Wednesday.
At the close, the Combined Market Index dropped 2,149.90 points to 351,278.98, the All Jamaican Composite Index lost 3,148.60 points to close at 383,016.56, the JSE Main Market Index declined 1,743.19 points to 338,349.97, the Junior Market dived 56.62 points to 3,884.06 and the JSE US dollar market popped 0.37 points to close at 199.46.
The market’s PE ratio ended at 22.2 based on 2021-22 earnings and 13.8 times those for 2022-23 at the close of trading.
 Investors need pertinent information to successfully navigate many investment options in the local stock market. The ICInsider.com PE ratio chart and the more detailed daily report charts provide investors with regularly updated information to help decision-making.
Investors should use the chart to help make rational investment decisions by investing in stocks close to the average for the sector and not going too far from it unless there are compelling reasons to do so. This approach helps to remove emotions from investment decisions and put in on fundamentals while at the same time not being too far from the majority of investors. Investors who buy when the price of a stock is close to the average will find that they are not inclined to overpay for a stock.
The ICInsider.com PE Ratio chart covers all ordinary shares on the Jamaica Stock Exchange. It shows companies grouped on an industry basis, allowing easy comparisons between the same sector companies and the overall market.
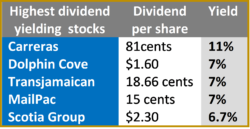
The net asset value of each company is reported as a guide to assess the value of stocks based on this measure quickly. The chart also shows daily changes in stock prices and the percentage year to date price movement based on the last traded prices. 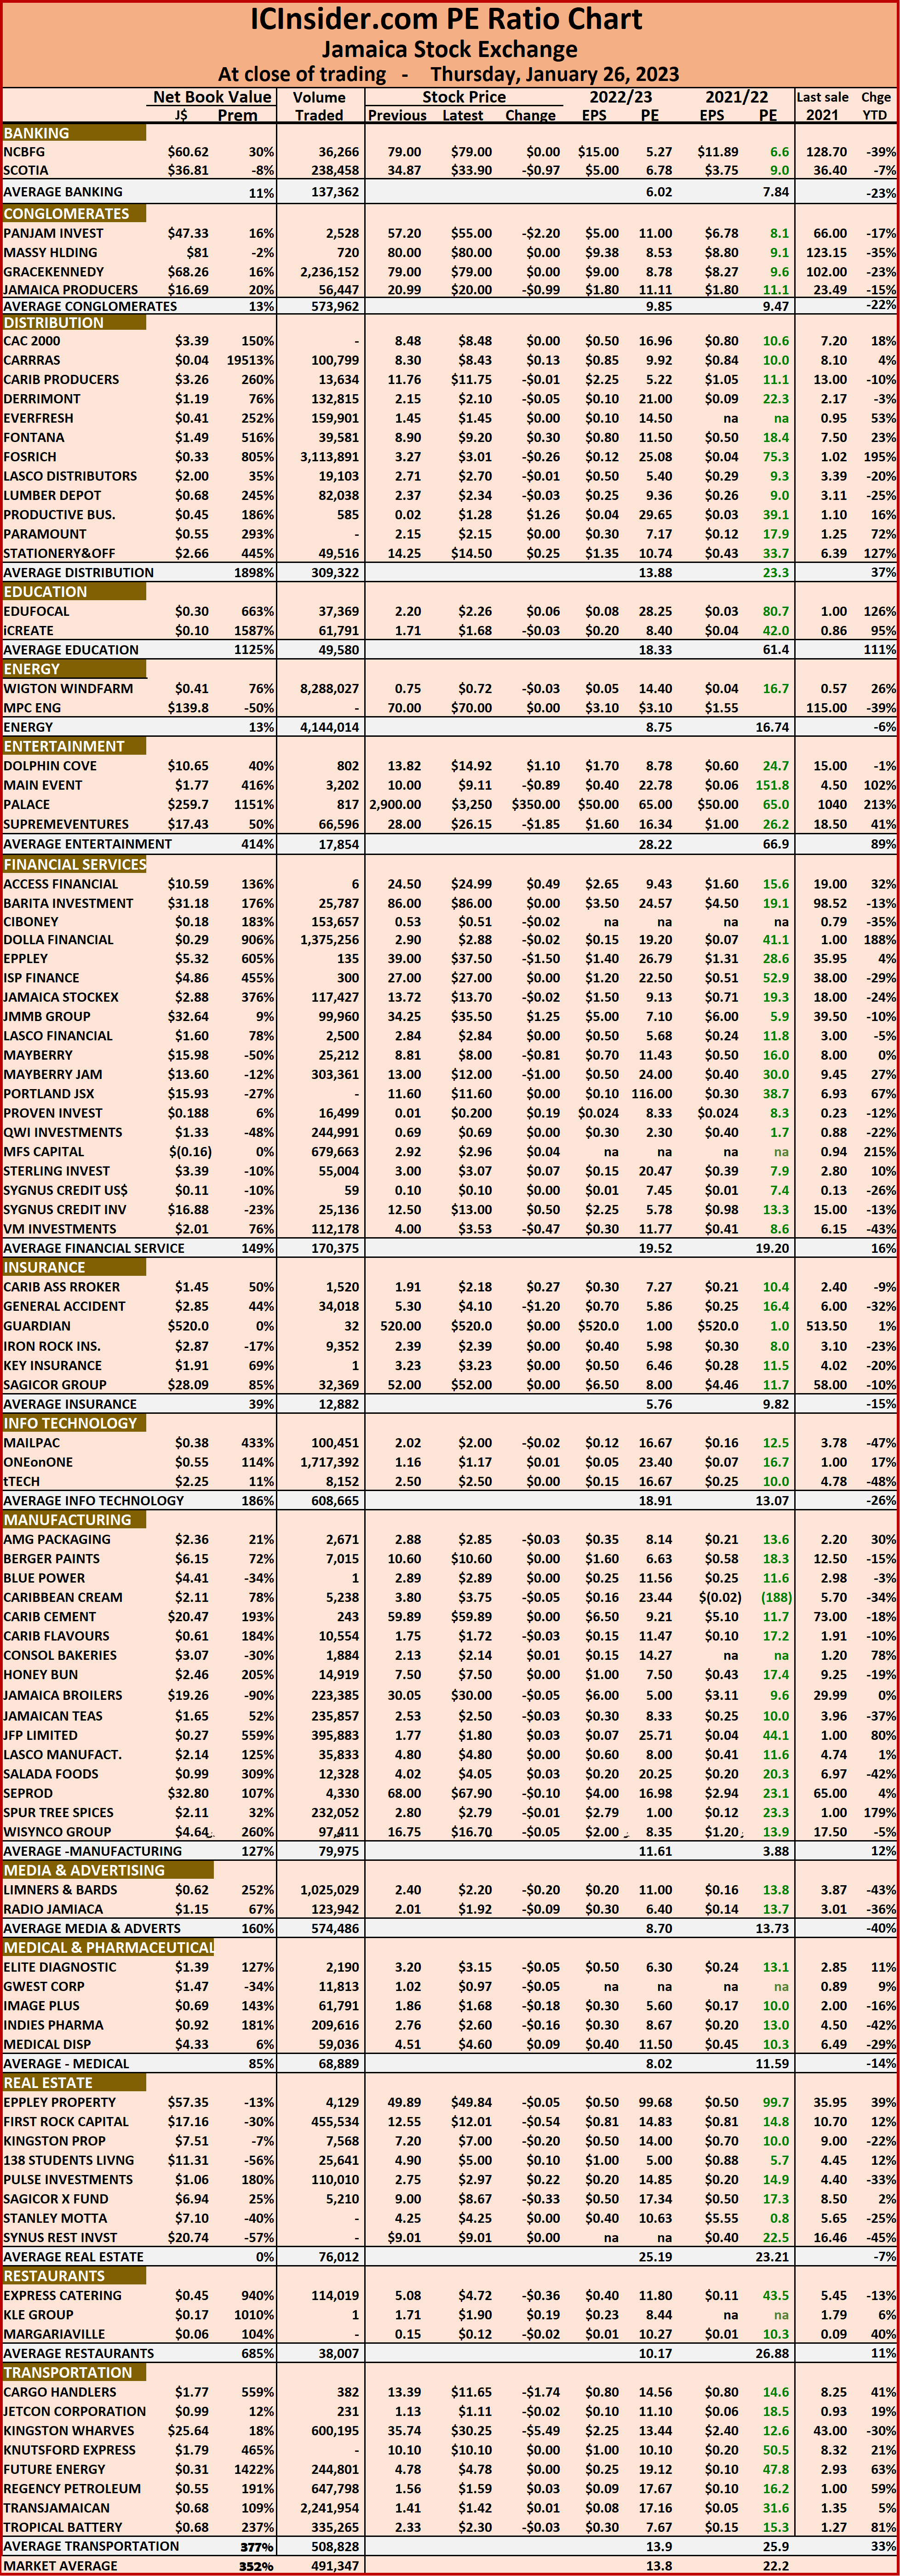 Dividends payable and yields for each company are shown in the Main and Junior Markets’ daily report charts that show the closing volume for the bids and offers.
The EPS & PE ratios are based on 2021 and 2022 actual or projected earnings, excluding major one off items. The PE Ratio is the most popular measure used to determine the value of stocks.
 A total of 32,907,198 shares were traded for $46,037,711 compared to 23,052,827 units at $45,065,813 on Tuesday.
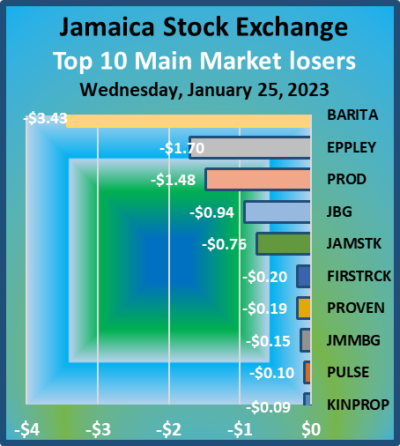 The PE Ratio, a formula to ascertain appropriate stock values, averages 15.1 on the Main Market. The JSE Main and USD Market PE ratios incorporate earnings forecasted by ICInsider.com for companies with the financial year ending between November 2022 and August 2023.
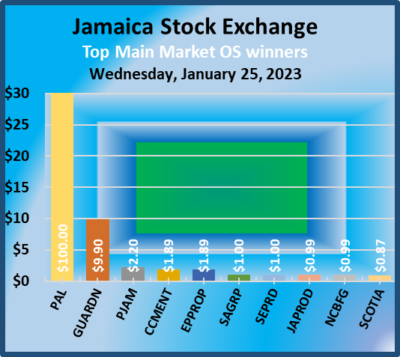
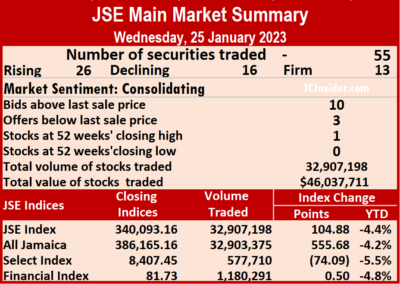 Jamaica Stock Exchange fell 76 cents to $13.72 after a transfer of 16,369 shares. Mayberry Investments advanced 74 cents to $8.81 in switching ownership of 504 units, NCB Financial rallied 99 cents to $79 in swapping 8,469 stock units, 138 Student Living gained 59 cents to finish at $4.90 trading 236 stocks. Palace Amusement climbed $100 to close at a 52 weeks’ high of $2,900 in transferring 832 stocks, PanJam Investment popped $2.20 to $57.20, with 250 units crossing the exchange, Proven Investments rose $1.48 in closing at $31.50 trading 1,539 stock units. Sagicor Group gained $1 to end at $52 with an exchange of 667 shares, Scotia Group popped 87 cents to $34.87 after an exchange of 32,403 units, Seprod rallied $1 to $68 with the swapping of 1,234 stock units.
 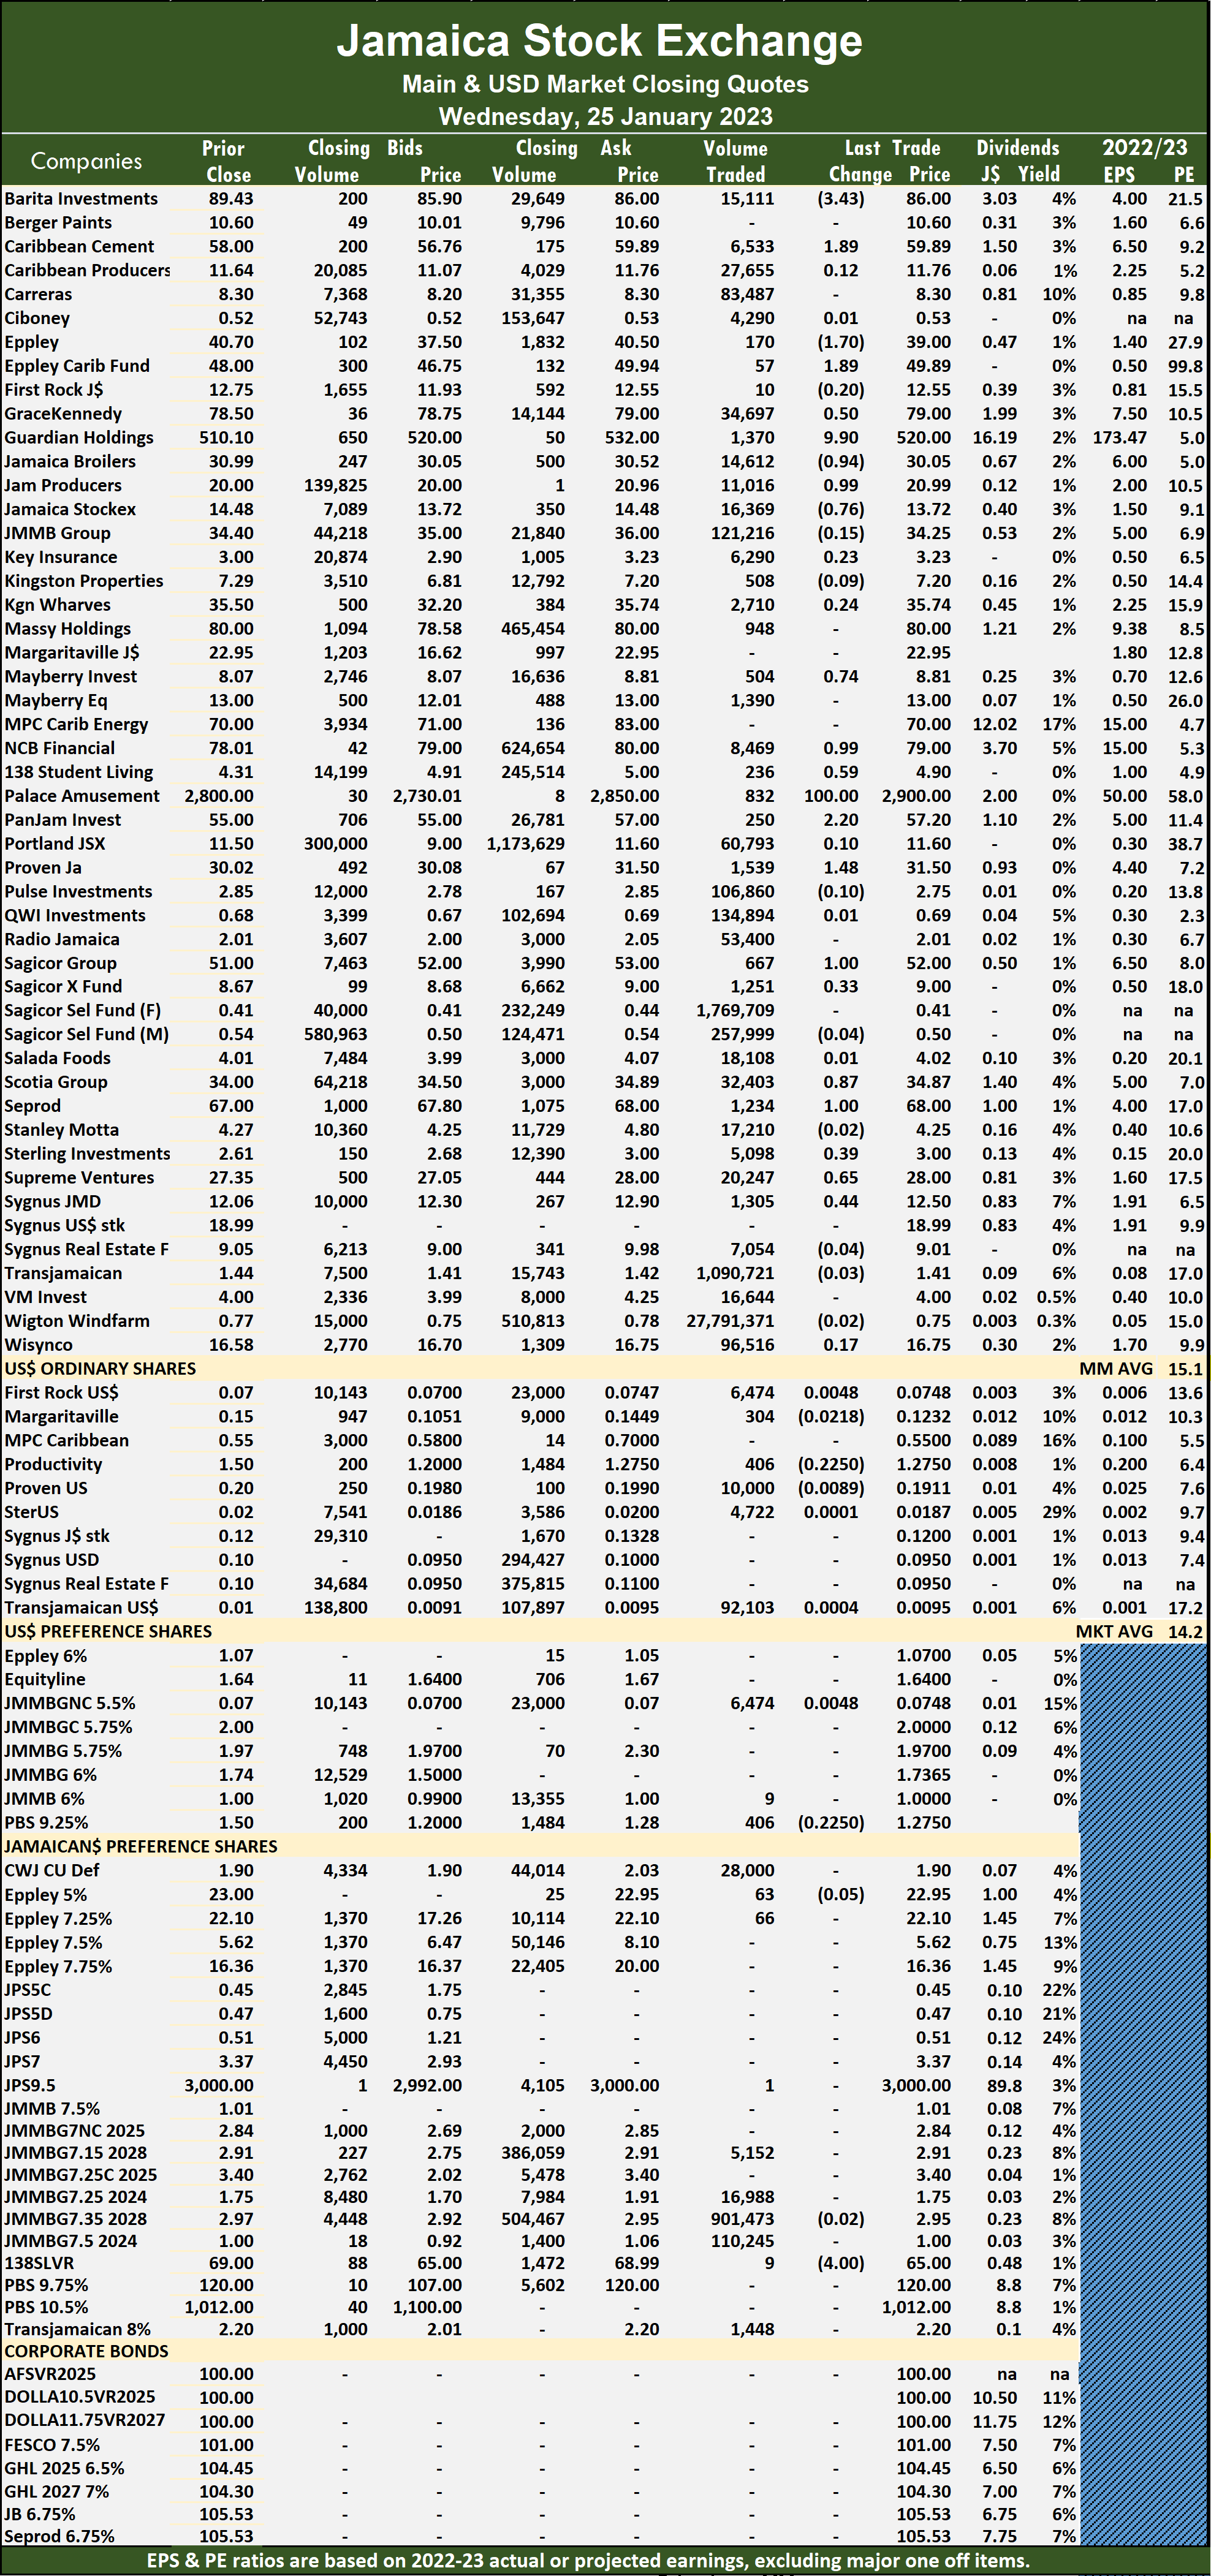 Supreme Ventures gained 65 cents to close at $28 in trading 20,247 stocks and Sygnus Credit Investments rallied 44 cents in closing at $12.50 with 1,305 shares crossing the market.
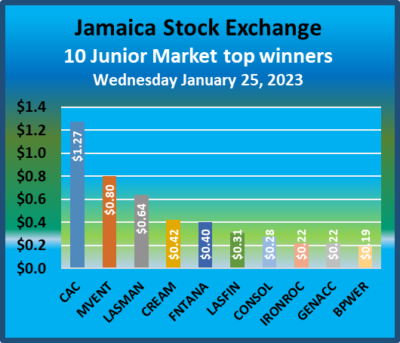 At the close, the Junior Market Index rose 35.91 points to settle at 3,940.68.
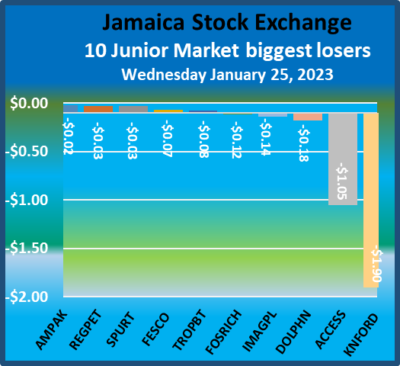 The PE Ratio, a measure of computing appropriate stock values, averages 12.9. The PE ratios of Junior Market stocks incorporate ICInsider.com projected earnings for the financial year ending that fall between November 2022 and August 2023.
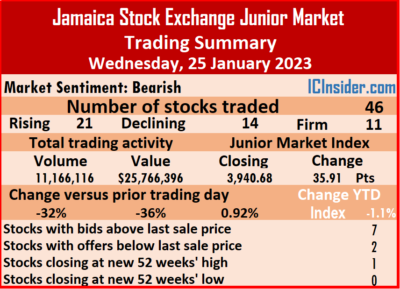 Express Catering gained 8 cents to end at $5.08 in switching ownership of 44,901 stock units, Fontana rallied 40 cents in ending at $8.90 in an exchange of 33,298 units. Fosrich fell 12 cents to $3.27 after 804,631 shares passed through the market, Future Energy Source lost 7 cents to end at $4.78 trading 476,514 stock units, General Accident rose 22 cents to close at $5.30 in exchanging 48,612 stocks. Iron Rock Insurance popped 22 cents in ending at $2.39 with 1,000 stock units being traded, Jetcon Corporation gained 7 cents in closing at $1.13, with 135,605 stocks changing hands, Knutsford Express fell $1.90 to $10.10 with the swapping of 20,344 shares. Lasco Distributors gained 15 cents in closing at $2.71 in exchanging 8,753 units, Lasco Financial advanced 31 cents to $2.84 in trading 3,105 units, and Lasco Manufacturing popped 64 cents to close at $4.80 with 57,968 shares changing hands.
 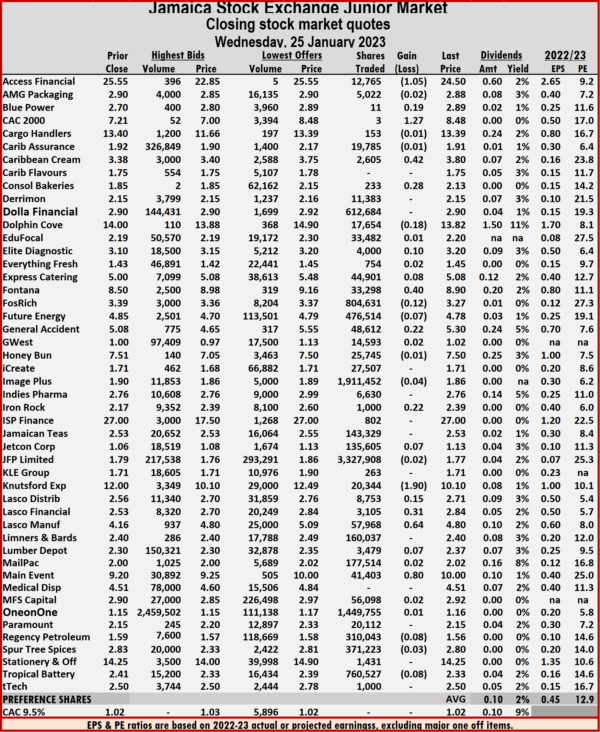 Lumber Depot rallied 7 cents in ending at $2.37 with an exchange of 3,479 stocks, Main Event rose 80 cents to $10 after clearing the market with 41,403 stock units and Tropical Battery lost 8 cents to end at $2.33 with a transfer of 760,527 units.
 Just 114,022 shares were traded for US$3,947 compared with 1,638,947 units at US$60,212 on Tuesday.
 Productive Business Solutions fell 22.5 cents to US$1.275 after 406 stock units crossed the market. Proven Investments lost 0.89 of a cent to end at 19.11 US cents, with 10,000 units changing hands, Sterling Investments rallied 0.01 of a cent to 1.87 US cents after 4,722 stocks changed hands and Transjamaican Highway climbed 0.04 of a cent to close at 0.95 of one US cent after 92,103 units were traded.
 Trading ended with an exchange of 44,186,085 shares up sharply from 41,010,941 units on Tuesday, with a value of $71.79 million just down from $85.24 million on the previous day. Trading on the JSE USD market resulted in investors exchanging US$3,947 versus US$60,212 on Tuesday.
 Investors need pertinent information to successfully navigate many investment options in the local stock market. The ICInsider.com PE ratio chart and the more detailed daily report charts provide investors with regularly updated information to help decision-making.
 The chart also shows daily changes in stock prices and the percentage year to date price movement based on the last traded prices. Dividends payable and yields for each company are shown in the Main and Junior Markets’ daily report charts that show the closing volume for the bids and offers.
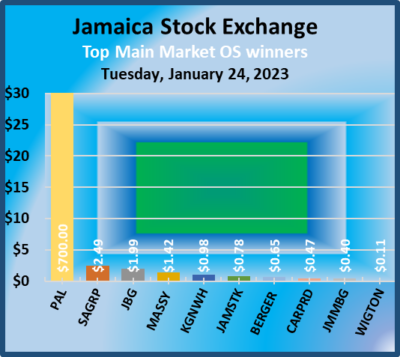 A total of 23,052,827 shares were traded for $45,065,813 up from 9,807,711 units at $34,195,444 on Monday.
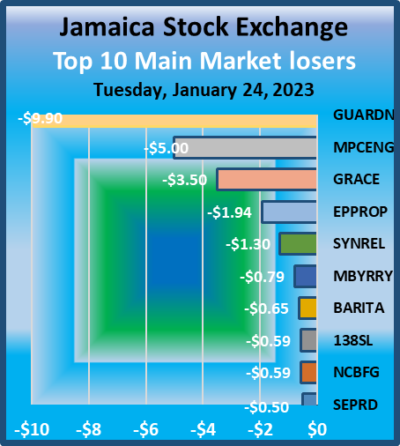 The PE Ratio, a formula to ascertain appropriate stock values, averages 14.6 for the Main Market. The JSE Main and USD Market PE ratios incorporate earnings forecasted by ICInsider.com for companies with the financial year ending between November 2022 and August 2023.
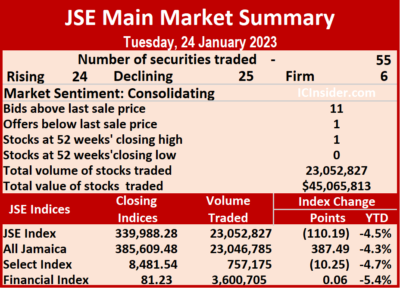 Jamaica Broilers advanced $1.99 to $30.99 in an exchange of 70,831 shares, Jamaica Stock Exchange gained 78 cents to settle at $14.48 after a transfer of 55,036 units. JMMB Group popped 40 cents to end at $34.40 with the swapping of 22,833 stocks, Kingston Wharves rallied 98 cents to end at $35.50 in switching ownership of 520 stock units, Massy Holdings advanced $1.42 to $80 in trading 1,106 shares. Mayberry Investments shed 79 cents to end at $8.07 after 714 stocks cleared the market, MPC Caribbean Clean Energy declined $5 in closing at $70 in transferring 580 shares, NCB Financial lost 59 cents to close at $78.01 in an exchange of 60,001 units. 138 Student Living dipped 59 cents to $4.31 as investors traded 312 stock units, Palace Amusement climbed $700 to a 52 weeks’ high of $2,800 with a transfer of 2,676 stocks, with shareholders voting at the annual general meeting held after trading closed to spill the stock 600 to one in late February, Sagicor Group advanced $2.49 to end at $51 in switching ownership of 21,332 shares.
 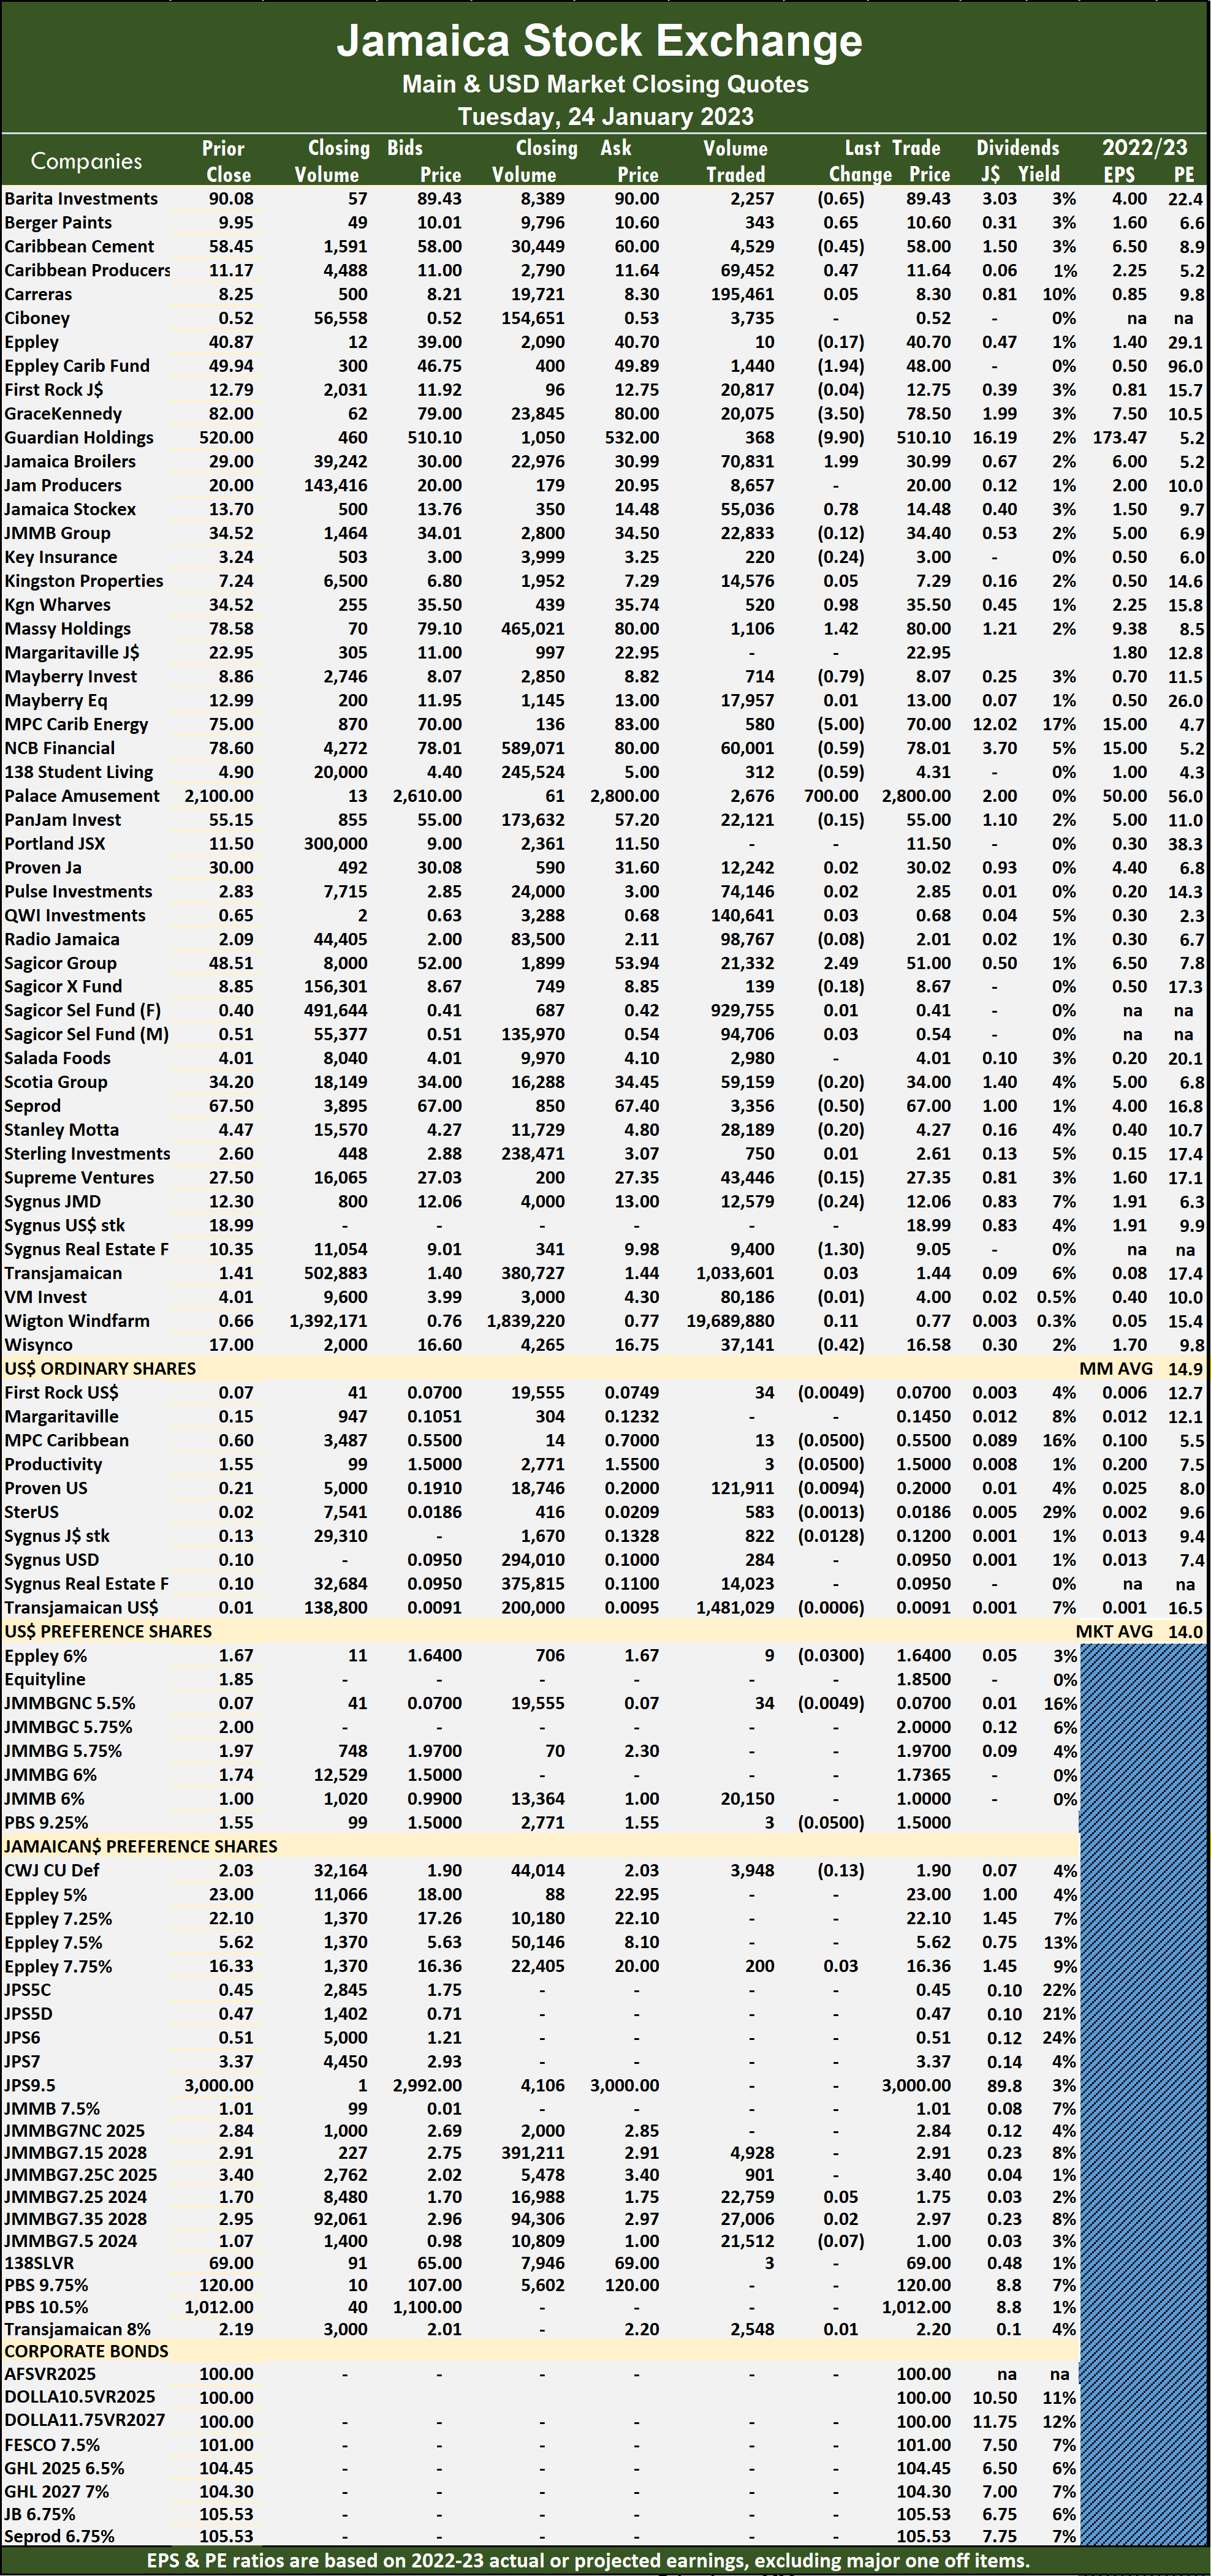 Seprod lost 50 cents in closing at $67 after 3,356 units passed through the market, Sygnus Real Estate Finance fell $1.30 to close at $9.05 with the swapping of 9,400 stock units and Wisynco Group dipped 42 cents to close at $16.58 after exchanging 37,141 shares.
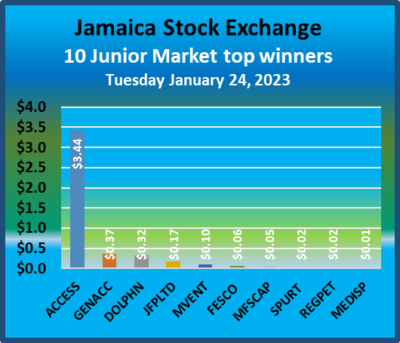 A total of 16,319,167 shares were exchanged for $40,158,085 compared with 15,746,039 units at $40,681,154 on Monday.
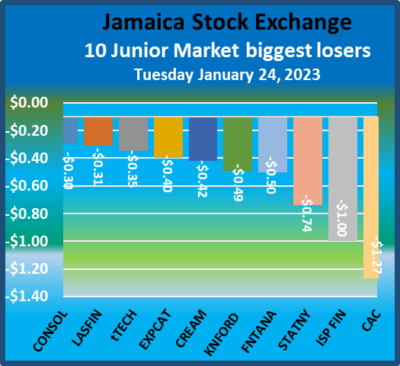 The PE Ratio, a measure of computing appropriate stock values, averages 12.6. The PE ratios of Junior Market stocks incorporate ICInsider.com projected earnings for the financial year ending that fall between November 2022 and August 2023.
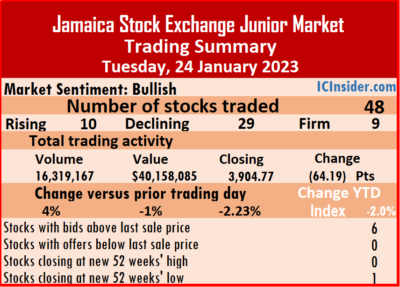 Fosrich lost 15 cents in ending at $3.39 trading 1,163,398 shares, General Accident rose 37 cents to end at $5.08 after a transfer of 23,988 units, GWest Corporation lost 9 cents to finish at $1 with an exchange of 18,833 stocks. Image Plus Consultants dipped 10 cents to an all time low of $1.90 in switching ownership of 6,233,417 shares, Indies Pharma shed 19 cents in closing at $2.76 with 6,218 stocks changing hands, Iron Rock Insurance fell 23 cents to $2.17 after 381 units crossed the market. ISP Finance declined $1 to close at $27 with investors transferring 33 stock units, JFP Ltd gained 17 cents in ending at $1.79 with an exchange of 474,334 stocks, Knutsford Express declined 49 cents in closing at $12 after 9,100 units cleared the market. Lasco Financial dropped 31 cents to end at $2.53 as investors exchanged 86,710 stock units, Limners and Bards dipped 17 cents to $2.40 in trading 5,620 shares, Lumber Depot lost 16 cents after ending at $2.30 in switching ownership of 70,202 units. Main Event rallied 10 cents to $9.20 with a transfer of 24,720 stocks,
 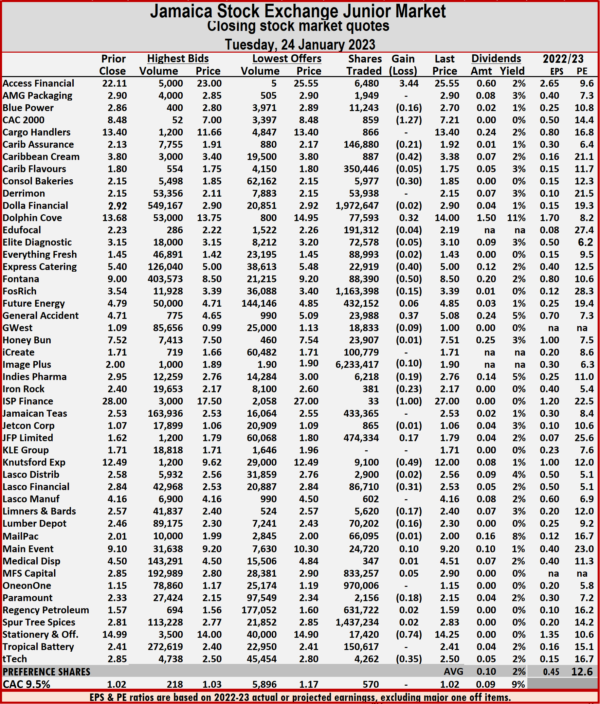 Paramount Trading shed 18 cents in closing at $2.15 in an exchange of 2,156 shares, Stationery and Office Supplies dropped 74 cents to end at $14.25 while trading 17,420 stock units and tTech fell 35 cents to close at $2.50 with investors transferring 4,262 shares.
 Trading ended with an exchange of 1,638,947 shares for US$60,212 from 163,158 units at US$18,456 on Monday.
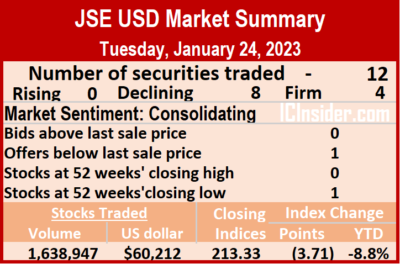 Sygnus Credit Investments USD share remained at 9.5 US cents with the swapping of 284 units, Sygnus Real Estate Finance USD share ended at 9.5 US cents in switching ownership of 14,023 stocks and Transjamaican Highway lost 0.06 of a cent to end at 0.91 of one US cents after finishing trading of 1,481,029 shares.
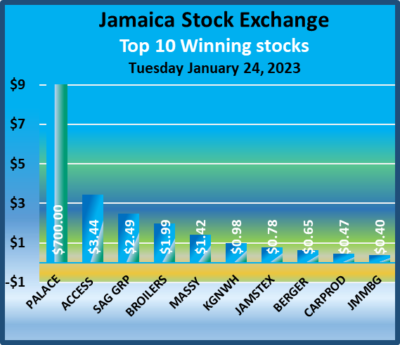 Trading ended with an exchange of 41,010,941 shares up sharply from 25,716,908 units on Monday, with a value of $85.24 million compared to $74.88 million on the previous day. Trading on the JSE USD market resulted in investors exchanging US$60,212 versus US$18,456 on Monday.
 Investors need pertinent information to successfully navigate many investment options in the local stock market. The ICInsider.com PE ratio chart and the more detailed daily report charts provide investors with regularly updated information to help decision-making.
 The net asset value of each company is reported as a guide to assess the value of stocks based on this measure quickly. The chart also shows daily changes in stock prices and the percentage year to date price movement based on the last traded prices. Dividends payable and yields for each company are shown in the Main and Junior Markets’ daily report charts that show the closing volume for the bids and offers.
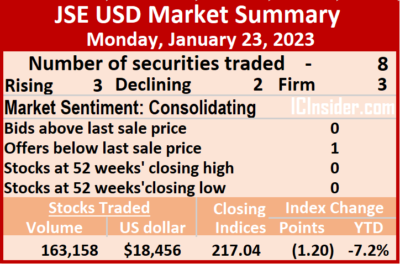 Sterling Investments remained at 1.99 US cents, with 3,500 stock units crossing the exchange. Sygnus Real Estate Finance USD share dropped 1.48 cents to end at 9.5 US cents, with 3,119 stocks being traded and Transjamaican Highway climbed 0.06 of a cent in closing at 0.97 US cents after a transfer of 102,490 stock units.