The Jamaican Stock Exchange gained at the close of trading on Thursday with the JSE Combined Index a measure of the overall market, rising just 129.07 points to 379,670.69. Trading ended, with 9,794,268 shares changing hands with a value of a mere $44.35 million, up from $91.4million, with trading 17,041,040 shares in the overall market on the prior trading day. The JSE USD market ended with the value of stocks traded at US$76,534.
 At the close, the All Jamaican Composite Index rose 1,075.26 points to 417,929.17, the JSE Main Index dropped 225.41 points to close at 366,974.17, the Junior Market Index rose 37.78 points to 4064.12 and the JSE USD market Index dipped 0.40 points to 194.73.
The market’s PE ratio ended at 23.2 based on 2021-22 earnings and 12.4 times those for 2022-23 at the close of trading.
Investors need pertinent information to successfully navigate many investment options in the local stock market. The ICInsider.com PE ratio chart and the more detailed daily report charts provide investors with regularly updated information to help decision-making.
Investors should use the chart to help make rational investment decisions by investing in stocks close to the average for the sector and not going too far from it unless there are compelling reasons to do so. This approach helps to remove emotions from investment decisions and put in on fundamentals while at the same time not being too far from the majority of investors. Investors who buy when the price of a stock is close to the average will find that they are not inclined to overpay for a stock.
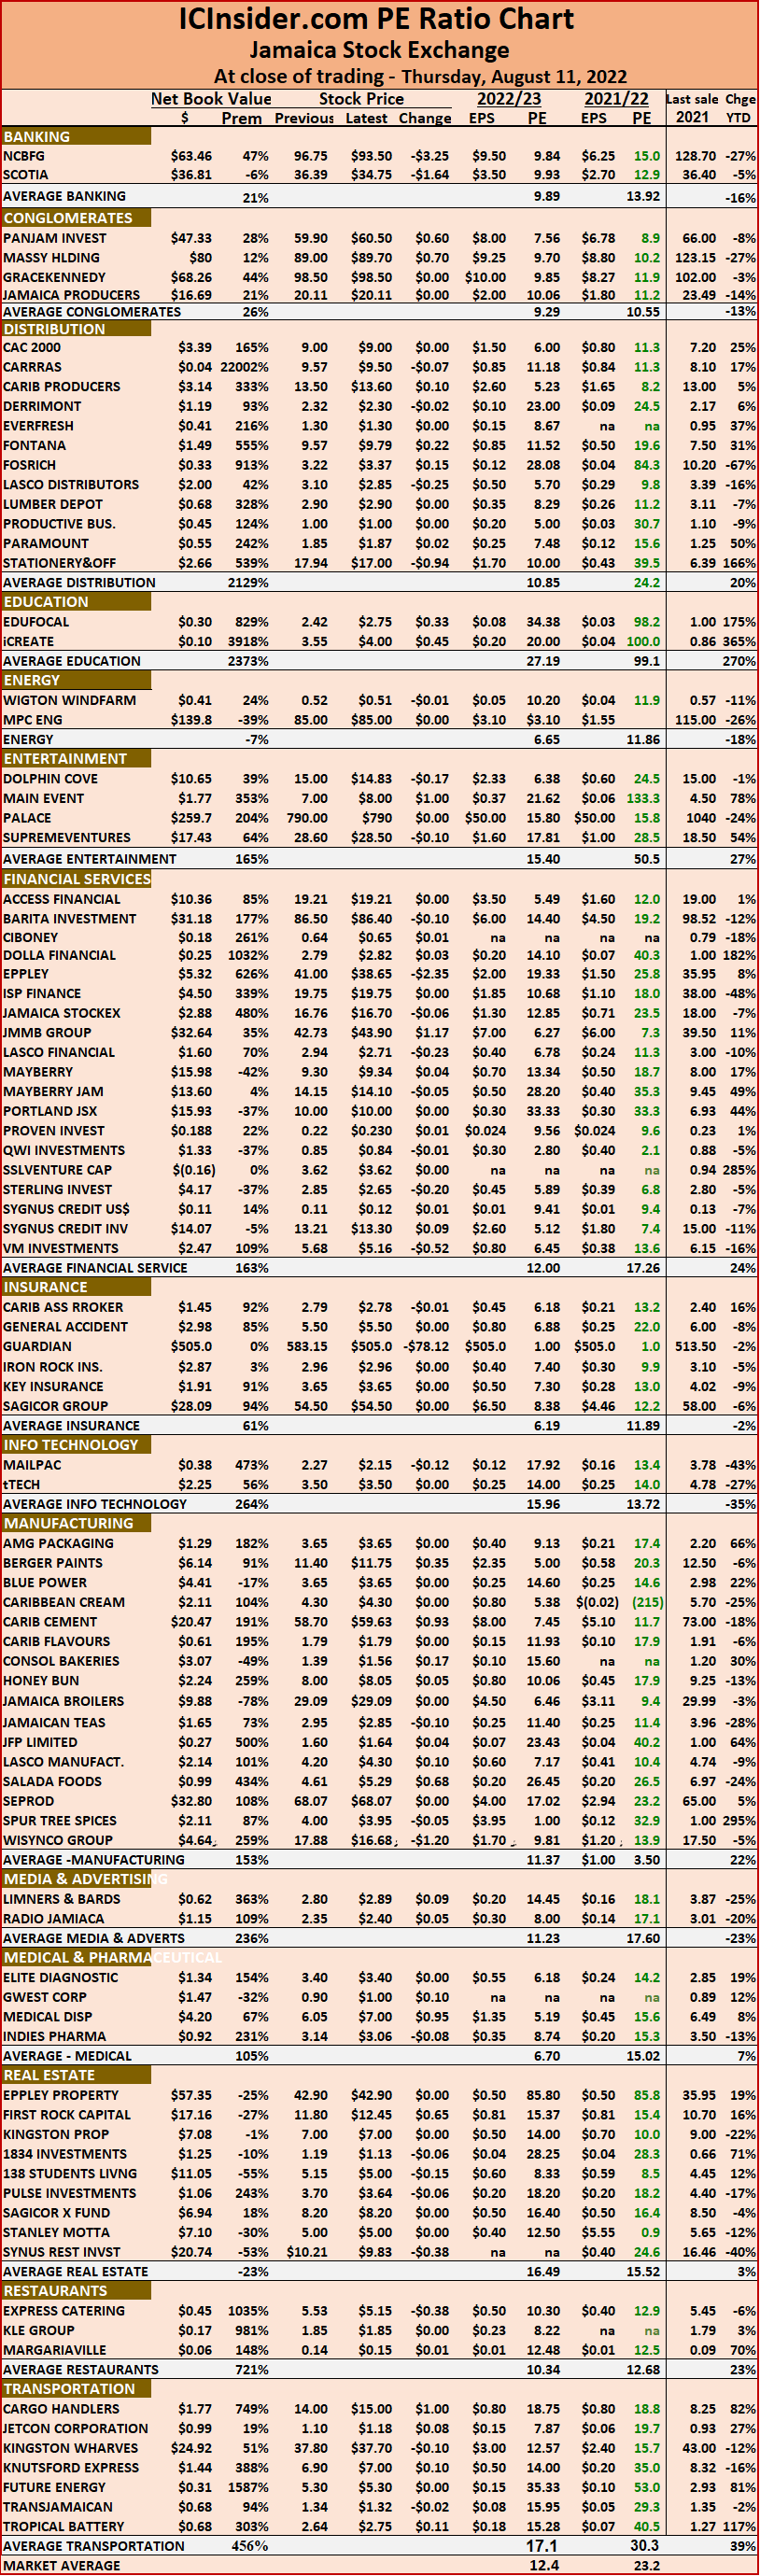 The ICInsider.com PE Ratio chart covers all ordinary shares on the Jamaica Stock Exchange. It shows companies grouped on an industry basis, allowing easy comparisons between the same sector companies and the overall market.
The net asset value of each company is reported as a guide to assess the value of stocks based on this measure quickly. The chart also shows daily changes in stock prices and the percentage year to date price movement based on the last traded prices. Dividends payable and yields for each company are shown in the Main and Junior Markets’ daily report charts that show the closing volume for the bids and offers.
The EPS & PE ratios are based on 2021 and 2022 actual or projected earnings, excluding major one off items. The PE Ratio is the most popular measure used to determine the value of stocks.
 The JSE US Denominated Equities Index lost 0.37 points to end at 195.13.
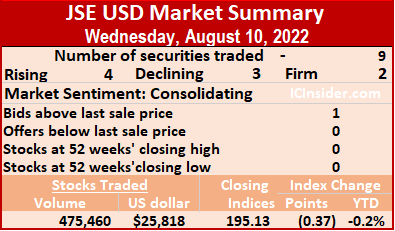 Sterling Investments rose 0.03 of a cent to 2 US cents, after trading 414 shares, Sygnus Credit Investments USD share dropped 0.89 of one cent to 11.11 US cents while exchanging 156,871 stock units. Sygnus Real Estate Finance USD share rallied 2 cents in closing at 12.5 US cents in switching ownership of 5,150 stocks and Transjamaican Highway lost 0.01 of a cent in ending at 0.88 of one US cent after 200,000 units changed hands.
 Trading ended with 57 securities compared to 55 on Tuesday, with 21 rising, 24 declining and 12 ending unchanged. At the close, the All Jamaican Composite Index shed 3,397.23 points to 416,853.91, the JSE Main Index dropped 1,624.03 points to close at 367,199.58 and the JSE Financial Index dipped 0.27 points to settle at 87.90.
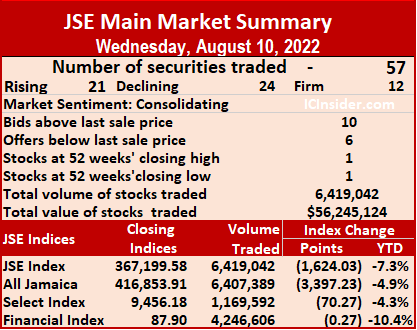 The PE Ratio, a formula to ascertain appropriate stock values, averages 13.7 for the Main Market. The JSE Main and USD Market PE ratios are computed based on ICInsider.com’s forecasted earnings for companies with financial years ending up to the close of August 2023.
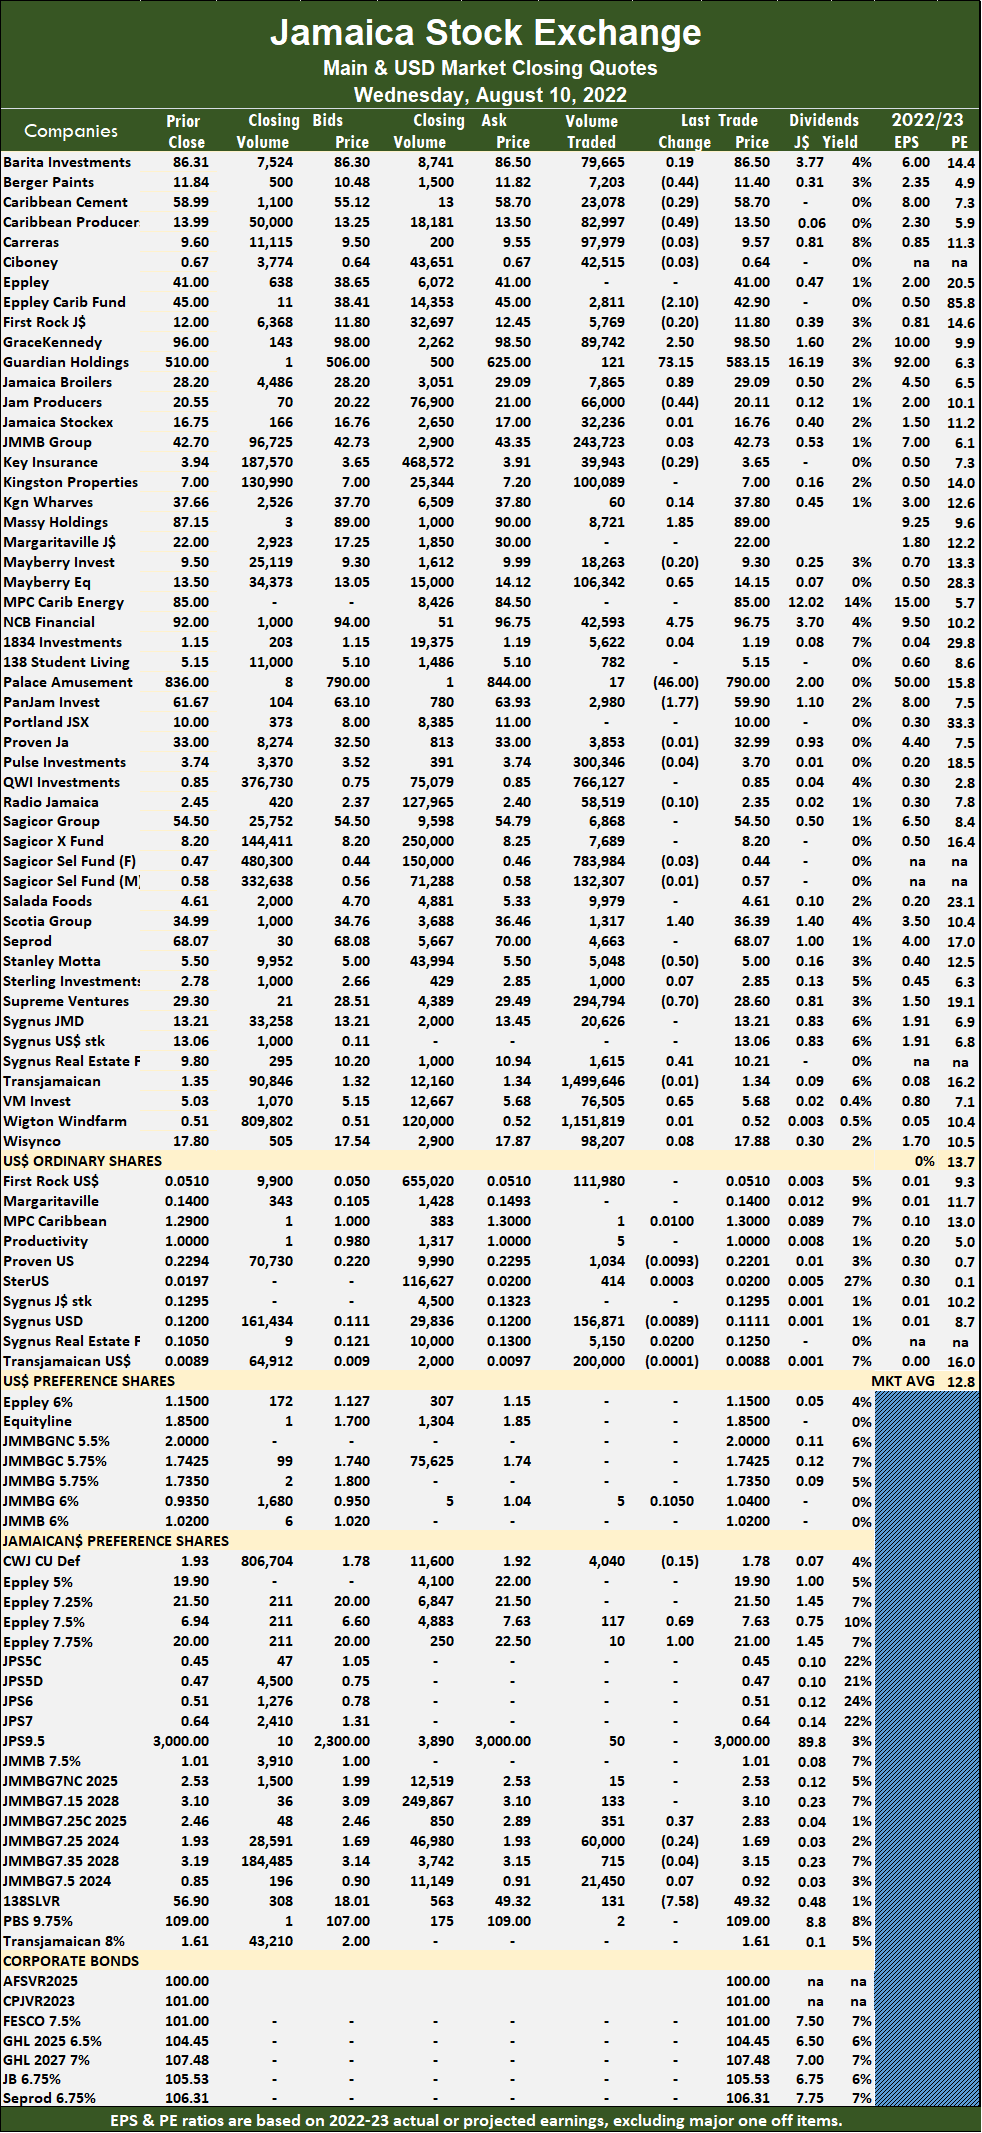 Scotia Group popped $1.40 to end at $36.39 with the swapping of 1,317 stock units, Stanley Motta dropped 50 cents to $5, with 5,048 stocks crossing the market, Supreme Ventures declined 70 cents to close at $28.60 in exchanging 294,794 shares. Sygnus Real Estate Finance popped 41 cents in closing at $10.21, with 1,615 units clearing the market and Victoria Mutual Investments advanced 65 cents to close at $5.68 in trading 76,505 stocks.
 Market activity led to 42 securities trading down from 44 on Tuesday and ended with 12 rising, 21 declining and nine unchanged.
 Investor’s Choice bid-offer indicator shows five stocks ended with bids higher than their last selling prices and two with lower offers.
 Jamaican Teas rallied 30 cents in closing at $2.95 in an exchange of 1,851,771 stock units, Lasco Manufacturing lost 35 cents in ending at $4.20 with an exchange of 57,063 stocks, Lumber Depot declined 10 cents to end at $2.90, with 133,266 units changing hands. Main Event advanced 90 cents to close at $7 after exchanging 25,517 units and Stationery and Office Supplies increased 44 cents to $17.94 in trading 12,919 stocks.
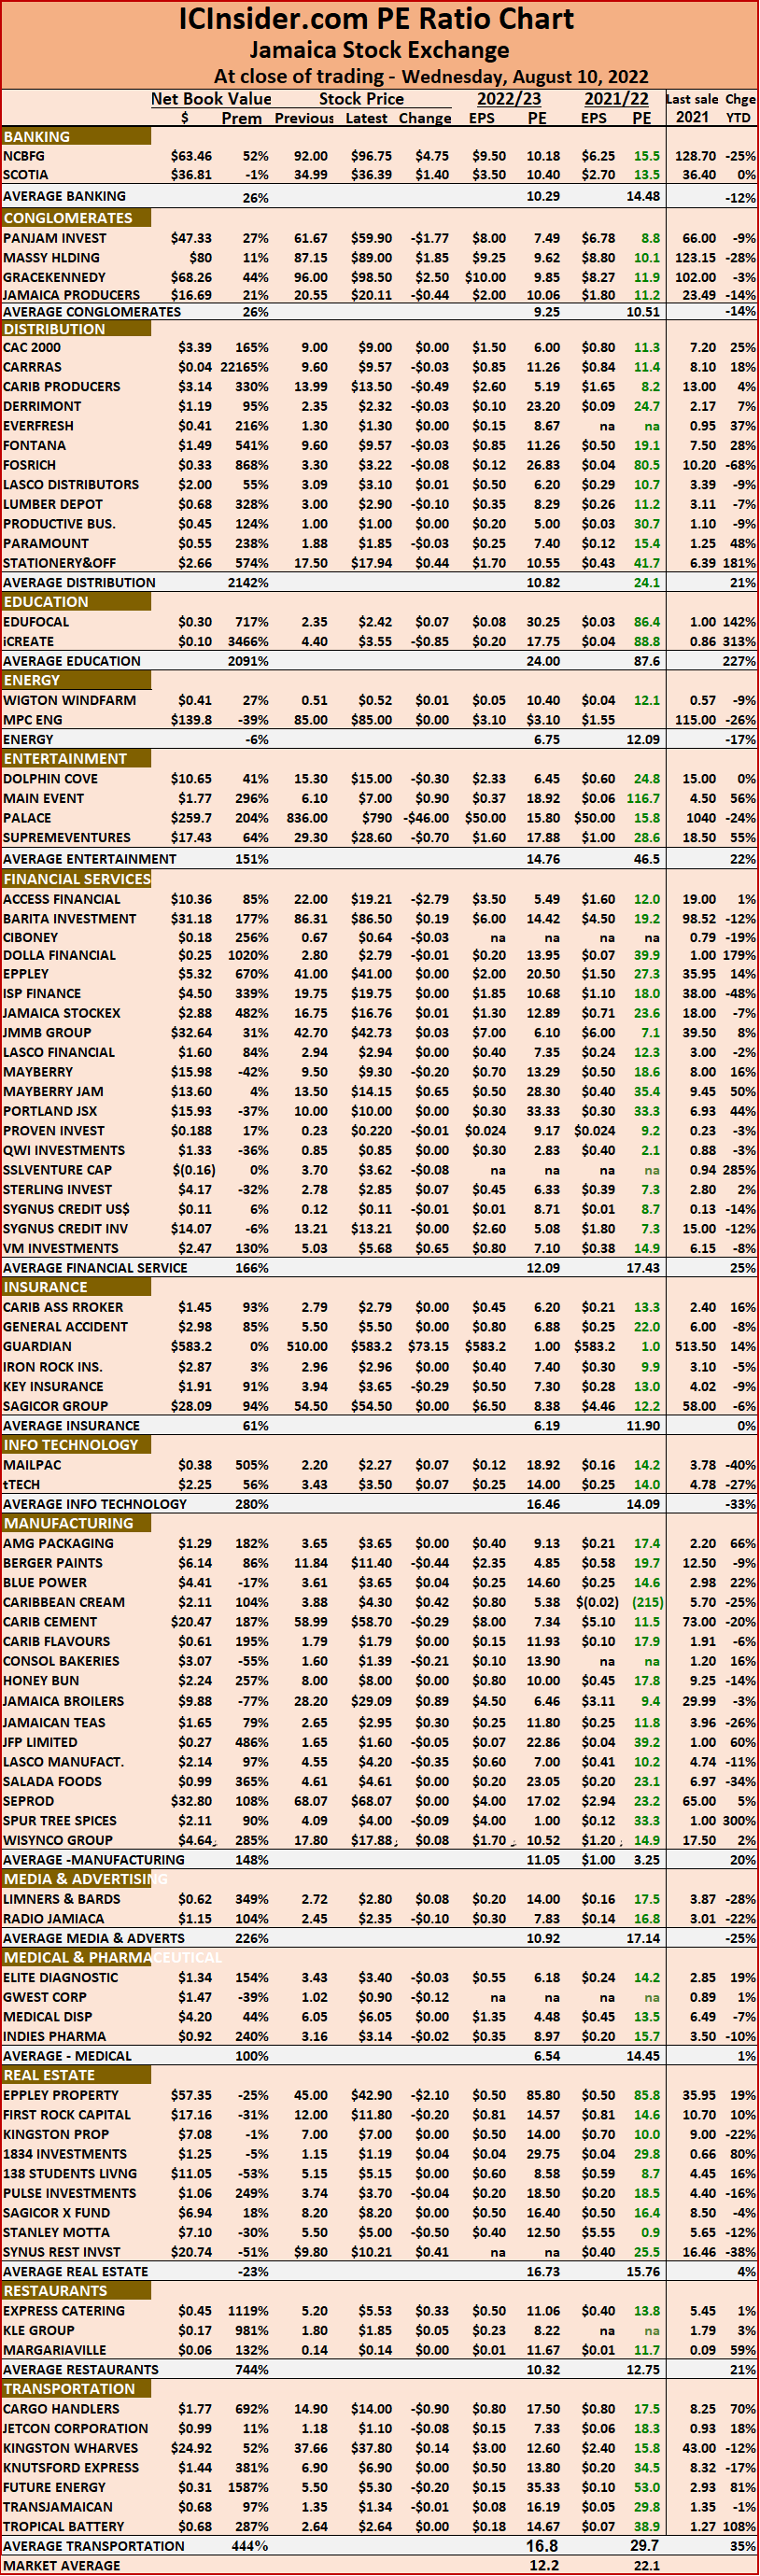 The ICInsider.com PE Ratio chart covers all ordinary shares on the Jamaica Stock Exchange. It shows companies grouped on an industry basis, allowing easy comparisons between the same sector companies and the overall market.
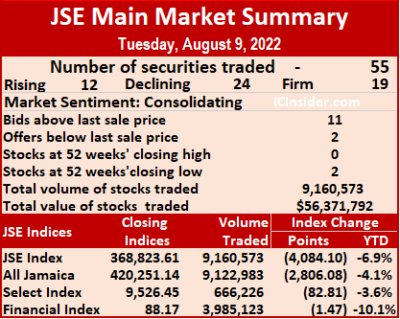 The JSE Main and USD Market PEs are computed using ICInsider.com’s forecasted earnings for companies with financial years ending up to the close of August 2023.
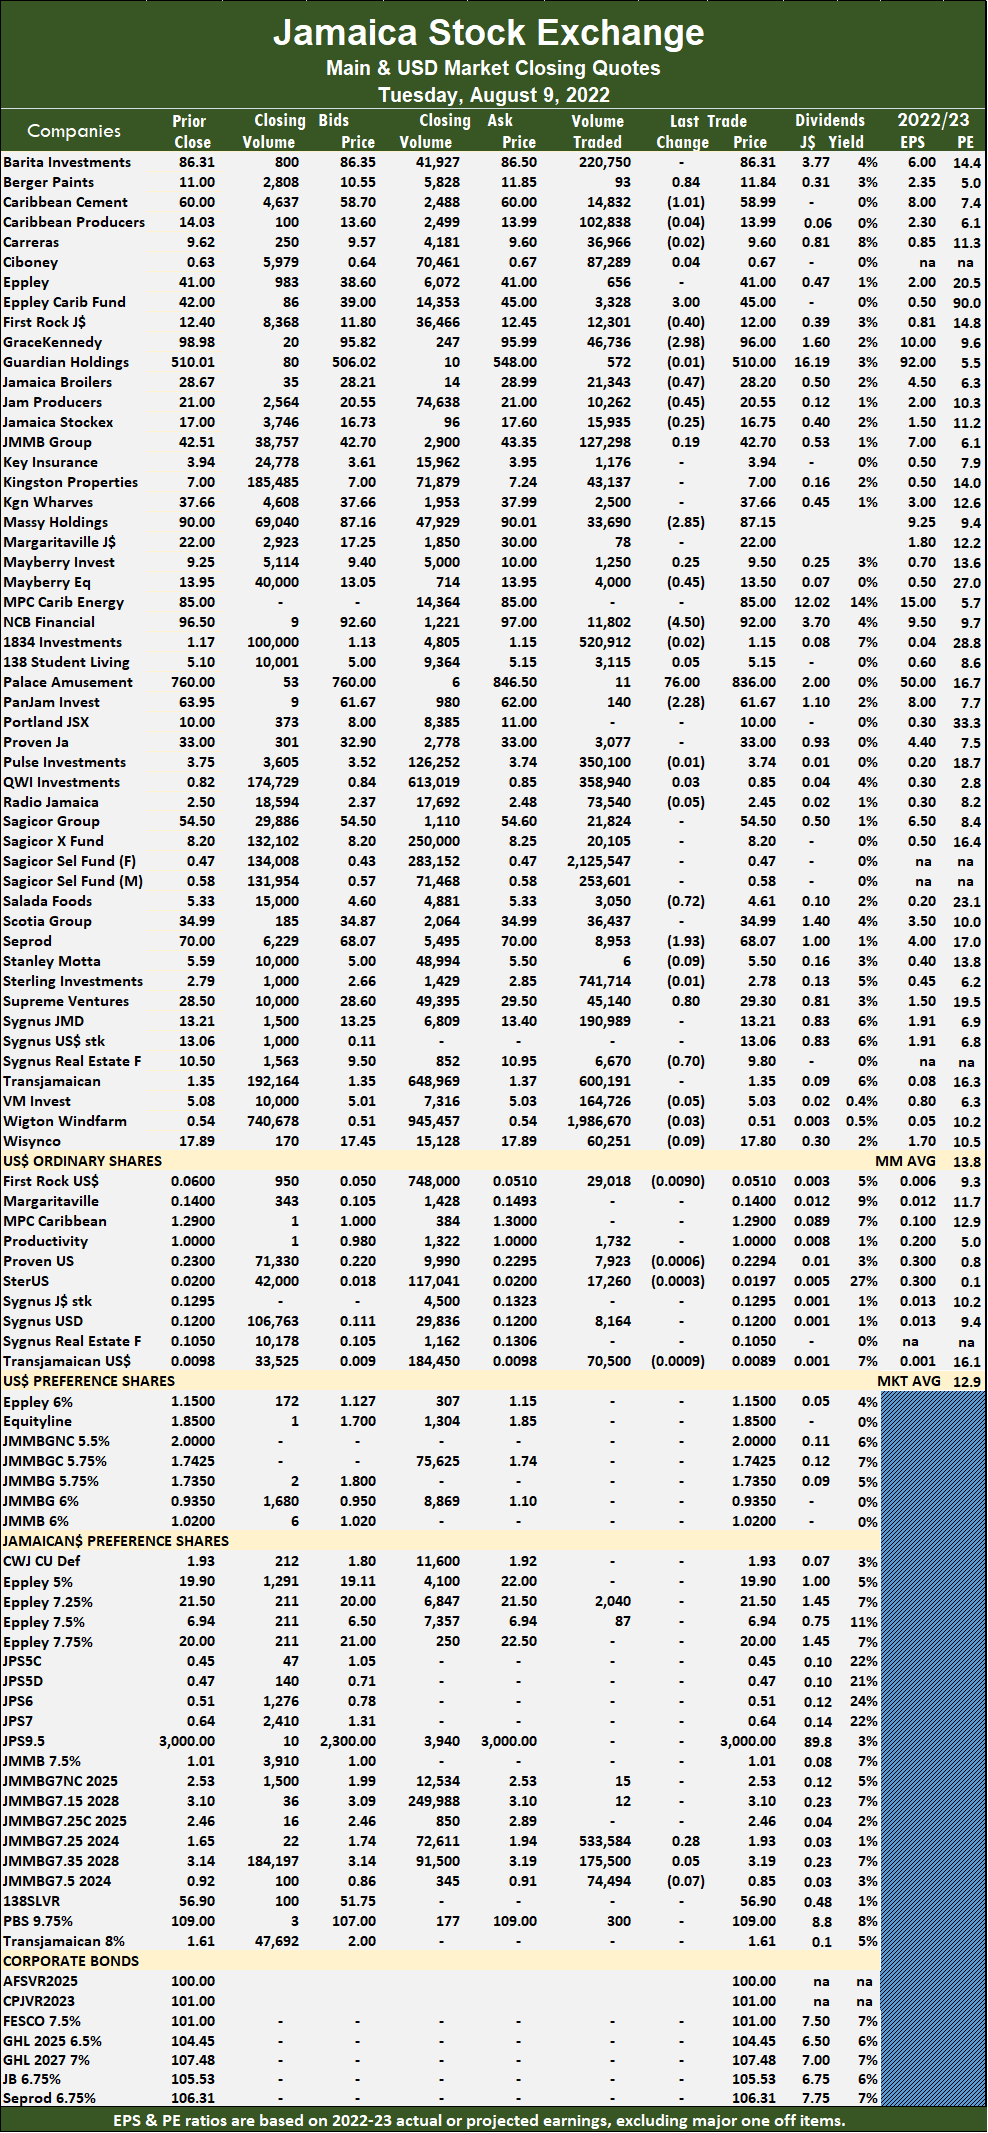 PanJam Investment traded 140 units and fell $2.28 to $61.67, Salada Foods fell 72 cents to $4.61 after exchanging 3,050 stock units, Seprod traded 8,953 shares and lost $1.93 and closed at $68.07, Supreme Ventures rose 80 in closing at $29.30 in trading 45,140 stocks and Sygnus Real Estate Finance fell 70 cents in ending at a 52 weeks’ low of $9.80, with 6,670 units clearing the market.
 Overall, 134,622 shares traded for US$7,099 compared to 148,446 units at US$51,199 on Monday. Trading averaged 19,232 units at US$1,014, compared to 16,494 shares at US$5,689 on Monday, with a month to date average of 19,369 shares at US$5,790 in line with 19,390 units at US$6,533 on the previous day. July ended with an average of 49,665 units for US$3,449.
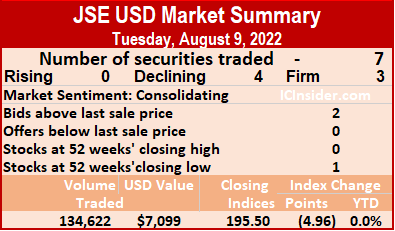 Productive Business Solutions closed at US$1 after trading 1,732 stocks, Proven Investments shed 0.06 of a cent to end at 22.94 US cents, with 7,923 stock units crossing the market. Sterling Investments fell 0.03 of a cent in closing at 1.97 US cents, with 17,260 units changing hands, Sygnus Credit Investments USD share finished at 12 US cents in trading 8,164 units and Transjamaican Highway fell 0.09 of a cent to 0.89 of one US cent, with an exchange of 70,500 stocks.
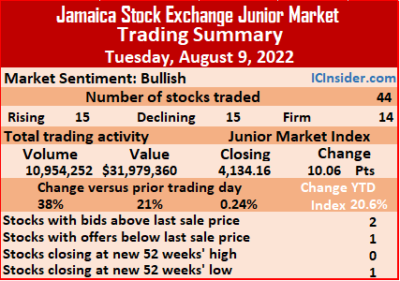 At the close, the Junior Market Index rose 10.06 points to settle at 4,134.16.
 iCreate gained 10 cents in ending at $4.40 while exchanging 364,128 units, KLE Group lost 30 cents after ending at $1.80 after trading 4,495 stock units, Mailpac Group fell 11 cents to close at $2.20 after exchanging 739,265 shares. Main Event declined $1.07 to end at $6.10 and closed with an exchange of 13,170 shares, SSL Venture popped 14 cents to $3.70, with 16,855 stock units changing hands and Stationery and Office Supplies dropped 50 cents in closing at $17.50, with 37,085 stocks crossing the exchange.
 Trading ended, with 20,249,447 shares changing hands with a value of a mere $88.35 million, up from $84.2 million, with trading 18,824,696 shares in the overall market on the last trading day. The JSE USD market ended with the value of stocks traded at US$7,099.
 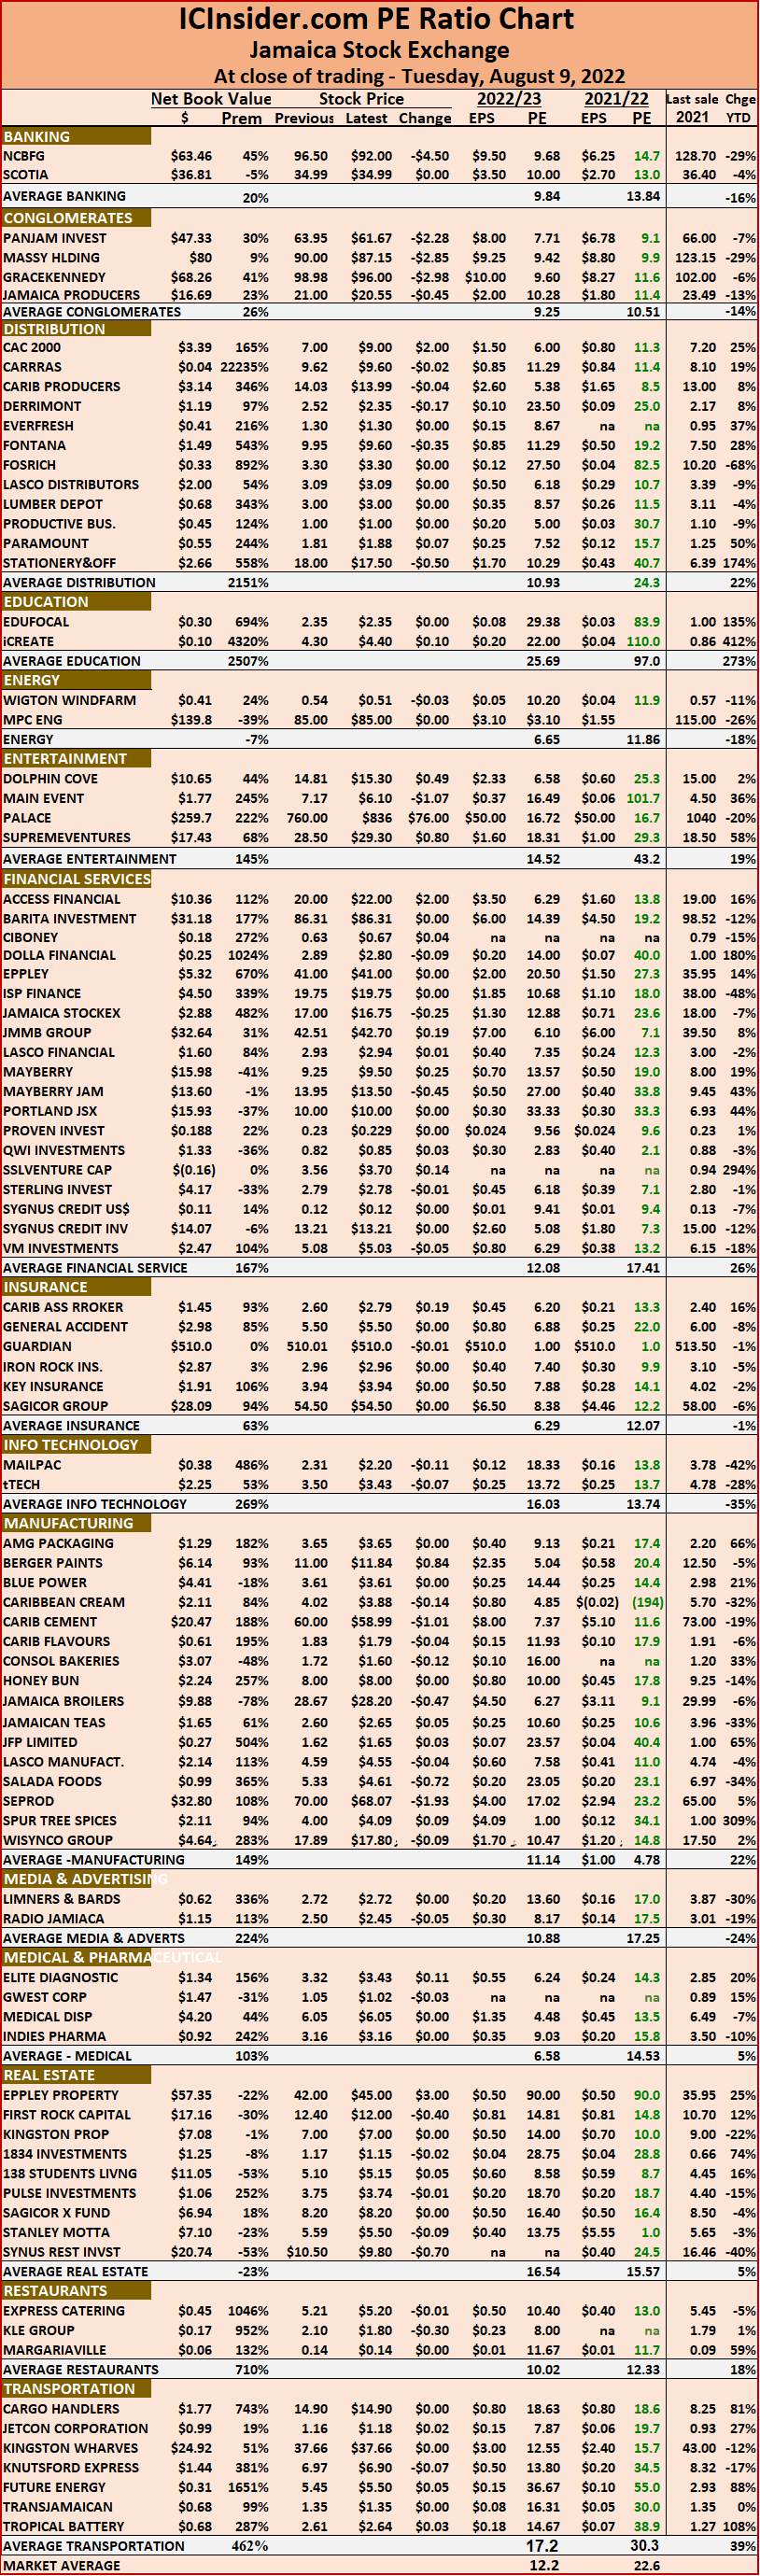 The ICInsider.com PE Ratio chart covers all ordinary shares on the Jamaica Stock Exchange. It shows companies grouped on an industry basis, allowing easy comparisons between the same sector companies and the overall market.
 At the close, AMG Packaging shed 20 cents in ending at $3.65 while exchanging 18,567 shares, CAC 2000 fell 50 cents to $7 in trading 6,647 stock units, Cargo Handlers gained 95 cents to end at a 52 weeks’ high of $14.90, with 2,731 stocks changing hands. Caribbean Assurance Brokers advanced 10 cents to close at $2.60 in exchanging 94,353 units, Consolidated Bakeries rose 32 cents to $1.72 with an exchange of 478,898 stock units, Dolphin Cove popped 21 cents to close at $14.81 with the swapping of 52,223 stocks. Elite Diagnostic dropped 13 cents in ending at $3.32, with 25,389 shares clearing the market, Express Catering lost 38 cents to end at $5.21 as 53,200 units changed hands, Fontana declined 25 cents in closing at $9.95 after exchanging 46,770 stocks. Future Energy Source shed 14 cents to end at $5.45 in exchanging 468,925 shares, Honey Bun dropped 11 cents to close at $8 in trading 30,486 stock units, iCreate lost 20 cents to end at $4.30, with 190,479 units crossing the market.
  Lumber Depot climbed 10 cents to $3 in switching ownership of 187,906 units, Mailpac Group fell 14 cents in closing at $2.31 after 135,639 stocks crossed the exchange, Medical Disposables declined $1.15 to $6.05 trading 6,931 stock units. SSL Venture shed 79 cents to end at $3.56, with 449,140 shares crossing the market and Stationery and Office Supplies lost 40 cents to close at $18 in finishing the transfer of 54,587 shares.


