The JSE Main Market index surged sharply on Thursday, while the Junior Market rose moderately and the US dollar market index suffered a sharp reversal after the Jamaica Stock Exchange closed.
 Trading ended, with an exchange of 19,368,737 shares from 32,490,607 units on Wednesday, with a value of $113.6 million versus $98 million on the previous day. The JSE USD market ended with the value of stocks traded amounting to US$42,021 up from US$14,629 on Wednesday.
At the close, the Combined Market Index jumped 5,958.87 points to 363,545.56, the All Jamaican Composite Index surged 9,926.38 points to 394,215.77, the JSE Main Index rose 6,090.77 points to 351,223.81, the Junior Market Index climbed 30.17 points to 3,911.55 and the JSE US dollar market dropped 26.46 points to 231.58.
The market’s PE ratio ended at 22.4 based on 2021-22 earnings and 13.3 times those for 2022-23 at the close of trading.
Investors need pertinent information to successfully navigate many investment options in the local stock market. 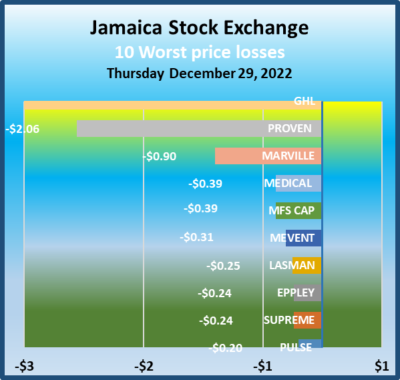 The ICInsider.com PE ratio chart and the more detailed daily report charts provide investors with regularly updated information to help decision-making.
Investors should use the chart to help make rational investment decisions by investing in stocks close to the average for the sector and not going too far from it unless there are compelling reasons to do so. This approach helps to remove emotions from investment decisions and put in on fundamentals while at the same time not being too far from the majority of investors. Investors who buy when the price of a stock is close to the average will find that they are not inclined to overpay for a stock.
The ICInsider.com PE Ratio chart covers all ordinary shares on the Jamaica Stock Exchange. It shows companies grouped on an industry basis, allowing easy comparisons between the same sector companies and the overall market.
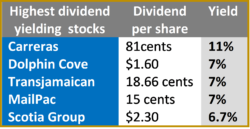
The net asset value of each company is reported as a guide to assess the value of stocks based on this measure quickly. The chart also shows daily changes in stock prices and the percentage year to date price movement based on the last traded prices. 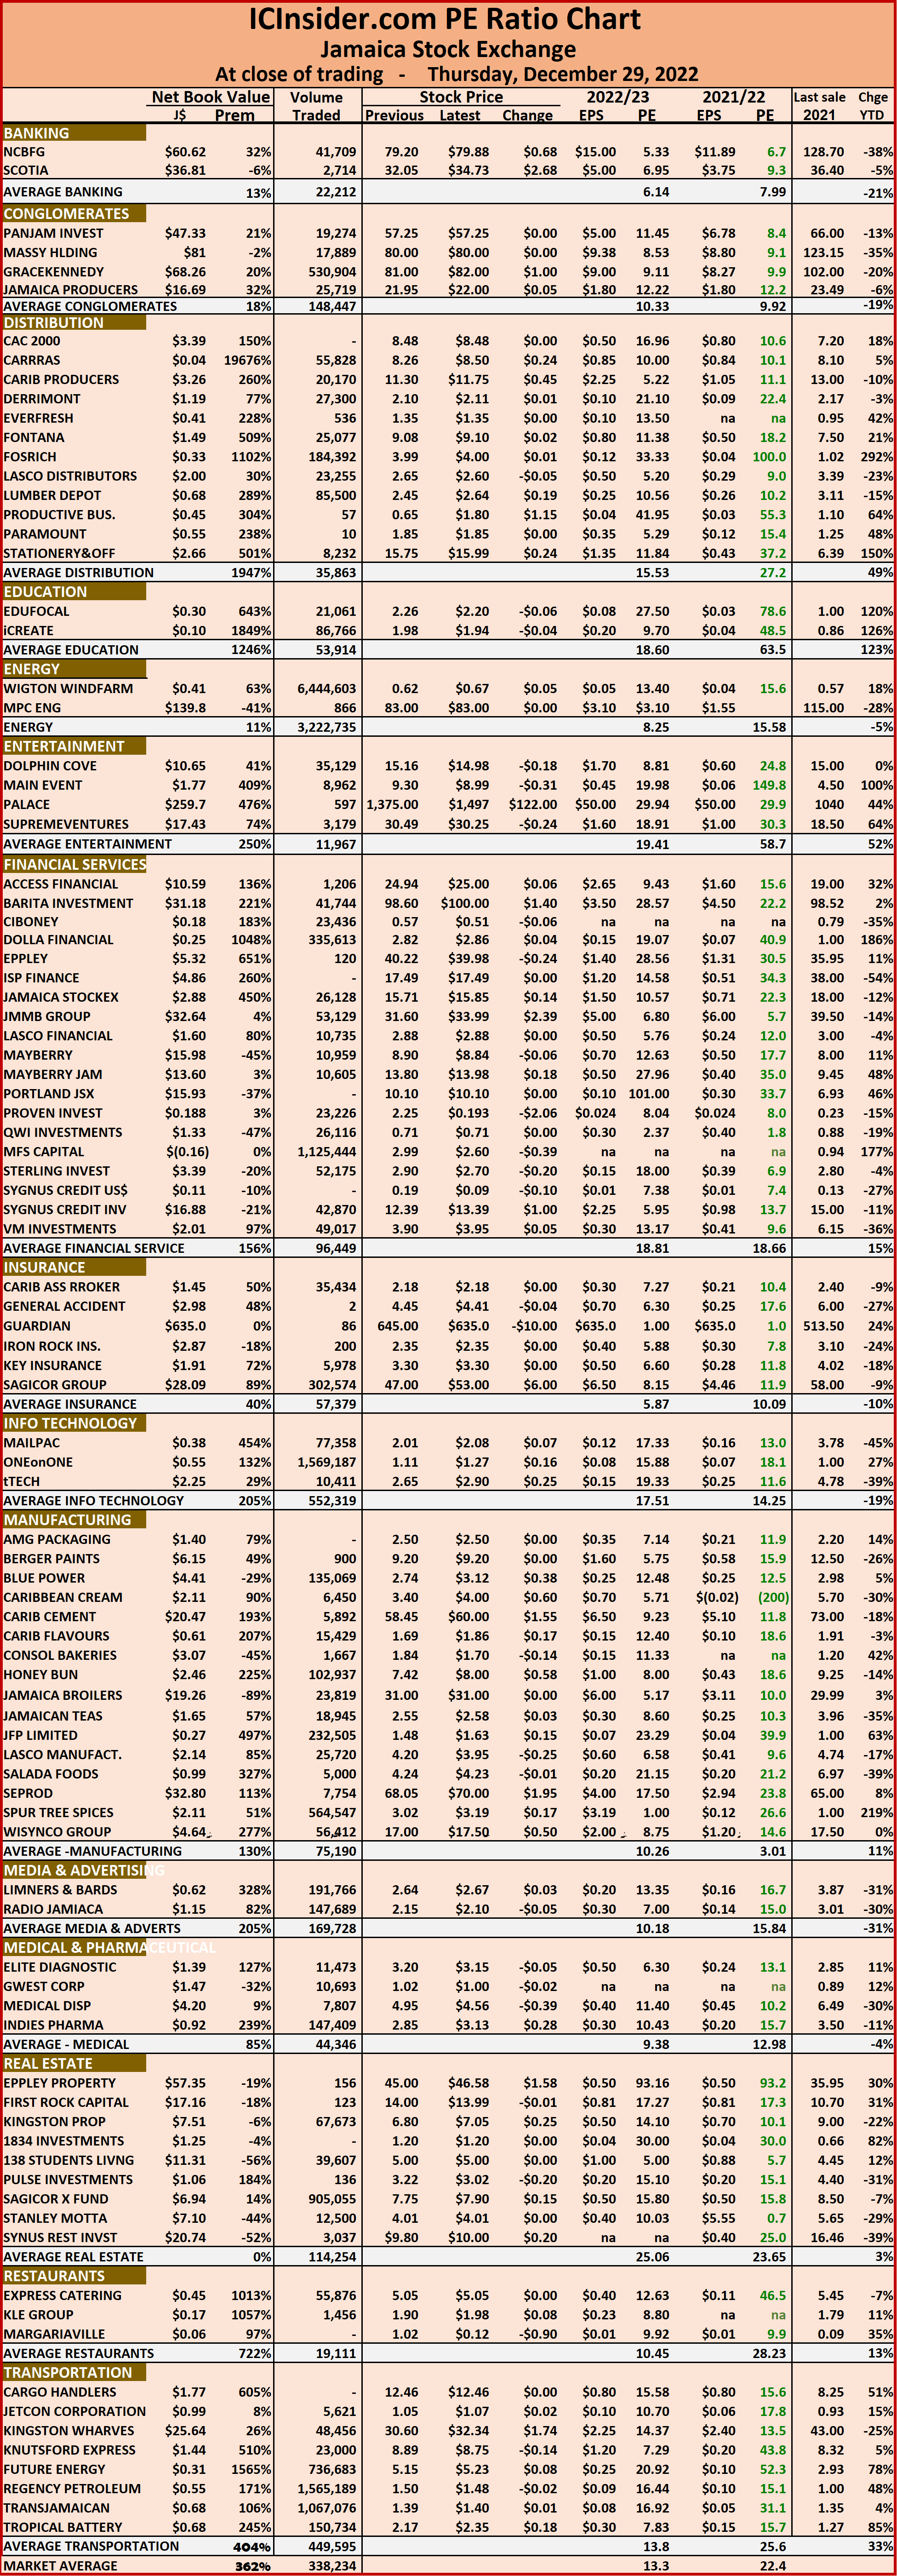 Dividends payable and yields for each company are shown in the Main and Junior Markets’ daily report charts that show the closing volume for the bids and offers.
The EPS & PE ratios are based on 2021 and 2022 actual or projected earnings, excluding major one off items. The PE Ratio is the most popular measure used to determine the value of stocks.
 A total of 22,138,197 shares were traded for $73,392,960 compared with 21,211,534 units at $157,346,195 last Friday.
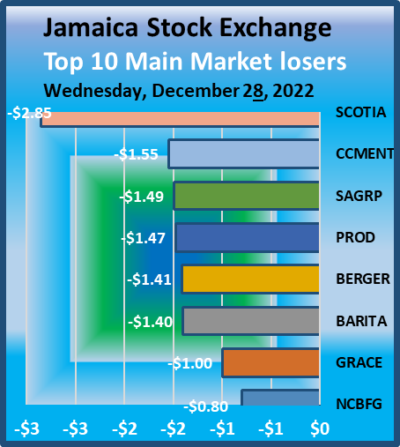 The PE Ratio, a formula to ascertain appropriate stock values, averages 14.4 for the Main Market. The JSE Main and USD Market PE ratios incorporate earnings forecasted by ICInsider.com for companies with the financial year ending between November and August 2023.
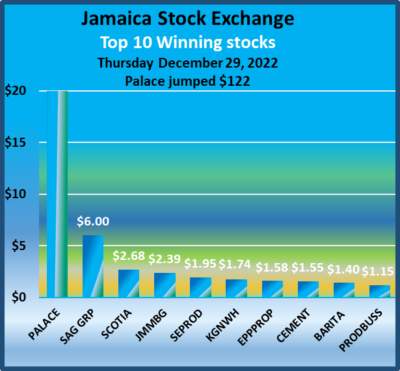
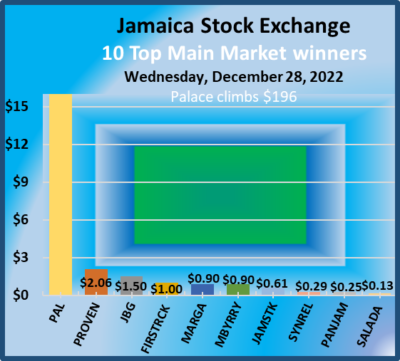
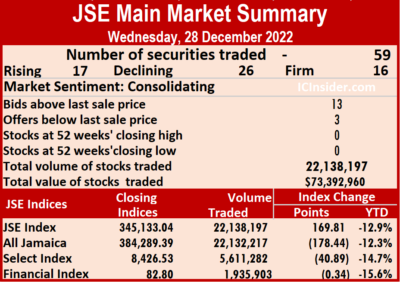 GraceKennedy shed $1 in ending at $81 after 12,747 stock units were traded, Jamaica Broilers gained $1.50 in closing at $31 with an exchange of 623,672 stocks, Jamaica Stock Exchange popped 61 cents to close at $15.71 in trading 52,801 stocks. JMMB Group declined 50 cents to $31.60 after exchanging 8,845 stock units, Mayberry Investments advanced 90 cents in closing at $8.90, with 106,593 units crossing the market, NCB Financial dipped 80 cents to $79.20 while trading 11,501 shares. Palace Amusement rallied $196 to end at $1,375 after 767 stocks changed hands, Proven Investments increased $1.90 to $28 as 4,084 units were exchanged, Sagicor Group fell $1.49 to close at $47 as 156,887 shares passed through the market. Scotia Group dropped $2.85 to $32.05 after exchanging 75,345 stock units,
 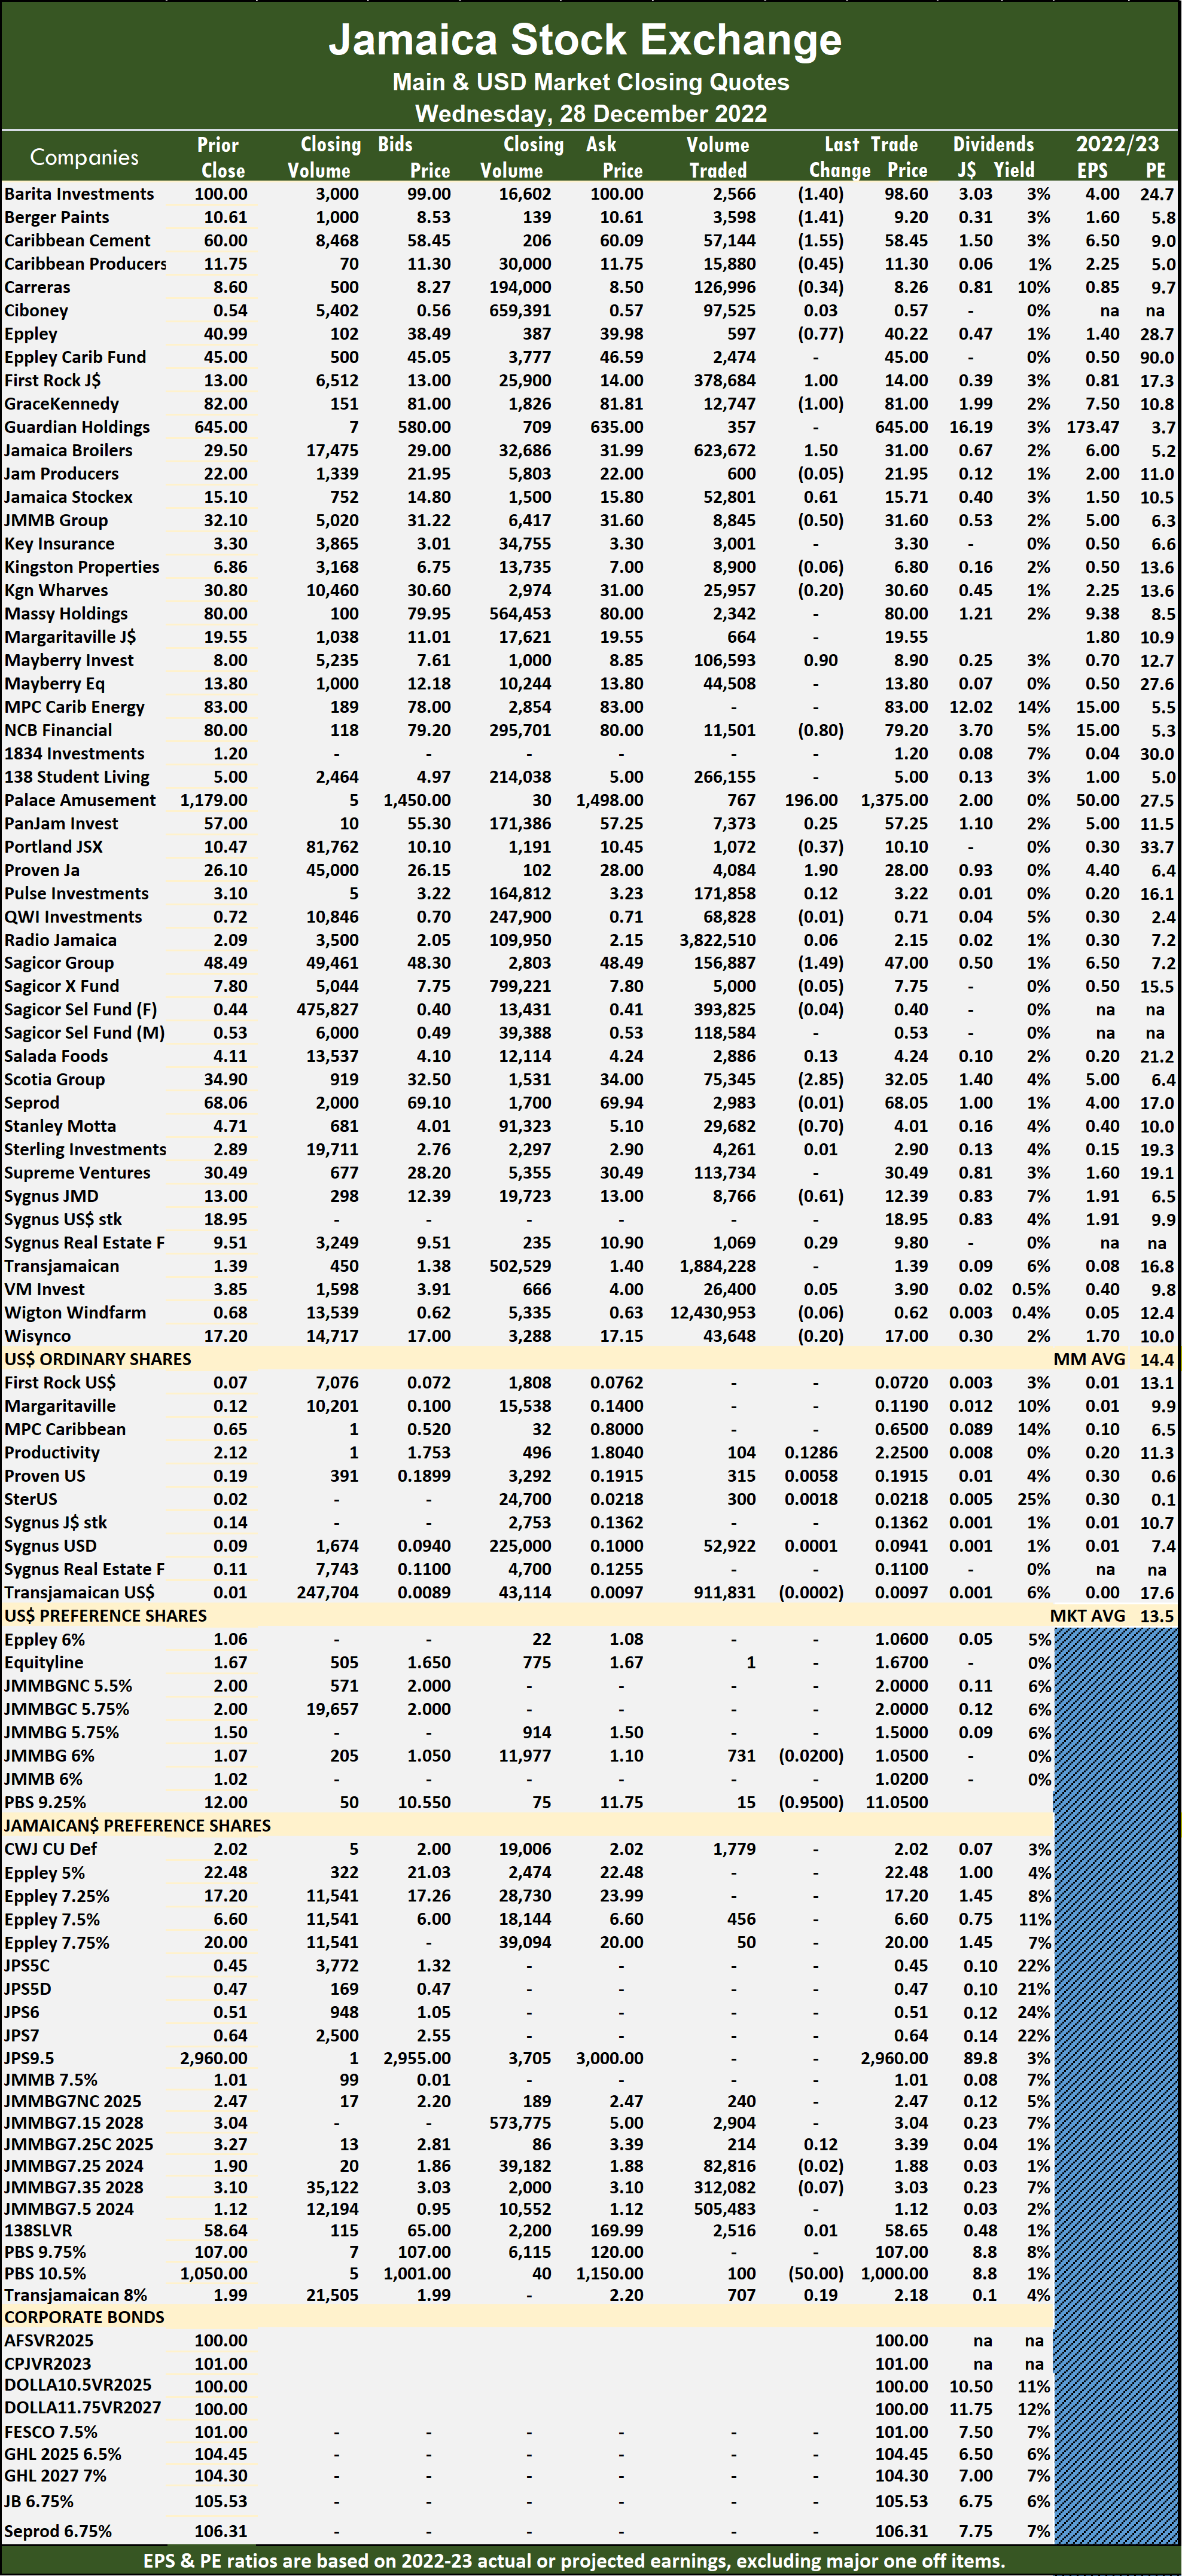 Stanley Motta lost 70 cents to close at $4.01, with 29,682 shares changing hands and Sygnus Credit Investments shed 61 cents in closing at $12.39 with investors transferring 8,766 units.
 The JSE US Denominated Equities Index gained 5.46 points to end at 258.04.
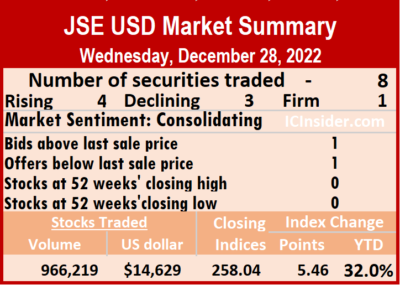 Sterling Investments gained 0.18 of a cent in closing at 2.18 US cents with an exchange of 300 shares, Sygnus Credit Investments USD share shed 0.01 of a cent to end at 9.41 US cents after trading 52,922 units and Transjamaican Highway slipped 0.02 of a cent to 0.97 of one US cents with 911,831 shares crossing the market.
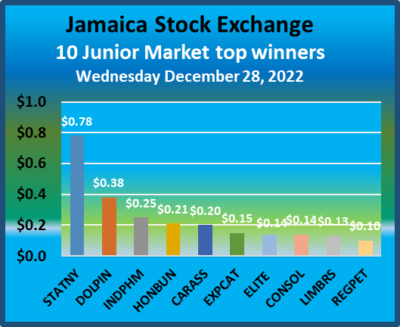 Blue Power, Lasco Distributors and Lasco Financial Services traded at 52 weeks’ intraday low.
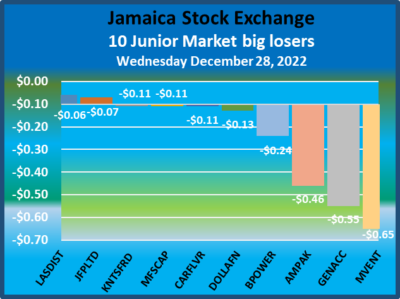 Junior Market stocks are based on ICInsider.com projected earnings for the financial year endings that falls between November this year and August 2023.
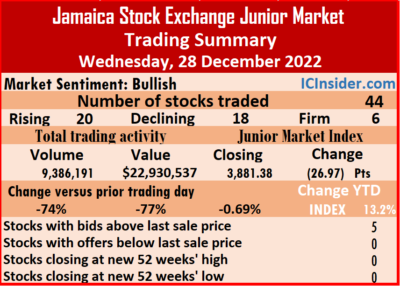 Consolidated Bakeries popped 14 cents to $1.84 in exchanging just one share, Dolla Financial shed 13 cents to close at $2.82 with the swapping of 540,840 stock units. Dolphin Cove increased 38 cents to $15.16 after trading 210,424 units, Elite Diagnostic gained 14 cents to end at $3.20 after a transfer of 10,005 stocks, Express Catering rallied 15 cents in closing at $5.05 after an exchange of 5,910 shares. General Accident declined 55 cents to $4.45, with 473 stocks crossing the market, Honey Bun advanced 21 cents to end at $7.42 in an exchange of 18,747 stock units, Indies Pharma climbed 25 cents to $2.85 with a transfer of 3,140 units. Knutsford Express fell 11 cents to $8.89 in switching ownership of 60 stock units, Limners and Bards rallied 13 cents in closing at $2.64 as investors exchanged 2,000 shares, Main Event shed 65 cents to close at $9.30, with 21,767 units changing hands. MFS Capital Partners declined 11 cents to end at $2.99 in exchanging 88,987 stock units,
 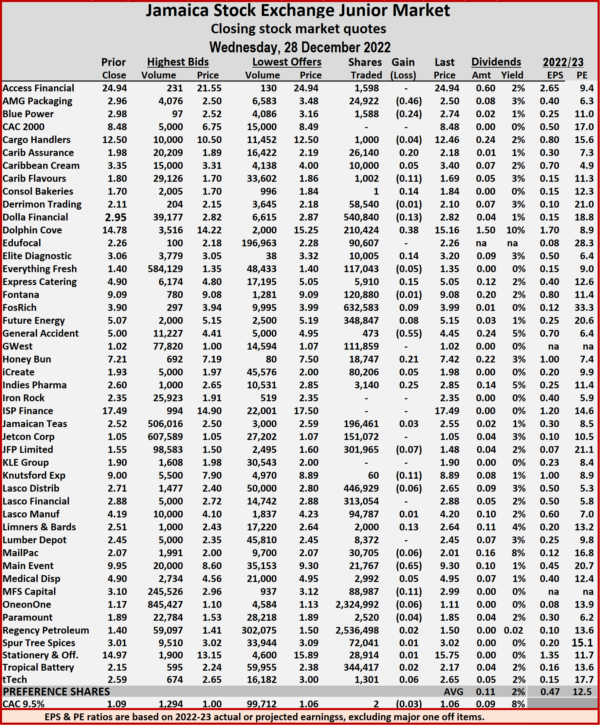 Regency Petroleum climbed 10 cents to $1.50 in trading 2,536,498 units and Stationery and Office Supplies increased 78 cents to $15.75 after an exchange of 28,914 shares.
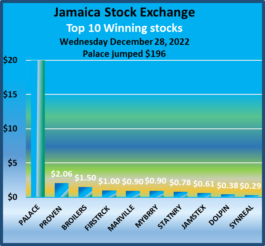 Trading ended with an exchange of 32,490,607 shares from 57,304,112 units last Friday, with a value of $98 million versus $258.7 million on the previous day. The JSE USD market ended with stocks traded with a value of US$14,629 versus US$699 last Friday.
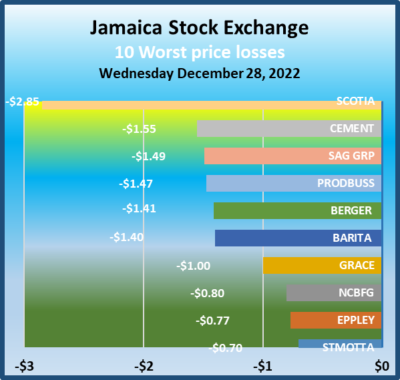 Investors should use the chart to help make rational investment decisions by investing in stocks close to the average for the sector and not going too far from it unless there are compelling reasons to do so. This approach helps to remove emotions from investment decisions and put in on fundamentals while at the same time not being too far from the majority of investors. Investors who buy when the price of a stock is close to the average will find that they are not inclined to overpay for a stock.
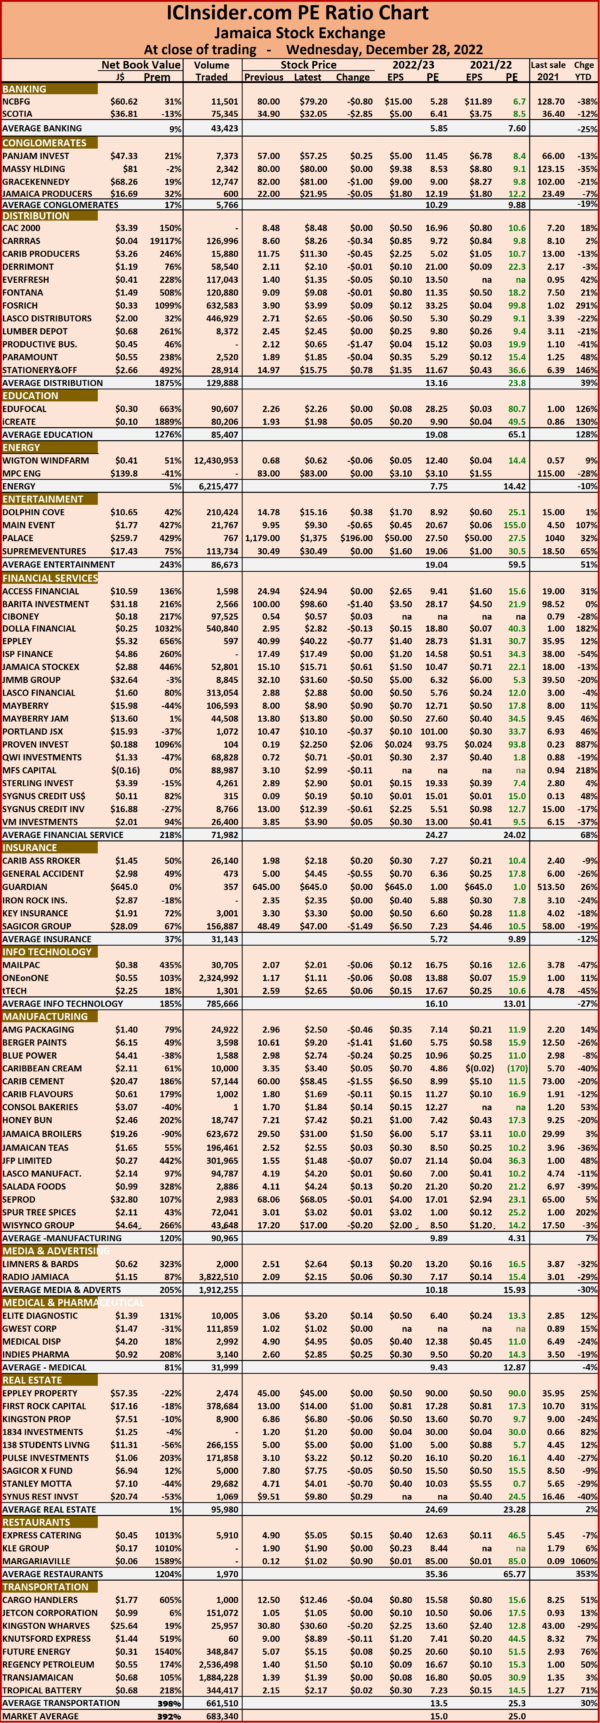 Dividends payable and yields for each company are shown in the Main and Junior Markets’ daily report charts that show the closing volume for the bids and offers.
 Only 8,860 shares were traded for a mere US$699 compared to 73,385 units at US$24,703 on Thursday.
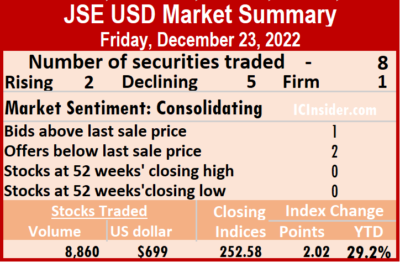 Proven Investments climbed 0.07 of a cent to 18.57 US cents, with 1,038 units crossing the exchange, Sterling Investments declined 0.2 of a cent in closing at 2 US cents with an exchange of 2,277 stock units, Sygnus Credit Investments J$ share remained at 13.62 US cents in an exchange of five stocks. Sygnus Credit Investments USD share shed 0.2 of a cent to end at 9.4 US cents after trading 1,023 units and Transjamaican Highway rose 0.07 of a cent to 0.99 of one US cents with 49 shares crossing the market.
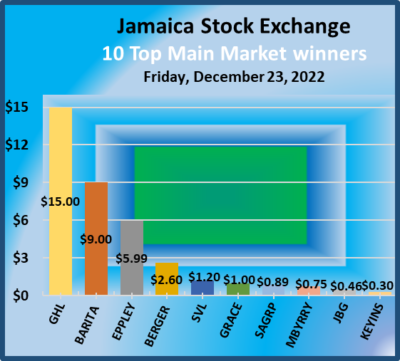 A total of 21,211,534 shares were traded for $157,346,195 compared to 7,586,543 units at $112,182,540 on Thursday.
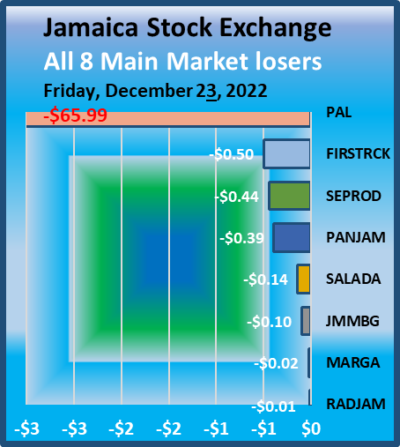 The All Jamaican Composite Index rose 3,483.04 points to settle at 384,467.83, the JSE Main Index popped 2,968.49 points to settle at 344,963.23 and the JSE Financial Index rose 1.11 points to settle at 83.14.
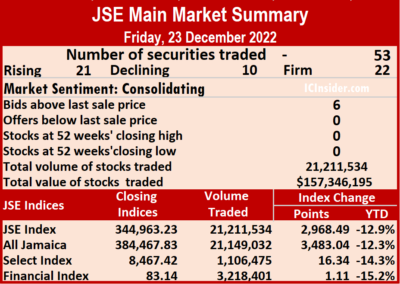 GraceKennedy climbed $1 to $82 and closed with an exchange of 8,337 stocks, Guardian Holdings climbed $15 to $645 as investors exchanged 640 units. Jamaica Broilers advanced 46 cents to $29.50 while exchanging 74,794 stock units, Mayberry Investments rose 75 cents to $8 with an exchange of 22,100 shares, Palace Amusement dropped $65.99 in closing at $1179 after exchanging 113 units. Proven Investments shed $2.30 in ending at $26.10 21,006 stock units passed through the market, Sagicor Group advanced 89 cents to end at $48.49 after trading 48,096 stocks, Seprod dipped 44 cents in ending at $68.06 with a transfer of 1,008 shares and Supreme Ventures increased $1.20 to close at $30.49 with 117,285 stock units clearing the market.
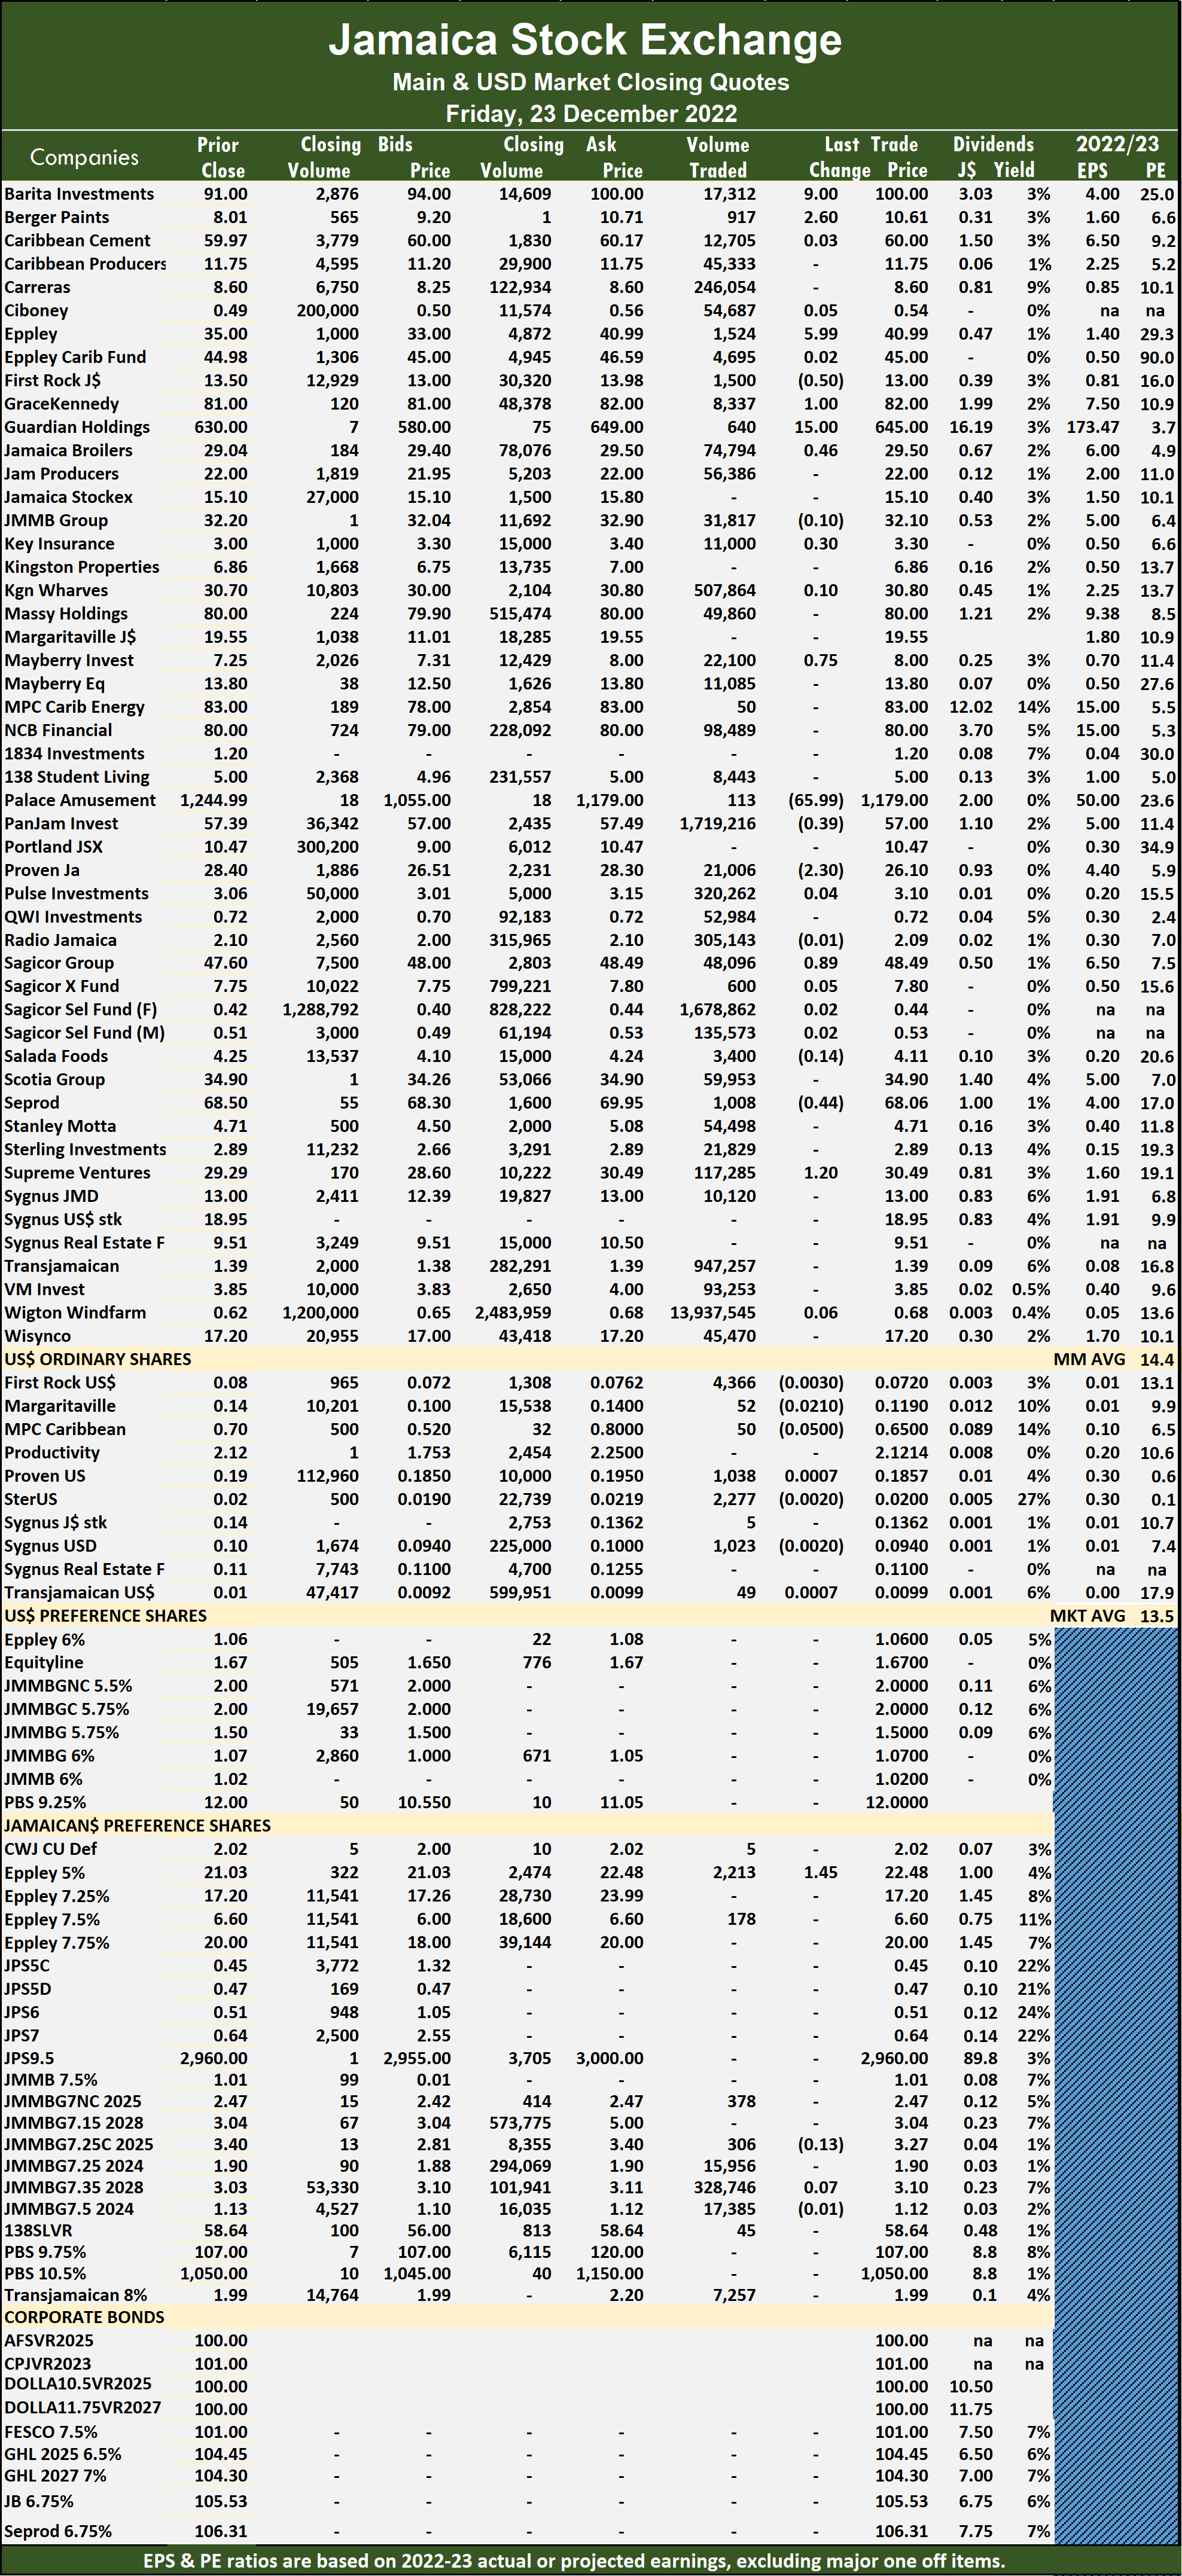 In the preference segment, Eppley 5% preference share popped $1.45 to $22.48, with 2,213 shares crossing the market.
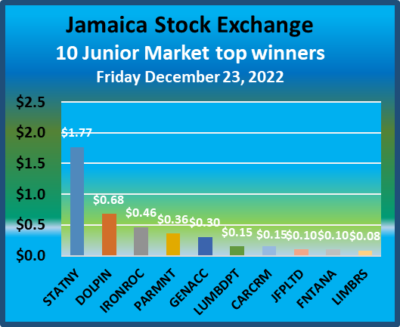 A total of 36,083,718 shares were traded for $101,351,606 versus 7,255,920 units at $22,249,838 on Thursday.
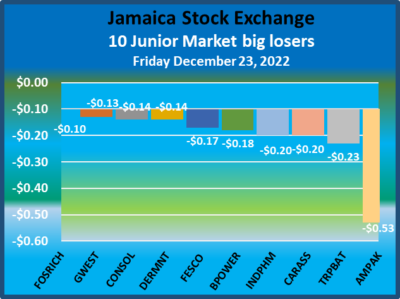 At the close, the Junior Market Index slipped 9.81 points to settle at 3,908.35.
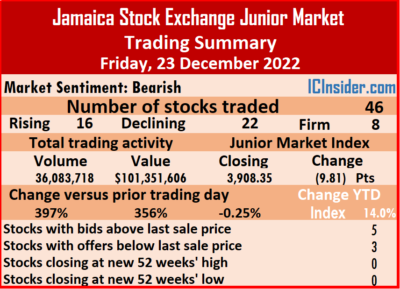 Caribbean Assurance Brokers shed 20 cents to $1.98 after 2,460 stock units were traded. Caribbean Cream popped 15 cents in ending at $3.35 while exchanging 383 stocks, Consolidated Bakeries fell 14 cents to end at $1.70, with 15,090 stocks clearing the market, Derrimon Trading shed 14 cents to close at $2.11 trading 106,868 shares. Dolphin Cove gained 68 cents to $14.78 in exchanging 3,056 units, Fontana rose 10 cents to end at $9.09 with investors transferring 8,975 stock units, Fosrich lost 10 cents in closing at $3.90 with 18,458,647 stock units changing hands. Future Energy Source dipped 17 cents to $5.07 after a transfer of 177,671 units, General Accident increased 30 cents to $5 in switching ownership of 21,331 stocks, GWest Corporation dropped 13 cents in closing at $1.02 with the swapping of 1,824 shares. Indies Pharma lost 20 cents at $2.60 with a transfer of 1,761 stocks, Iron Rock Insurance advanced 46 cents to end at $2.35 with an exchange of one unit, JFP Ltd rallied 10 cents to close at $1.55 after an exchange of 11,438,854 stock units.
 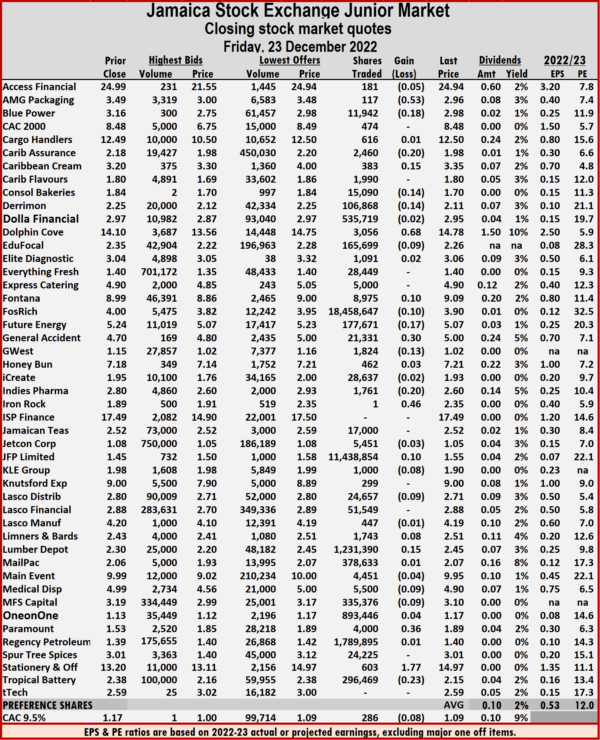 Lumber Depot climbed 15 cents in ending at $2.45 after trading 1,231,390 shares, Paramount Trading rallied 36 cents in closing at $1.89 after exchanging 4,000 stock units, Stationery and Office Supplies jumped $1.77 to $14.97, with 603 shares crossing the market and Tropical Battery fell 23 cents to end at $2.15 after 296,469 stock passed through the market.
 Trading ended with an exchange of 57,304,112 shares compared with 14,915,848 units on Thursday, with the value dropping to $258.7 million from $134.4 million on the previous day.
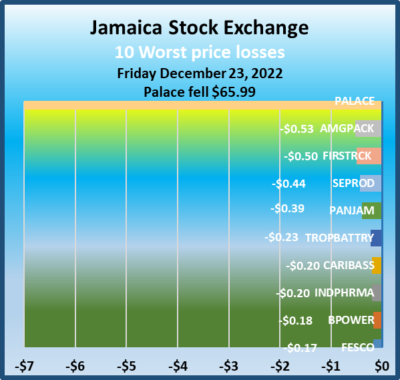 ng.
ng.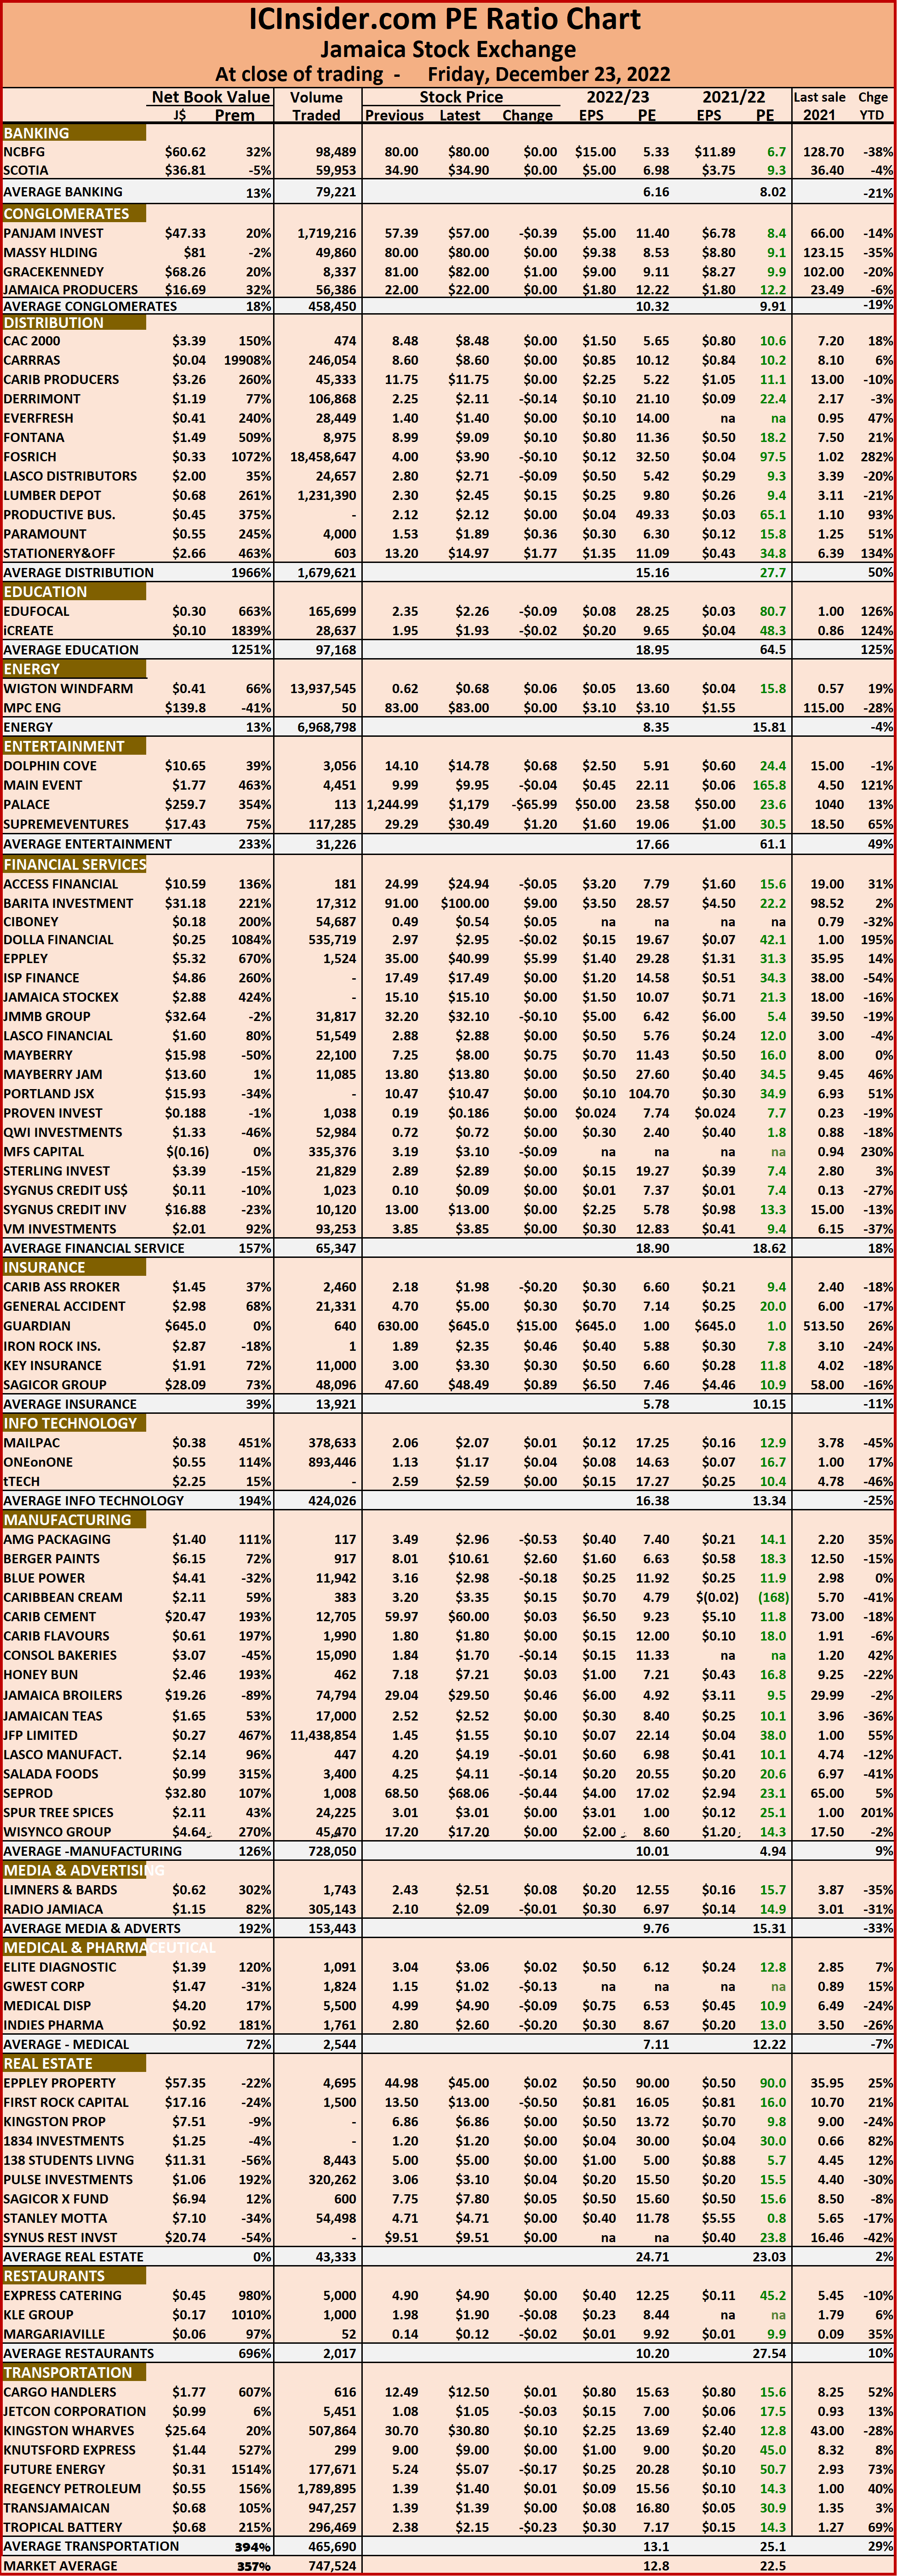 The chart also shows daily changes in stock prices and the percentage year to date price movement based on the last traded prices. Dividends payable and yields for each company are shown in the Main and Junior Markets’ daily report charts that show the closing volume for the bids and offers.