Stock split news lift SOS to a record $26

Investors in office supply Junior Market listed company Stationery and Office Supplies are having a grand time, with the company reporting two highly profitable years with 2023 starting off on a promising note for another year of record profits.

Stationery & Office Supplies hit a new high after the proposed stock split announcement.

Over the past year, shareholders will receive dividends amounting to 38 cents per share with the second payment in July. To add icing to the cake, the announcement on Monday that the board of directors will meet on Wednesday to consider a stock split has pushed the share price to a record high of $26 in early trading on Tuesday, with an increase of 52 percent for the year to date on top of 179 percent gain in 2022. Up to late May, the stock was trading in the $15 region, a level that it was at for weeks.
In premarket trading there were several bids amounting to over 306,000 units at $26, the maximum the stock will trade at initially, against 23,811 on offer up to $26. Trading in the stock is halted until 10:30 but currently, there are 21 bids at $26 to buy 282,981 shares. On the other hand, the lowest offer is at $30.50 with 23,000 units, followed by 575 shares at $34.96 and 28,774 units at $35.01 and then 42,277 stock units at $44.97.


SOS directors to consider splitting the stock

The board of directors of Stationary & Office Supplies informed the Jamaica Stock Exchange that they will meet on Wednesday, June 21st to discuss and consider whether or not to recommend a stock split to the company’s shareholders.

SOS is likely to split stock in 2023.

According to the release, “the market value of the company’s stock has been on a consistent growth trajectory and the liquidity of the stock is also a significant consideration.”
At the last annual general meeting the CEO, Allan McDaniel stated that they were reviewing the matter of a stock split on an ongoing basis but that trading in the stock was fairly liquid as such there was no need to make the adjustment then.
ICInsider.com gathers that the $20 was likely to be the trigger point for a split. Last week the stock traded at $24 but pulled back to $20 where it is now trading, but if history is anything to go by, the price is likely to climb in Tuesday’s trading. With profits for the current year likely to hit nearly $2 per share and around $3 in 2024, that could push the price between $30 and $40 this year and $50 to $60 next year, a split in the order of 10 could place the price closer to where Junior Market investors could find the stock reasonably priced and encourage greater trading in it. A 10 to 1 split would lift the issued shares to just over 2.5 billion units which would be within a level that would facilitate a great deal of liquidity for a number of years, but the price could be back in the teens again in 2024. Even a 5 for 1 would result in an enhanced level of liquidity with just over 1.25 billion units in issue and push it to 16th Junior Market company in terms of the number of issued shares and 6th if a 10 to 1 split was to be approved. The prospects of profit jumping sharply in 2024, if achievable and seen by management as likely then a 10 to 1 split would seem to be the better option.
The split if approved by the directors, would require ratification by shareholders at a general meeting and that is likely to be at the company’s upcoming general meeting.
The next stock split could well come for Cargo Handlers, with thin trading currently with the price now in excess of $20. Dolphin Cove seems to be shaping for a possible spilt as well but that would be more likely down the road.

Big Main Market bounce as Junior & USD market slip

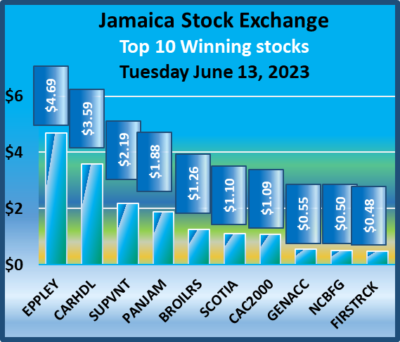
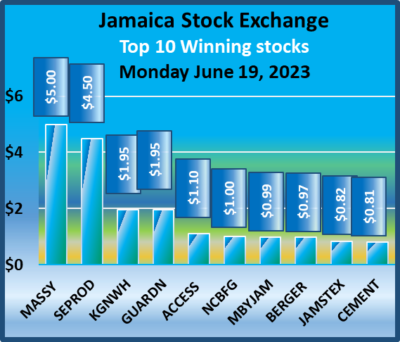
The Main market of the Jamaica Stock Exchange jumped sharply on Monday, following declines on Wednesday to Friday but the Junior Market and the JSE USD Market closed slightly lower at the end of a moderate trading session.
At the close, the JSE Combined Market Index jumped 4,488.68 points to close at 341,020.08 the All Jamaican Composite Index rallied 3,886.72 points to 364,321.23, the JSE Main Index surged 4,887.95 points to 327,418.41, the Junior Market Index slipped 7.88 points to 3,879.91, as the JSE USD Market Index slipped 1.17 points to close a  241.01. 
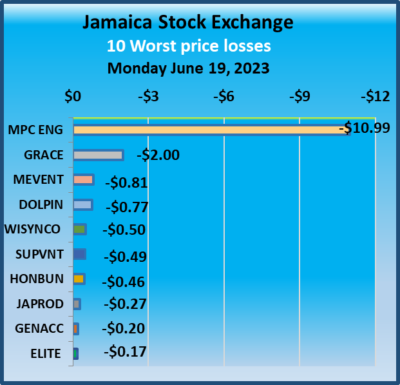
Preference shares with notable price movements but are not in the Main Market TOP10 graphs is Jamaica Public Service 7% that fell $7 in closing at $49.
At the close, investors exchanged 30,498,415 shares in all three markets up from 20,598,279 shares on Friday. The value of stocks trading in the Junior and Main markets was $95.3 million, up from $73.7 million on Friday. Trading on the JSE USD market resulted in investors exchanging 764,260 shares for US$20,272 compared to 992,059 units at US$15,037 on Friday.
The market’s PE ratio ended at 18.7 on 2022-23 earnings and 12.5 times those for 2023-24 at the close of trading.
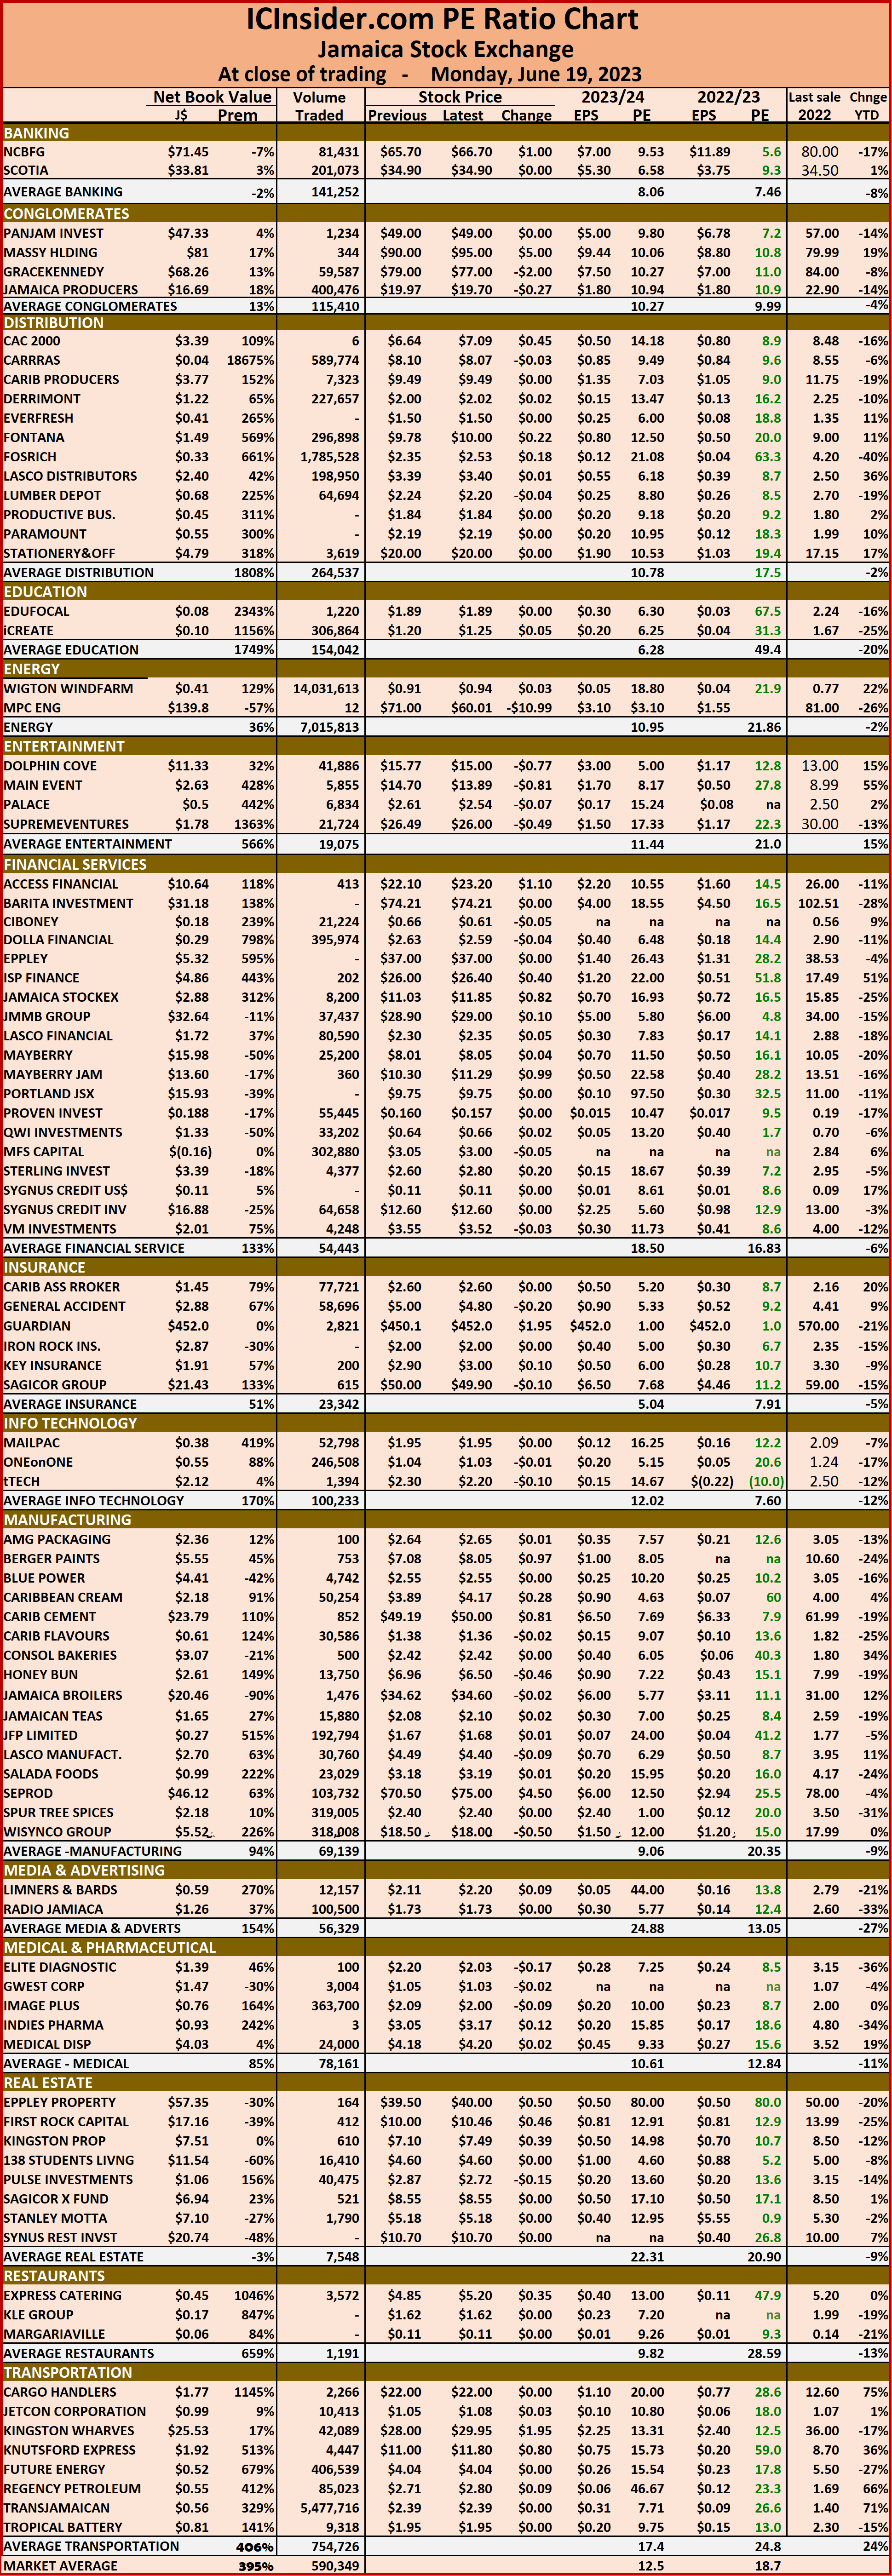
Investors need pertinent information to successfully navigate numerous investment options in the local stock market. The ICInsider.com PE ratio chart and the more detailed daily report charts provide investors with regularly updated information to help decision-making.
Investors should use the chart to help make rational decisions when investing in stocks close to the average for the sector and not going too far from it unless there are compelling reasons to do so. This approach helps to remove emotions from investment decisions and put in on fundamentals while at the same time not being too far from the majority of investors. Investors who buy when the price of a stock is close to the average will find that they are not inclined to overpay for a stock.
The ICInsider.com PE ratio chart covers all ordinary shares on the Jamaica Stock Exchange and shows companies grouped on an industry basis, allowing easy comparisons between the same sector companies and the overall market.
The net asset value of each company is reported as a guide to assess the value of stocks based on this measure quickly. The chart also shows daily changes in stock prices and the percentage year to date price movement based on the last traded prices.
Dividends paid or payable and yields for each company are shown in the Main and Junior Markets’ daily report charts along with the closing volume pertaining to the highest bid and the lowest offer for each company.
The EPS & PE ratios are based on 2021 and 2022 actual or projected earnings, excluding major one off items. The PE Ratio is the most popular measure used to determine the value of stocks.

Kremi heads ICTOP10 after gaining 22%

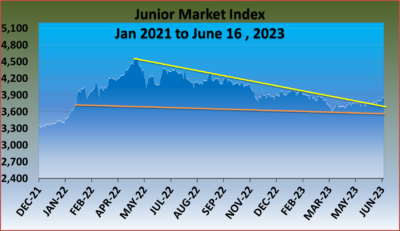
The performance this past week in the Junior and the Main Market diverged significantly the Junior Market recorded gains in the week and put it back at early March levels this year while the main market declined further continuing negative performance since the beginning of June and is now back at August 2018 levels and is providing investors with a great opportunity to add some of these stocks to their early Christmas shopping at bargain prices.
The Junior Market has broken through the downward-sloping resistance line of the wedge. The Junior Market reclaimed the 3,800 handle last week and is close to retaking the 3,900 level shortly, with the market set for a big rally in the second half of the year a position supported by technical analysis of the market. The Main Market seems to be weighed down by concerns relating to inflation and interest rates, if so the reading is wrong as inflation is well under control and interest rates will start dropping before the year ends.
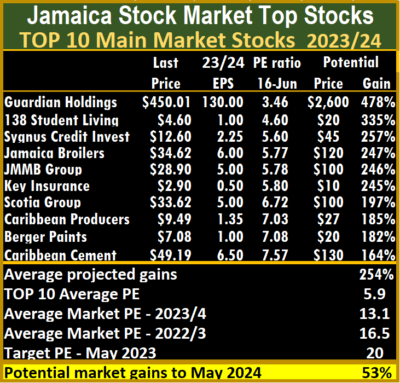
Against the background, the Junior Market recorded gains for six stocks during the week with iCreate jumping 26 percent to $1.20, Caribbean Cream moving up 22 percent to $3.89 and Edufocal putting on 6 percent to end the week at $1.89 hey worst performer was Iron Rock Insurance down 7 percent to $2 and General Accident fell 5 percent to $5, while One and One lost 3 percent to close the week at $1.04.
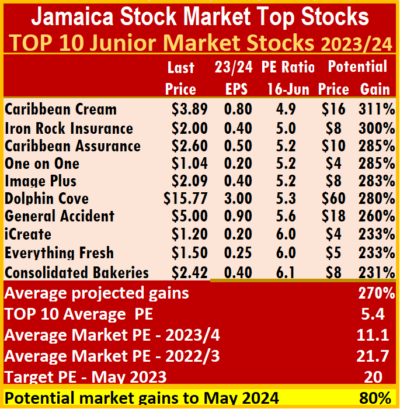
The Main Market had one price movement of note with Transjamaican rising 13 percent to close the week at $2.39. Declining are 138 Student Living down 11 percent to $4.60, Guardian Holdings, with a loss of 7 percent to $450.01 and Caribbean Producers lost 5 percent to end the week at $9.48.
Transjamaican moved out of the Main Market TOP10, with a gain of 27 percent since entering the TOP10 and 35 percent since it was added to Stocks to Watch at $1.77 in April, is replaced by Caribbean Cement, with projected earnings of $6.50 notwithstanding for the first quarter profit and in the Junior Market, Edufocal moved out while Everything Fresh returns after a brief absence to the TOP10 with the price having fallen to $1.50.
Transjamaican, although out of the top 10 has much more room to grow with the potential for an additional 200% increase in the stock price. A look at the order book for Transjamaican suggests that demand is likely to overwhelm supply over the next two to three weeks with a likely price target then of $3. Even then the potential dividend yield that could be 8 percent at that price could result in the price going higher.
Recent developments for some stocks – Lasco Distributors and Lasco Manufacturing increased dividends to 10 cents and 12 cents respectively, with both to be paid in July, while Stationery and Office Supplies hit a record high in the week at $24 but closed the week at $20 for a 17 percent gain for the year. The stock is now a prime candidate for a stock split. Earnings for Berger Paints were adjusted down to $1 per share for 2023.
At the end of the week, the average PE for the JSE Main Market TOP 10 is 5.8, well below the market average of 13.1. The Main Market TOP10 is projected to have an average of 254 percent, to May 2024, based on 2023 forecasted earnings.
The 15 most highly valued Main Market stocks are priced at a PE of 15 to 98, with an average of 29 and 20 excluding the highest PE stocks, 23 for the top half and 18 excluding the stocks with the highest PEs.
The Junior Market Top 10 PE sits at 5.8 compared with the market at 11.1. There are 11 stocks representing 23 percent of the market, with PE from 15 to 42, averaging 21 that are well above the average of the market. The top half of the market has an average PE of 16, possibly the lowest fair value for Junior Market stocks currently. Junior Market is projected to rise by 270 percent to May 2024.
The divergence between the average PE ratio of the Main and Junior Markets and the overall market valuation is an important indicator of the level of likely gains for ICTOP10 stocks.
In the market generally, Investors continue to nibble away at a number of stocks and in the process gradually reducing the supply of several stocks that are attractively priced as the market moves toward the summer months, the start of the stock market year.
ICTOP10 focuses on likely yearly winners, accordingly, the list includes some of the best companies in the market but not always. ICInsider.com ranks stocks based on projected earnings, allowing investors to focus on the most undervalued stocks and helping to remove emotions in selecting stocks for investments that often result in costly mistakes.
ICTOP10 stocks are likely to deliver the best returns up to the end of May 2023 and are ranked in order of potential gains, computed using projected earnings for the current fiscal year. Expected values will change as stock prices fluctuate and result in weekly movements in and out of the lists. Revisions to earnings are ongoing, based on receipt of new information.
Persons who compiled this report may have an interest in securities commented on in this report.

Continuing fall for Main Market, Juniors rise

The Main market of the Jamaica Stock Exchange declined at the close on Friday and continuing the negative trend from the beginning of the month but the Junior Market continues to eat away at losses incurred earlier in the year, while the JSE USD Market closed higher at the end of a moderate trading session.
At the close, the JSE Combined Market Index declined 377.10 points to 336,531.40, the All Jamaican Composite Index shed 214.10 points to close at 360,434.51, the JSE Main Index dropped 843.81 points to 322,530.46, the Junior Market Index jumped 44.82 points to 3,887.79, while the JSE USD Market Index slipped 2.75 points to close at 237.27.
Preference shares with notable price movements but are not in the Main Market TOP10 graphs are Eppley 7.75% preference share adding $1 to close at $20 and Jamaica Public Service 9.5% rising $22 in closing at $3,000.
At the close, investors exchanged 20,598,279 shares in all three markets compared to 30,404,886 shares on Thursday. The value of stocks trading in the Junior and Main markets was $73.7 million, up sharply from $115.16 million on Thursday. Trading on the JSE USD market resulted in investors exchanging 992,059 shares for US$15,037 compared to 32,918 units at US$5,796 on Thursday.
The market’s PE ratio ended at 18.4 on 2022-23 earnings and 12.3 times those for 2023-24 at the close of trading.
Investors need pertinent information to successfully navigate numerous investment options in the local stock market. The ICInsider.com PE ratio chart and the more detailed daily report charts provide investors with regularly updated information to help decision-making.
Investors should use the chart to help make rational decisions when investing in stocks close to the average for the sector and not going too far from it unless there are compelling reasons to do so. This approach helps to remove emotions from investment decisions and put in on fundamentals while at the same time not being too far from the majority of investors. Investors who buy when the price of a stock is close to the average will find that they are not inclined to overpay for a stock.
The ICInsider.com PE ratio chart covers all ordinary shares on the Jamaica Stock Exchange and shows companies grouped on an industry basis, allowing easy comparisons between the same sector companies and the overall market.
The net asset value of each company is reported as a guide to assess the value of stocks based on this measure quickly. The chart also shows daily changes in stock prices and the percentage year to date price movement based on the last traded prices.
Dividends paid or payable and yields for each company are shown in the Main and Junior Markets’ daily report charts along with the closing volume pertaining to the highest bid and the lowest offer for each company.
The EPS & PE ratios are based on 2021 and 2022 actual or projected earnings, excluding major one off items. The PE Ratio is the most popular measure used to determine the value of stocks.

Trading drops back on the JSE

Trading ended on Thursday with the market indices of all three of the Jamaica Stock Exchange declining at the close of trading, with the volume and the value of stocks trading declining from Wednesday, even as Transjamaican Highway continues to hit new 52 weeks’ highs.
At the close of trading, the JSE Combined Market Index declined 3,732.68 points to 336,908.50, the All Jamaican Composite Index shed 333.53 points to end at 360,648.61, the JSE Main Index dropped 3,765.05 points to 323,374.27, the Junior Market Index fell 23.99 points to 3,842.97, while the JSE USD Market Index slipped 2.75 points to close at 237.27.
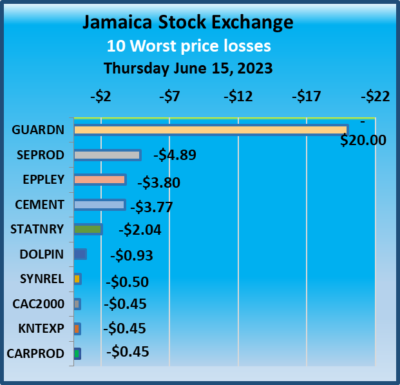
Preference shares with notable price changes but not in the Main Market TOP10 graphs are Productive Business 10.50% preference share that popped $50 to $1,250 and Jamaica Public Service 7% gaining $5.99 in closing at $56.
At the close, investors exchanged 30,404,886 shares in all three markets on Thursday compared to 41,085,482 shares on Wednesday. The value of stocks trading in the Junior and Main markets was $115.16 million, up sharply from $752.6 million on Wednesday. Trading on the JSE USD market resulted in investors exchanging 32,918 shares for US$5,796 compared to 289,060 units at US$34,073 on Wednesday.
The market’s PE ratio ended at 18.3 on 2022-23 earnings and 11.3 times those for 2023-24 at the close of trading.
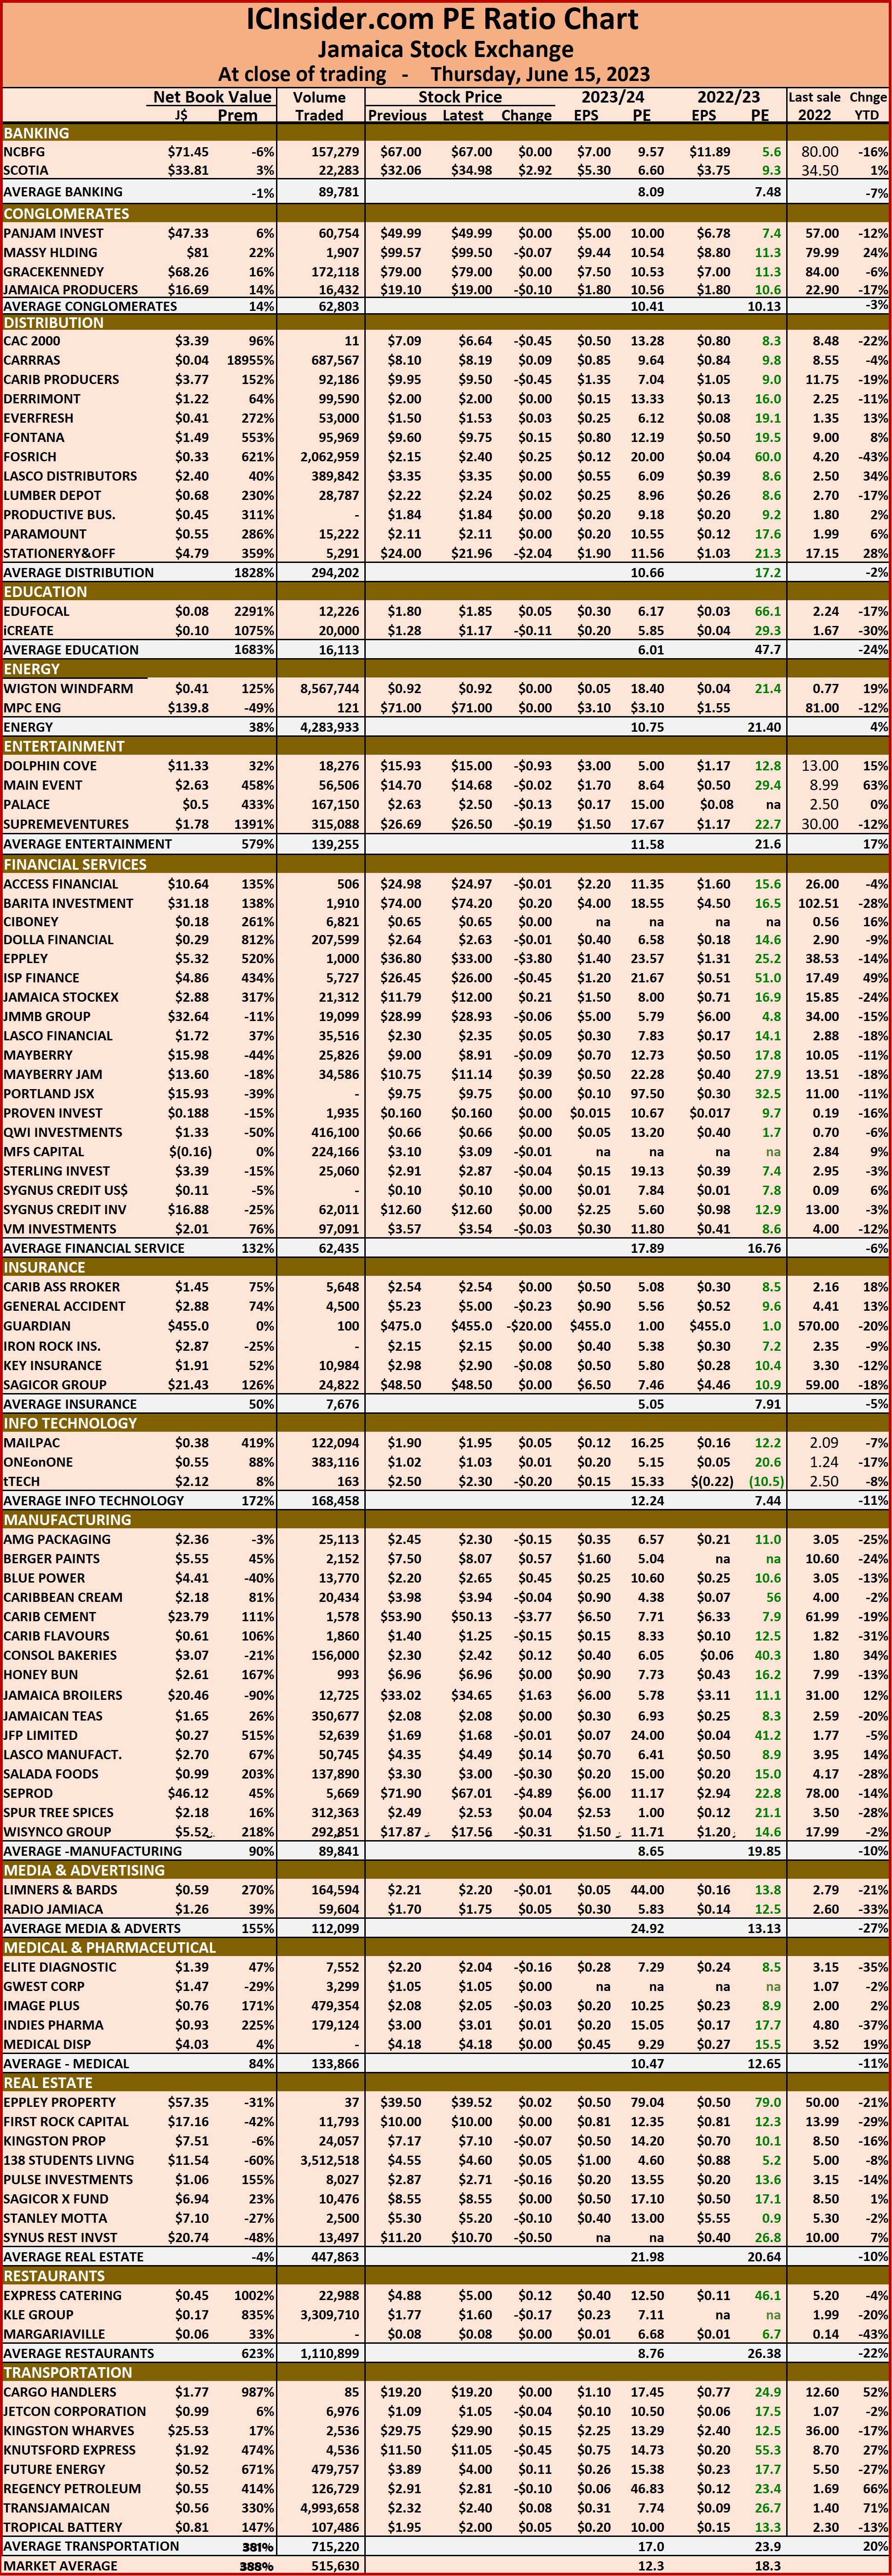
Investors need pertinent information to successfully navigate numerous investment options in the local stock market. The ICInsider.com PE ratio chart and the more detailed daily report charts provide investors with regularly updated information to help decision-making.
Investors should use the chart to help make rational decisions when investing in stocks close to the average for the sector and not going too far from it unless there are compelling reasons to do so. This approach helps to remove emotions from investment decisions and put in on fundamentals while at the same time not being too far from the majority of investors. Investors who buy when the price of a stock is close to the average will find that they are not inclined to overpay for a stock.
The ICInsider.com PE ratio chart covers all ordinary shares on the Jamaica Stock Exchange and shows companies grouped on an industry basis, allowing easy comparisons between the same sector companies and the overall market.
The net asset value of each company is reported as a guide to assess the value of stocks based on this measure quickly. The chart also shows daily changes in stock prices and the percentage year to date price movement based on the last traded prices.
Dividends paid or payable and yields for each company are shown in the Main and Junior Markets’ daily report charts along with the closing volume pertaining to the highest bid and the lowest offer for each company.
The EPS & PE ratios are based on 2021 and 2022 actual or projected earnings, excluding major one off items. The PE Ratio is the most popular measure used to determine the value of stocks.

Value of stocks traded surged on the JSE

Trading surged for a second consecutive day on the Jamaica Stock Exchange on Wednesday, with the volume of stocks trading declining but resulted in a higher value than on Tuesday following GraceKennedy trading 3.76 million shares for $291 million, NCB Financial ended with 3 million shares for $204 million and ScotiaGroup with 4.85 million shares for $164 million as trading ended with the Junior and JSEUSD markets rising at the close and the Main Market declining even as with Transjamaican Highway and Wigton Windfarm continues to hit new 52 weeks’ highs.
At the close of the market, the JSE Combined Market Index fell 1,534.67 points to 340,641.18, the All Jamaican Composite Index declined 1,105.39 points to close at 360,982.14, the JSE Main Index dropped 1,861.20 points at 327,139.32, the Junior Market Index climbed 22.06 points to 3,866.96, while the JSE USD Market Index gained 1.89 points to close at 240.02.
Preference shares with notable price movements but are not in the Main Market TOP10 graphs are Eppley 7.25% preference share recovered the $2.85 it lost on Tuesday in closing at $19 and Jamaica Public Service 7% shed $1.99 in closing at $50.01.
At the close, investors exchanged 41,085,482 shares in all three markets on Tuesday compared to 60,867,391 shares on Tuesday. The value of stocks trading in the Junior and main markets was $752.6 million, up sharply from $609.18 million on Tuesday. Trading on the JSE USD market resulted in investors exchanging 289,060 shares for US$34,073 compared to 132,703 units at US$3,992 on Tuesday. The market’s PE ratio ended at 18.3 on 2022-23 earnings and 11.3 times those for 2023-24 at the close of trading. Investors need pertinent data to successfully navigate numerous investment options in the local stock market. The ICInsider.com PE ratio chart and the more detailed daily report charts provide investors with regularly updated information to help decision-making. Investors should use the chart to help make rational decisions when investing in stocks close to the average for the sector and not going too far from it unless there are compelling reasons to do so. This approach helps to remove emotions from investment decisions and put in on fundamentals while at the same time not being too far from the majority of investors. Investors who buy when the price of a stock is close to the average will find that they are not inclined to overpay for a stock.
The ICInsider.com PE ratio chart covers all ordinary shares on the Jamaica Stock Exchange and shows companies grouped on an industry basis, allowing easy comparisons between the same sector companies and the overall market.
The net asset value of each company is reported as a guide to assess the value of stocks based on this measure quickly. The chart also shows daily changes in stock prices and the percentage year to date price movement based on the last traded prices.
Dividends paid or payable and yields for each company are shown in the Main and Junior Markets’ daily report charts along with the closing volume pertaining to the highest bid and the lowest offer for each company.

The EPS & PE ratios are based on 2021 and 2022 actual or projected earnings, excluding major one off items. The PE Ratio is the most popular measure used to determine the value of stocks.

Profit climbs at Caribbean Assurance Brokers

Caribbean Assurance Brokers (CAB) is not one of the more popular Junior Market stocks, coming to the market just when the Covid-19 pandemic broke out in Jamaica, and got little post-IPO bounce and has never won the support of the wider market. The company reported record full year and 2023 first quarter profits, yet the stock continues to struggle although currently trading up from the price before the release of both results.
Operating Revenues rose 11 percent from $423 million to $469 million for the year ending December 2022, while Other Operating Income generated $37 million which was down 7 percent from $40 million in 2021, resulting in total income rising 7 percent to $506 million from $463 million in 2021. Profit for the year rose 32 percent to $75 million from $57 million in the prior year, with earnings per share of 30 cents up from 21 cents in 2021.

Selling Expenses were virtually flat for the year at $146 million compared with $145 million in 2021, Administrative Costs rose 10 percent to $281 million from $255, depreciation charge fell 10 per cent to $16 million and finance costs fell 32 percent to $4 from $6 million in 2022.
For the 2023 March quarter, revenues climbed 12 percent to $101.9 million from $90.6 million for the 2022 March quarter. Other Operating Income fell from $14 million to $12 million resulting in total revenues of $114 million rising 9 percent above $105 in 2021.  The company earns the bulk of its income and profit in the September quarter. Profit jumped 840 percent to $17 million after tax from just $2 million in 2021, with earnings per share of 7 cents.
Selling Expenses fell by 30 percent to $25 million from $36 million in 2022, Administrative Cost rose 7 percent to $70 million from $66 million, depreciation charge rose 21 percent to $5 million from $4 million in 2021 and finance costs fell 45 percent to $593,176 from $1 million in 2021.

Caribbean Assurance Brokers selling at a PE of just 8 based on historical earnings & 5 times 2023.

Cash inflows from operations delivered $24 million, up from just $7 million in 2022, but cash funds climbed by $132 million by the end of March after spending $37 million on addition to fixed assets with a reduction in receivables and an increase in payables contributed $146 million in positive flows during the three months period.
At the end of March, shareholders’ equity stood at $480 million up from $390 million at the end of March 2022 and $463 million at the end of December 2022. The company continues to be lightly leveraged with borrowings of $59 million of which $53 million is short term and due to be repaid within twelve months.
Current assets stood at $536 million at the end of March versus $418 million in 2022. Cash and equivalent was $385 million up from $286 million at the end of March 2022, with receivables at $148 million, up from $127 million in 2022.
Current liabilities ended the 2023 quarter at $345 million at the end of March, up from $229 million at the end of March 2022.
ICInsider.com projects EPS of 50 cents for the current year, with the stock priced at $2.53 it last traded on the Junior Market and sits at the number 2 spot on ICInsider.com TOP10. The PE is a mere 5 times 2023 earnings and 8 times 2022 earnings and is one of the most undervalued stocks on the market currently.
The directors approved a modest dividend of 2.67 cents per share, well below the target stated in the prospectus of up to 25 percent of profits. The payment will be on October 26, with the ex-dividend date of September 14.

Kingston Wharves dominates JSE trading

Trading surged on the Jamaica Stock Exchange on Tuesday Kingston Wharves traded 17.7 million shares valued at $496 million and swelled the overall trade for the day sharply higher than on Monday with all three markets rising at the close with Transjamaican Highway continuing to hit record highs and closed at $2.21.
Trading ended with the JSE Combined Market Index popping 826.66 points to 342,175.85, while the All Jamaican Composite Index rallied 810.40 points to 362,087.53, the JSE Main Index climbed 469.12 points to 329,000.52. The Junior Market Index jumped 42.50 points to close at 3,844.90 and seems to be breaking out from wedge-shaped chart formation, while the JSE USD Market Index popped 4.19 points to  238.13.
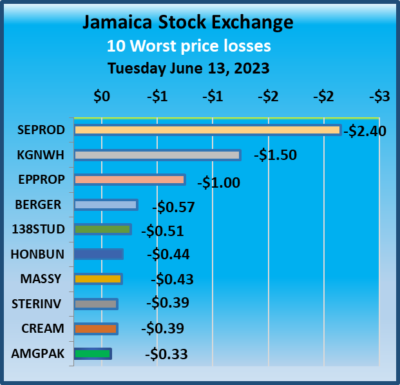
Preference shares with notable price movements but are not in the Main Market TOP10 graphs are Eppley 7.25% preference share declined $2.85 in closing at $16.15, Eppley 7.50% preference share added $1.19 to end at $7.39, Jamaica Public Service 7% gained $2 in closing at $52, Jamaica Public Service 9.5% fell $22 to close at $2978. 138 Student Living preference share rose $6.99 and ended at $87.99 and Productive Business Solutions 9.75% preference share dipped $14.50 to $91.50.
At the close, investors exchanged 60,867,391 shares in all three markets on Tuesday compared to 22,548,034 shares on Tuesday. The value of stocks trading in the Junior and main markets was $609.18 million, up sharply from $90.9 million on Tuesday. Trading on the JSE USD market resulted in investors exchanging 132,703 shares for US$3,992 compared to 2,048,216 units at US$53,374 on Tuesday.
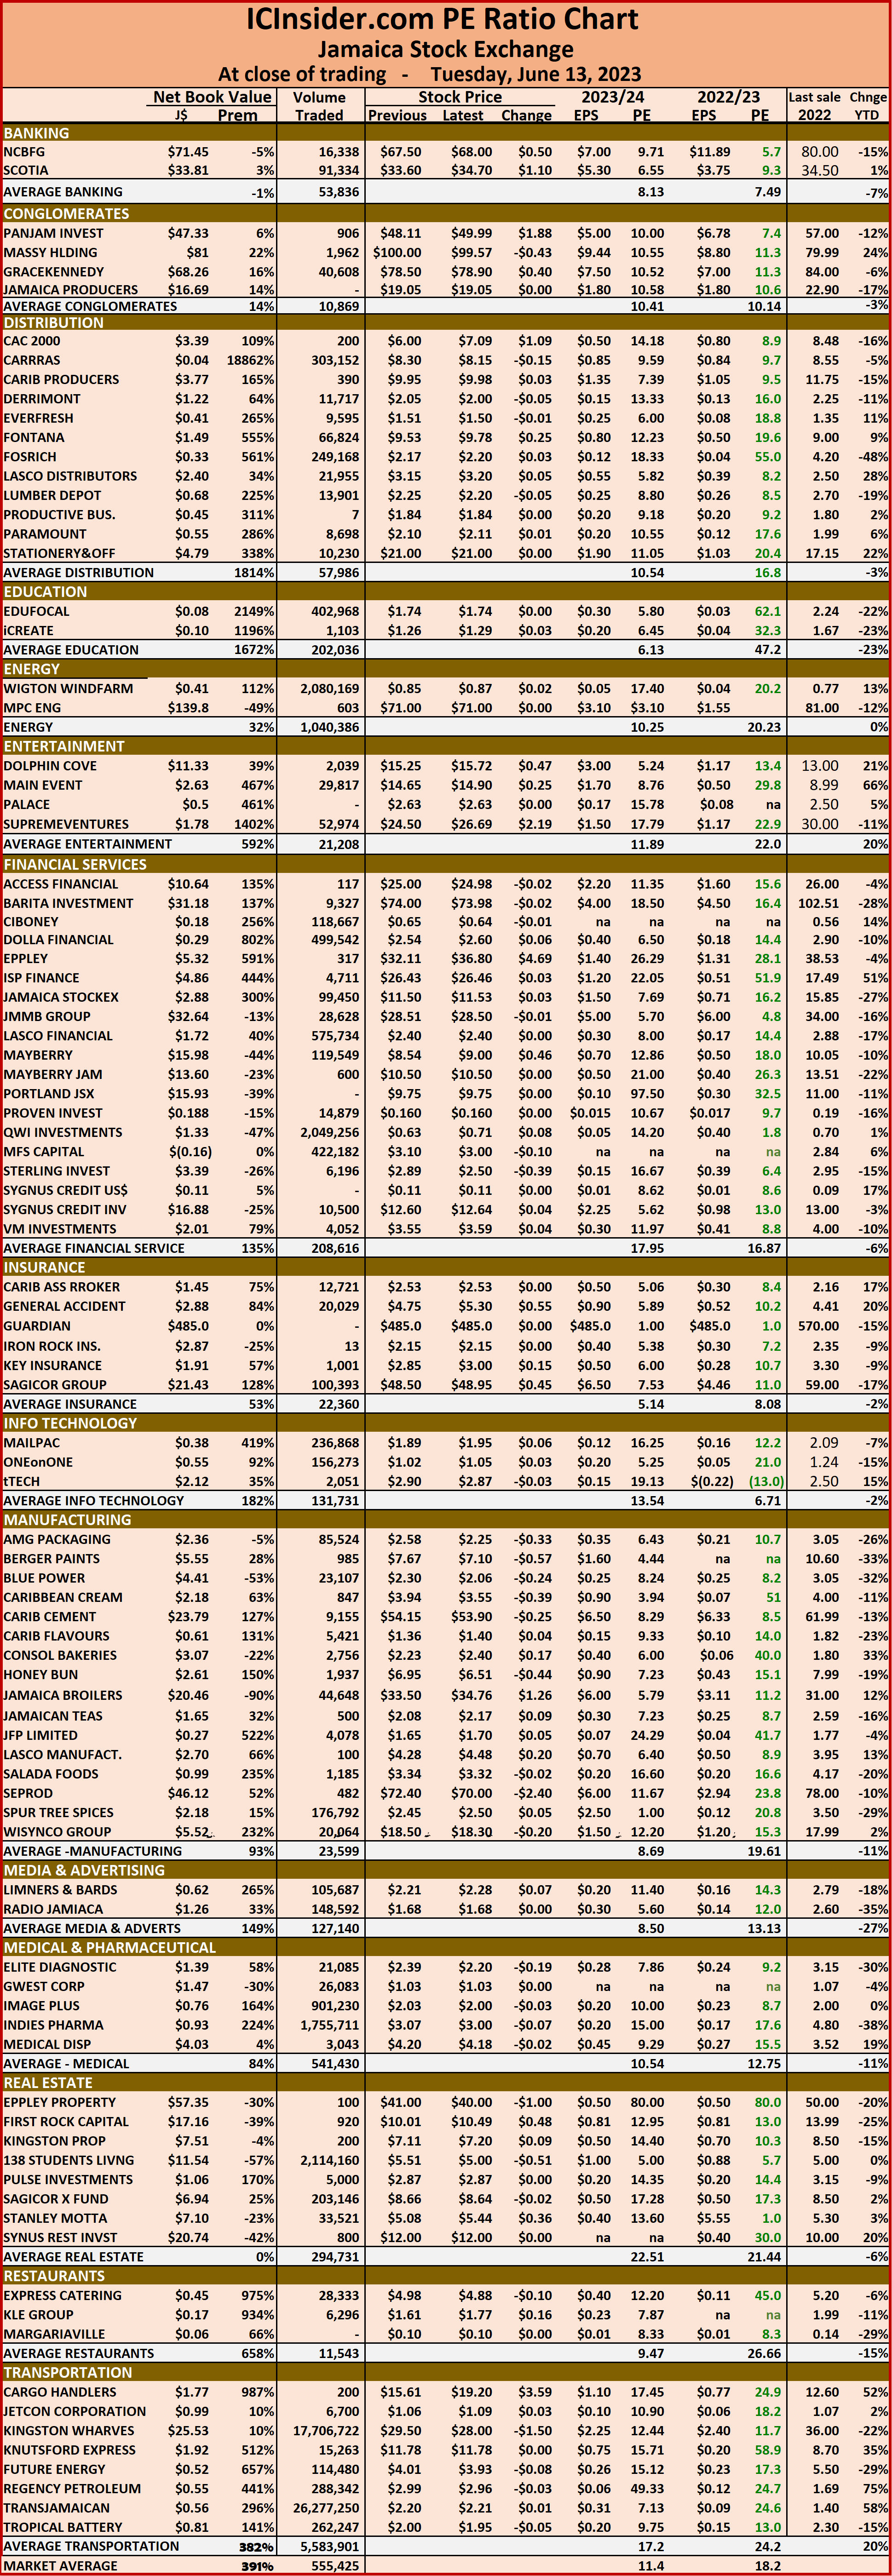
The market’s PE ratio ended at 18.2 on 2022-23 earnings and 11.4 times those for 2023-24 at the close of trading.
Investors need pertinent information to successfully navigate numerous investment options in the local stock market. The ICInsider.com PE ratio chart and the more detailed daily report charts provide investors with regularly updated information to help decision-making.
Investors should use the chart to help make rational decisions when investing in stocks close to the average for the sector and not going too far from it unless there are compelling reasons to do so. This approach helps to remove emotions from investment decisions and put in on fundamentals while at the same time not being too far from the majority of investors. Investors who buy when the price of a stock is close to the average will find that they are not inclined to overpay for a stock.
The ICInsider.com PE ratio chart covers all ordinary shares on the Jamaica Stock Exchange and shows companies grouped on an industry basis, allowing easy comparisons between the same sector companies and the overall market.
The net asset value of each company is reported as a guide to assess the value of stocks based on this measure quickly. The chart also shows daily changes in stock prices and the percentage year to date price movement based on the last traded prices.
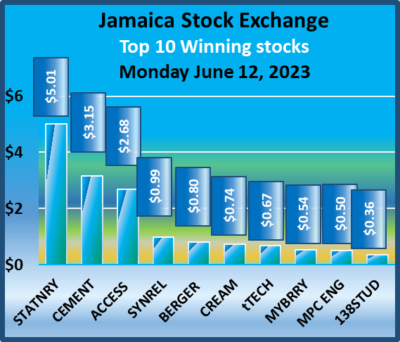
Dividends paid or payable and yields for each company are shown in the Main and Junior Markets’ daily report charts along with the closing volume pertaining to the highest bid and the lowest offer for each company.
The EPS & PE ratios are based on 2021 and 2022 actual or projected earnings, excluding major one off items. The PE Ratio is the most popular measure used to determine the value of stocks.

JSE Main Market rises Juniors & JSE USD fall

The Main Market of the Jamaica Stock Exchange broke its losing streak after closing moderately higher than Friday and Transjamaican Highway continues to hit record closing highs and closed at $2.20, but the Junior and the JSE USD Markets slipped below Friday’s close after six Junior Market stocks triggered the exchange circuit breaker at varying times during the trading session.  
At the close, the JSE Combined Market Index rose 1,083.75 points to end at 341.349.19, the All Jamaican Composite Index lost 325.98 points to close at 361,277.13, the JSE Main Index popped 1,197.20 points to 328,531.40, the Junior Market Index dipped 3.64 points to 3,802.40 and the JSE USD Market Index dipped 4.97 points to 233.94.
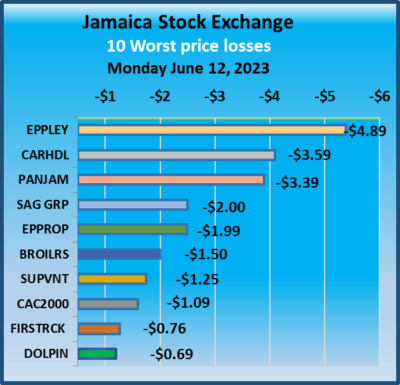
Preference shares with notable price movements but are not in the Main Market TOP10 graphs are Eppley 7.50% preference share shed $1.28 to close at $6.20, Jamaica Public Service 7% fell $10.48 in closing at $50. 138 Student Living preference share declined $6.99 and ended at $81, Productive Business 10.50%  preference share dropped $50 to $1200 and Productive Business Solutions 9.75% preference share lost 94 cents to close at $106.
At the close, investors exchanged 22,548,034 shares in all three markets on Monday compared to 52,143,554 shares on Friday. The value of stocks trading in the Junior and main markets was $90.9 million, down from $1.637 billion on Friday. Trading on the JSE USD market resulted in an exchange of 2,048,216 shares for US$53,374 compared to 857,775 units at US$11,684 on Friday.
The market’s PE ratio ended at 18.1 on 2022-23 earnings and 11.3 times those for 2023-24 at the close of trading.
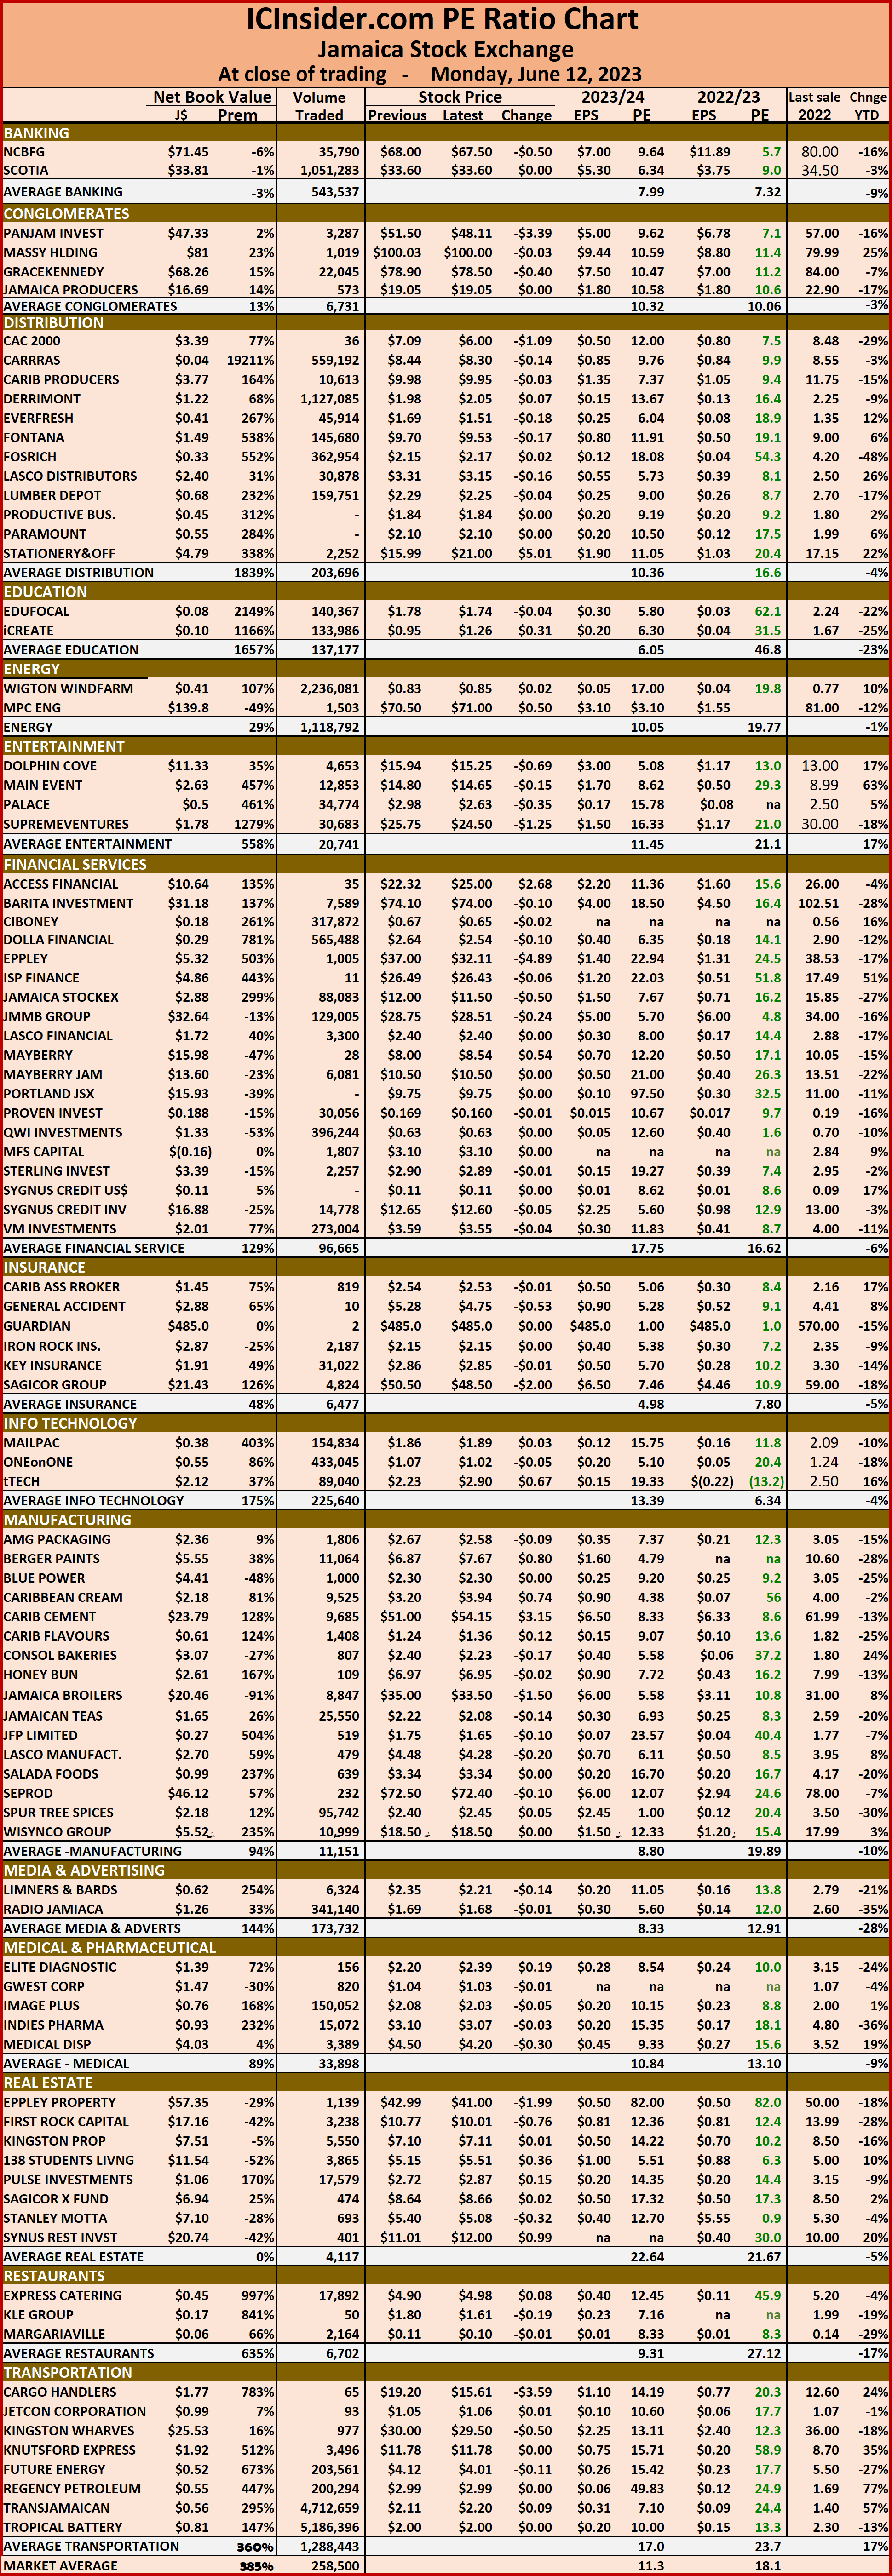
Investors need pertinent information to successfully navigate numerous investment options in the local stock market. The ICInsider.com PE ratio chart and the more detailed daily report charts provide investors with regularly updated information to help decision-making.
Investors should use the chart to help make rational decisions when investing in stocks close to the average for the sector and not going too far from it unless there are compelling reasons to do so. This approach helps to remove emotions from investment decisions and put in on fundamentals while at the same time not being too far from the majority of investors. Investors who buy when the price of a stock is close to the average will find that they are not inclined to overpay for a stock.
The ICInsider.com PE ratio chart covers all ordinary shares on the Jamaica Stock Exchange and shows companies grouped on an industry basis, allowing easy comparisons between the same sector companies and the overall market.
The net asset value of each company is reported as a guide to assess the value of stocks based on this measure quickly. The chart also shows daily changes in stock prices and the percentage year to date price movement based on the last traded prices.
Dividends paid or payable and yields for each company are shown in the Main and Junior Markets’ daily report charts along with the closing volume pertaining to the highest bid and the lowest offer for each company.
The EPS & PE ratios are based on 2021 and 2022 actual or projected earnings, excluding major one off items. The PE Ratio is the most popular measure used to determine the value of stocks.