The Jamaica Stock Exchange Main and Junior Markets bounced and the JSE USD Market declined in trading on Wednesday following a fall in the value and volume of stocks traded compared with Tuesday with the market closing with prices of 42 shares rising, 46 declining and 22 closing firm after Scotia group jumped to another yearly high in closing at $52.90, ahead of full year results due on Thursday following the trading session.
 At the close of the market, the JSE Combined Market Index climbed 1,773.00 points to 332,817.98, the All Jamaican Composite Index advanced 1,991.77 points to close at 367,907.82, the JSE Main Index rose 1,780.84 points to end trading at 320,521.35, the Junior Market Index popped 9.77 points to finish the day at 3,669.18 and the JSE USD Market Index slipped 0.24 points to 229.58.
At the close of trading, 13,963,010 shares were exchanged in all three markets, down from 29,755,467 units on Tuesday, with the value of stocks traded on the Junior and Main markets amounted to $62.94 million, well below the $338 million on the previous day. The JSE USD market closed with an exchange of 116,069 shares for US$3,778 well below the 914,504 units at US$33,725 on Tuesday.
In Main Market activity, Wigton Energy led trading with 5.71 million stocks followed by Transjamaican Highway with 2.48 million shares and Massy Holdings with 250,503 units.
In Junior Market, EduFocal led trading with 856,109 stocks followed by One Great Studio with 727,977 shares and Image Plus with 423,609 units.
In the preference segment, Jamaica Public Service 7% shed $2 to finish at $43, 138 Student Living preference share popped $100.31 and ended at $320.31. The market’s PE ratio, the most popular measure used to value stocks, ended at 13.8 based on 2024-25 projected earnings and 20.5 based on the 2023-24 historical earnings. The ICInsider.com PE ratio chart and other more detailed daily charts provide investors with regularly updated information to help decision-making. The PE ratio chart covers all of the ordinary shares on the Jamaica Stock Exchange and are grouped by industry, allowing for easy comparisons within a sector and the overall market. The earnings per share (EPS) and PE ratios are based on 2024 and 2024 actual or projected earnings, excluding major one time income or expense.
Pertinent information is required to navigate numerous investment options successfully in the stock market. The chart should be used in making rational decisions when investing in stocks close to the sector average, not going too far from it unless there are compelling reasons to do so. This approach helps to remove emotions from investment decisions and place them on fundamentals while at the same time not being too far from the majority of investors. Investors who buy when the price of a stock is close to the average will find that they are not inclined to overpay for a stock. 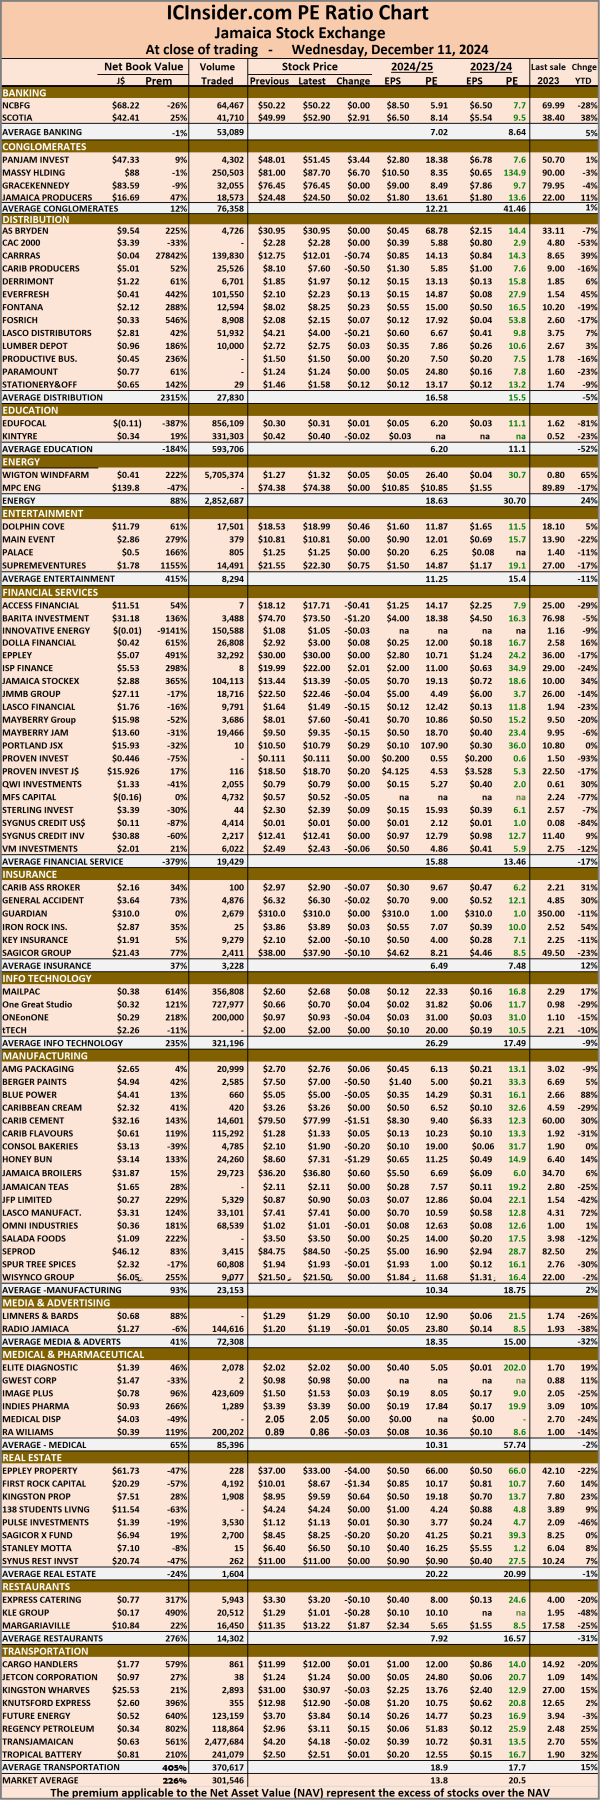 The net asset value of each company is incorporated into the chart. Investors can use this measure to assess stock values. The chart also shows daily changes in stock prices and the percentage year to date price movement based on the last traded prices. Dividends that are paid or are due to be paid and yields for each company are shown in the Main and Junior Markets’ daily report charts, along with the closing volume of the highest bid and the lowest offer for each company.
 The market closed with trading of 5,232,080 shares for $6,551,817 compared with 3,978,976 units at $11,386,078 on Monday.
 The Junior Market ended trading with an average PE Ratio of 12.9, based on the last traded prices in conjunction with earnings projected by ICInsider.com for financial years ending around August 2025.
 GWest Corporation advanced 7 cents to end at 98 cents after an exchange of a mere 33 shares. ISP Finance slipped $3.93 to close at $19.99 with investors dealing in just 10 units, KLE Group rose 12 cents to finish at $1.29 in an exchange of a mere 12 stocks, Mailpac Group slipped 8 cents and ended at $2.60 with 28,715 stock units crossing the market. Regency Petroleum skidded 15 cents to $2.96 with 46,616 shares switching owners, Spur Tree Spices climbed 11 cents to close at $1.94 with 103,476 stocks clearing the market and Stationery and Office Supplies lost 8 cents to close at $1.46 and ended with an exchange of 16,293 units.
 Prices of securities trading are those for the last transaction of each stock unless otherwise stated.
 At the close of the market, the JSE Combined Market Index dipped 1,776.47 points to conclude trading at 331,044.98, the All Jamaican Composite Index sank 2,656.02 points to 365,916.05, the JSE Main Index shed 1,625.73 points to 318,740.51, the Junior Market Index lost 30.94 points to end at 3,659.41, and the JSE USD Market Index declined 2.02 points to close at 229.82.
 The market’s PE ratio, the most popular measure used to value stocks, ended at 13.8 based on 2024-25 projected earnings and 20.3 based on 2023-24 historical earnings. The ICInsider.com PE ratio chart and the other more detailed daily charts provide investors with regularly updated information to help in decision-making. The PE ratio chart covers all ordinary shares on the Jamaica Stock Exchange, grouped by industry, allowing for easy comparisons within a sector and the overall market. The earnings per share (EPS) and PE ratios are based on 2023 and 2024 actual or projected earnings, excluding major one time income or expense.
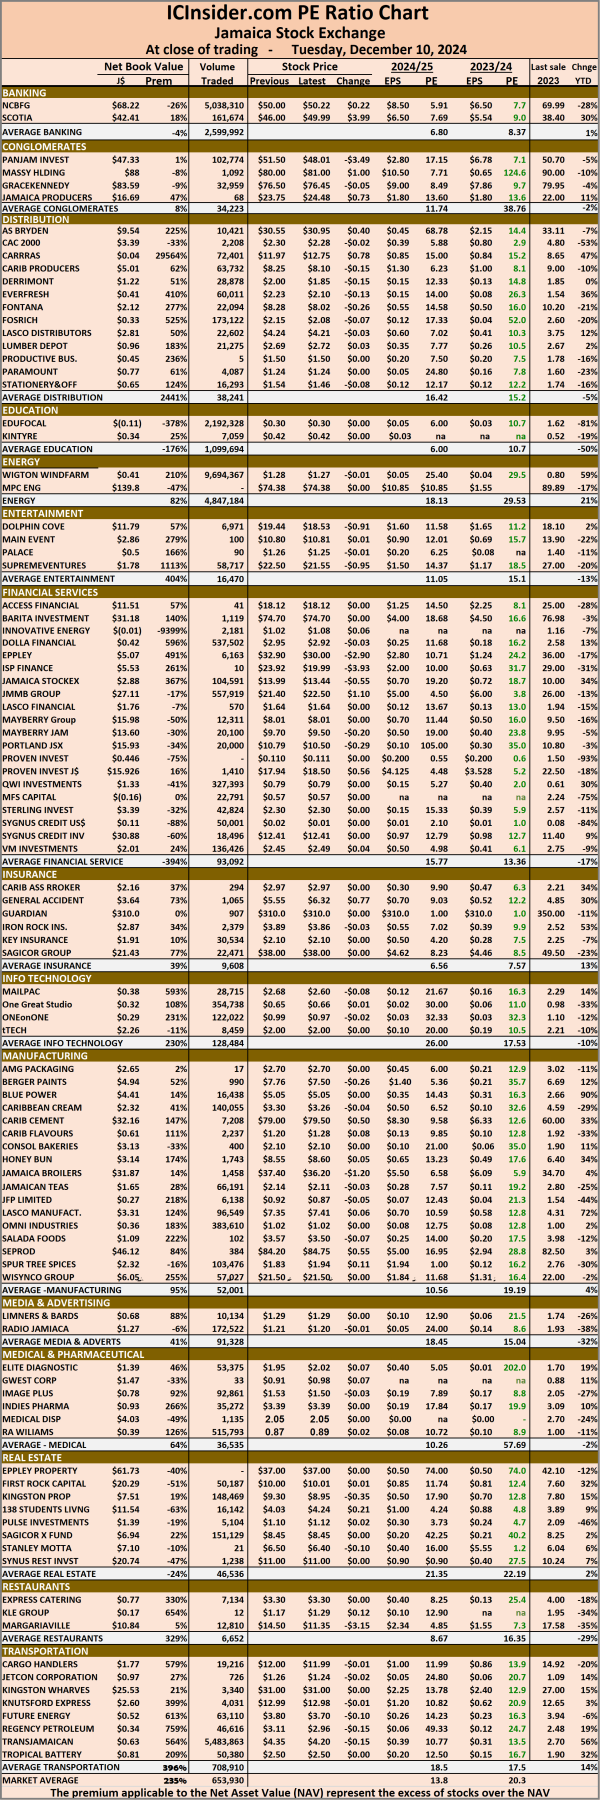
 The market finished trading in 3,978,976 shares for $11,386,078 down from 127,010,636 units at $430,363,473 on Friday. Trading ended with an average of 82,895 shares at $237,210 compared with 2,822,459 stocks at $9,563,633 on Friday with the month to date, averaging 596,875 stock units at $1,896,907 compared to 704,140 stock units at $2,243,278 on the previous day and November with an average of 309,920 shares at $766,307. Dolla Financial led trading with 706,006 shares for 17.7 percent of total volume followed by Indies Pharma with 492,394 units for 12.4 percent of the day’s trade and RA Williams with 469,363 stock units for 11.8 percent market share. At the close of trading, the Junior Market Index advanced 24.31 points to settle at 3,690.35. The Investor’s Choice bid-offer indicator shows five stocks ended with bids higher than their last selling prices and two with lower offers. The Junior Market ended trading with an average PE Ratio of 13, based on last traded prices in conjunction with earnings projected by ICInsider.com for financial years ending around August 2025. At the close of market activity,
 Access Financial rallied 62 cents to close at $18.12 after a transfer of a mere 7 stocks, CAC 2000 dipped 13 cents to $2.30 in trading 177 units, Caribbean Flavours sank 12 cents to $1.20 after 46,784 shares were traded. Consolidated Bakeries rose 15 cents to close at $2.10 with 1,438 units changing hands, Derrimon Trading popped 18 cents to finish at $2 with just 118 shares changing hands Elite Diagnostic slipped 10 cents and ended at $1.95 in trading 30,679 stocks. Everything Fresh advanced 13 cents to $2.23 with 5,107 units crossing the market, Express Catering lost 19 cents and ended at $3.30 with an exchange of 46,961 stock units, Fontana rose 12 cents to close at $8.28 and closed with 418,303 shares changing hands. Future Energy rallied 10 cents to end at $3.80 in an exchange of 108,175 units, GWest Corporation declined 7 cents to close at 91 cents with 473 stocks clearing the market, Indies Pharma gained 9 cents to finish at $3.39 after an exchange of 492,394 stock units.
 KLE Group rose 16 cents and ended at $1.17 with investors trading 222 shares, Knutsford Express rallied 39 cents to $12.99 as 7,154 stock units crossed the exchange, Lasco Financial popped 10 cents to end at $1.64 with 4,455 units switching owners. Mailpac Group gained 8 cents to close at $2.68 as investors exchanged 55,907 stock units, Medical Disposables increased 7 cents to close at $2.05 with a transfer of 15,418 shares, Paramount Trading climbed 19 cents to finish at $1.24 with investors swapping 15,376 stock units and Stationery and Office Supplies advanced 8 cents to $1.54 in an exchange of 21,050 units.
 Prices of securities trading are those for the last transaction of each stock unless otherwise stated.
 At the close of trading the prices of 41 shares rose, 52 declined and 22 remained firm resulting in the JSE Combined Market Index advancing 731.91 points to 332,821.45, the All Jamaican Composite Index rose 1,165.36 points to 368,572.07, the JSE Main Index increasing 583.08 points to close at 320,366.24, while the Junior Market Index rose 24.31 points to end at 3,690.35, and the JSE USD Market Index dropped 10.20 points to 231.84.
 The market’s PE ratio, the most popular measure used to value stocks, ended at 13.9 based on 2024-25 earnings and 20.3 based on 2023-24 historical earnings. The ICInsider.com PE ratio chart and other more detailed daily charts provide investors with regularly updated information to help with decision-making. The PE ratio chart covers all ordinary shares on the Jamaica Stock Exchange, grouped by industry, allowing for easy comparisons within a sector and the overall market. The earnings per share (EPS) and PE ratios are based on 2023 and 2024 actual or projected earnings, excluding major one time income or expense.
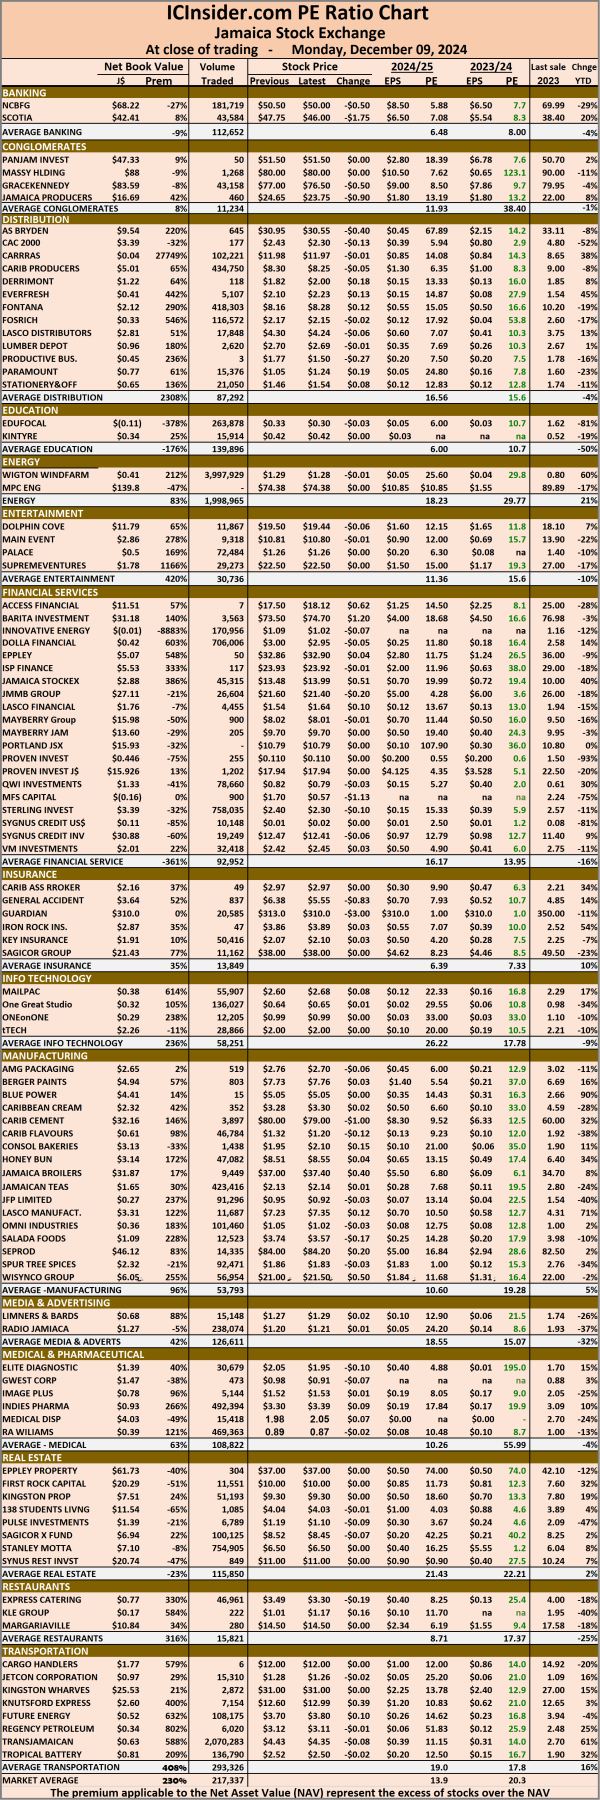 The net asset value of each company is incorporated into the chart. Investors can use this measure to assess stock values. The chart also shows daily changes in stock prices and the percentage year to date price movement based on the last traded prices. Dividends that are paid or are due to be paid and yields for each company are shown in the Main and Junior Markets’ daily report charts, along with the closing volume of the highest bid and the lowest offer for each company.
 The market closed with trading of 127,010,636 shares with a value of $430,363,473 well above 9,196,916 units at $27,433,897 on Thursday. Trading averaged 2,822,459 shares at $9,563,633 up from 204,376 units at $609,642 on Thursday with the month to date, averaging 704,140 stock units at $2,243,278 compared to 188,874 stock units at $462,652 on the previous day and November with an average of 309,920 shares at $766,307.
 The Investor’s Choice bid-offer indicator shows four stocks ended with bids higher than their last selling prices and five with lower offers.
 Indies Pharma rose 12 cents to $3.30 in an exchange of 41,303 stocks, Iron Rock Insurance advanced 38 cents to finish at $3.86 with investors dealing in 11 stock units, KLE Group shed 15 cents and ended at $1.01 after a transfer of 12,000 shares. Lumber Depot fell 8 cents to close at $2.70 with 38,000 units crossing the exchange, Medical Disposables increased 28 cents to close at $1.98 with a transfer of 1,201 stocks, Paramount Trading slipped 19 cents to end at $1.05 with investors swapping 403 stock units and Regency Petroleum gained 16 cents to $3.12 with 262,451 shares switching owners.
 Prices of securities trading are those for the last transaction of each stock unless otherwise stated.
 At the close of trading, 488,159,035 shares were exchanged in all three markets, up from 26,160,587 units on Thursday, with the value of stock units traded on the Junior and Main markets amounted to $3.43 billion, which is greater than the $210.17 million on the previous day and the JSE USD market closed with an exchange of 376,670 shares for US$19,813 down from 2,290,277 units at US$68,443 on Thursday.
 The market’s PE ratio, the most popular measure used in valuing stocks, ended at 13.8 based on 2024-25 projected earnings and 20.6 based on 2023-24 historical earnings. The ICInsider.com PE ratio chart and other more detailed daily charts provide investors with regularly updated information to help decision-making. The PE ratio chart covers all the Jamaica Stock Exchange listed ordinary shares, grouped by industry, thus allowing for easy comparisons within a sector and the overall market. The earnings per share (EPS) and PE ratios are based on 2024 and 2024 actual or projected earnings, excluding major one time income or expense.
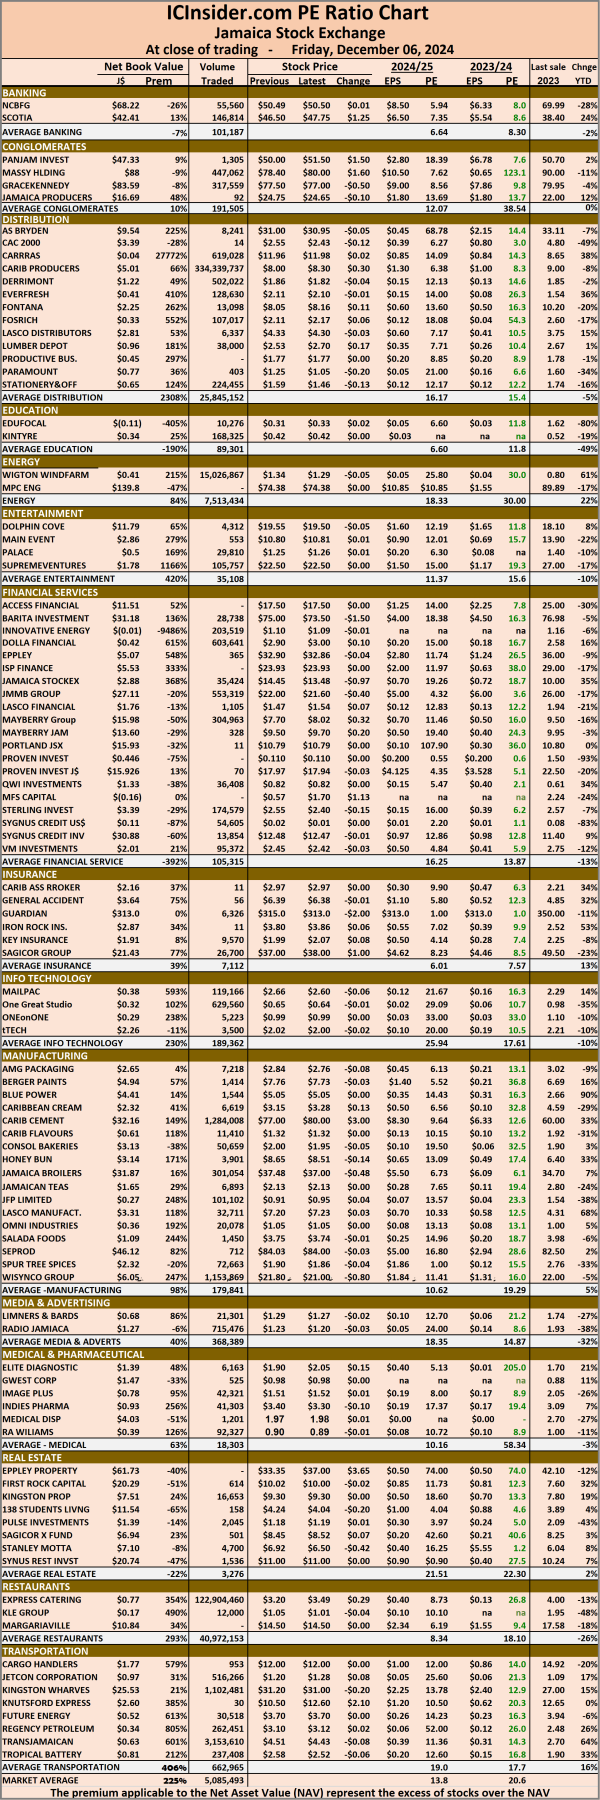 Investors can use this measure to assess stock values. The chart also shows daily changes in stock prices and the percentage year to date price movement based on the last traded prices. Dividends that are paid or are due to be paid and yields for each company are shown in the Main and Junior Markets’ daily report charts, along with the closing volume of the highest bid and the lowest offer for each company.
 Trading ended on Thursday with an exchange of 9,196,916 shares for $27,433,897 down from 13,162,541 stock units at $33,001,212 on Wednesday.
 The Junior Market ended trading with an average PE Ratio of 13, based on last traded prices in conjunction with earnings that are projected by ICInsider.com for financial years ending around August 2025.
 Jetcon Corporation increased 8 cents to $1.28 with investors dealing in just 625 units, KLE Group popped 11 cents to end at $1.16 with 153 stock units clearing the market, Knutsford Express advanced $2.10 to close at $12.60 with traders dealing in 220 units. Lasco Financial rallied 7 cents and ended at $1.54 with 572 stocks switching owners, Lumber Depot rose 25 cents to close at $2.78 with 21,865 shares crossing the market, Medical Disposables fell 27 cents to finish at $1.70 with an exchange of 26,500 stock units. Regency Petroleum shed 14 cents and ended at $2.96 with 246,410 shares changing hands and Stationery and Office Supplies declined 12 cents to $1.47 after a transfer of 18,377 units.
 Prices of securities trading are those for the last transaction of each stock unless otherwise stated.
 At the close of the market, the JSE Combined Market Index dropped 659.81 points to 332,409.97, the All Jamaican Composite Index sank 1,110.73 points to 367,813.65, the JSE Main Index declined 718.62 points to close at 320,088.81, the Junior Market Index popped 3.82 points to close at 3,669.96, and the JSE USD Market Index lost 6.66 points to end the day at 259.86.
 The market’s PE ratio, the most popular measure used to value stocks, ended at 13.8 based on 2024-25 earnings and 20.4 based on 202-24 historical earnings. The ICInsider.com PE ratio chart and other more detailed daily charts provide investors with regularly updated information to help decision-making. The PE ratio chart covers all ordinary shares on the Jamaica Stock Exchange, grouped by industry, allowing for easy comparisons within a sector and the overall market. The earnings per share (EPS) and PE ratios are based on 2024 and 2024 actual or projected earnings, excluding one-time major time income or expense.
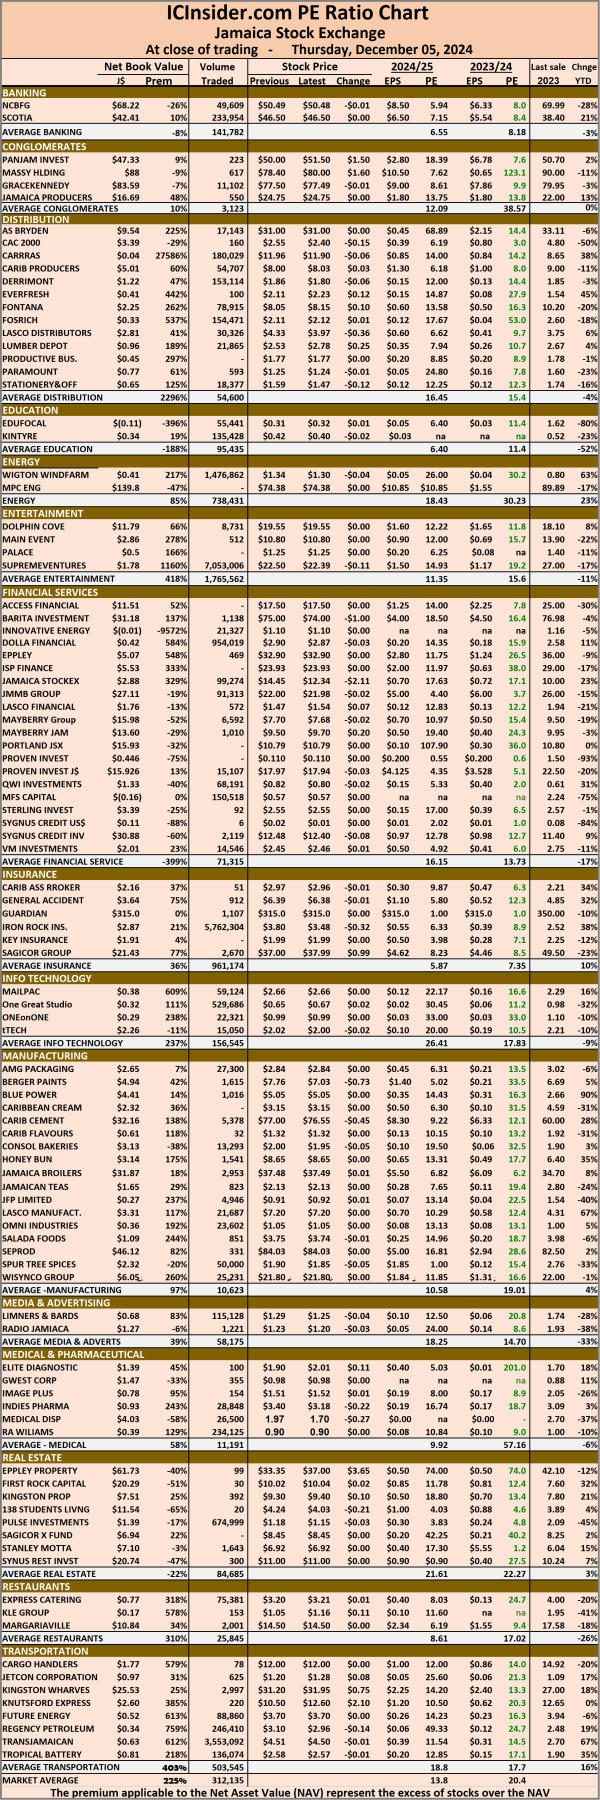 The net asset value of each company is incorporated into the chart. Investors can use this measure in assessing stock values. The chart also shows daily changes in stock prices and the percentage year to date price movement based on the last traded prices. Dividends that are paid or are due to be paid and yields for each company are shown in the Main and Junior Markets’ daily report charts, along with the closing volume of the highest bid and the lowest offer for each company.by
 The market closed, with trading of 13,162,541 shares for $33,001,212 up solidly from 4,036,639 stock units at $8,176,246 on Tuesday. Trading ended with an average of 292,501 shares at $733,360 up from 85,886 stocks at $173,963 on Tuesday with the month to date, averaging 183,891 stock units at $415,405 compared with 132,444 stock units at $264,794 on the previous day and with an average of 309,920 shares at $766,307 in November.
 At the close of the market, CAC 2000 climbed 12 cents in closing at $2.55 with 66 stock units crossing the market, Cargo Handlers dipped 39 cents to $12 after an exchange of 1,641 shares, while Consolidated Bakeries lost 19 cents to close at $2 with 7,165 stocks changing hands. Derrimon Trading skidded 10 cents to end at $1.86 with 17,153 units passing through the market, Dolla Financial sank 10 cents to $2.90 after 7,780,944 shares were traded, Dolphin Cove fell 12 cents and ended at $19.55 with investors trading 4,408 stock units. Elite Diagnostic shed 11 cents in closing at $1.90 after an exchange of 100 stocks, Everything Fresh declined 12 cents and ended at $2.11 with investors dealing in 204,416 units, Express Catering sank 9 cents to $3.20 after a transfer of 29,728 stocks. Fontana slipped 14 cents to end at $8.05 with 36,063 units clearing the market,
 Fosrich dipped 9 cents to finish at $2.11 as 267,286 shares switched owners, Indies Pharma popped 21 cents to close at $3.40 with investors trading 14,202 stocks. Jetcon Corporation rallied 10 cents to $1.20 in an exchange of 18,927 shares, Knutsford Express sank $1 to finish at $10.50 in the trading of 11,557 stock units, Lasco Financial slipped 7 cents to $1.47 after investors exchanged 1,416 stocks. Lumber Depot fell 16 cents in closing at $2.53 with a transfer of 13,291 units, Regency Petroleum skidded 8 cents to close at $3.10 and closed after an exchange of 503,789 shares, Tropical Battery rose 7 cents to end at $2.58 with 62,433 units changing hands and tTech sank 18 cents in closing at $2.02 with 6,082 stocks crossing the market.
 Prices of securities trading are those for the last transaction of each stock unless otherwise stated.