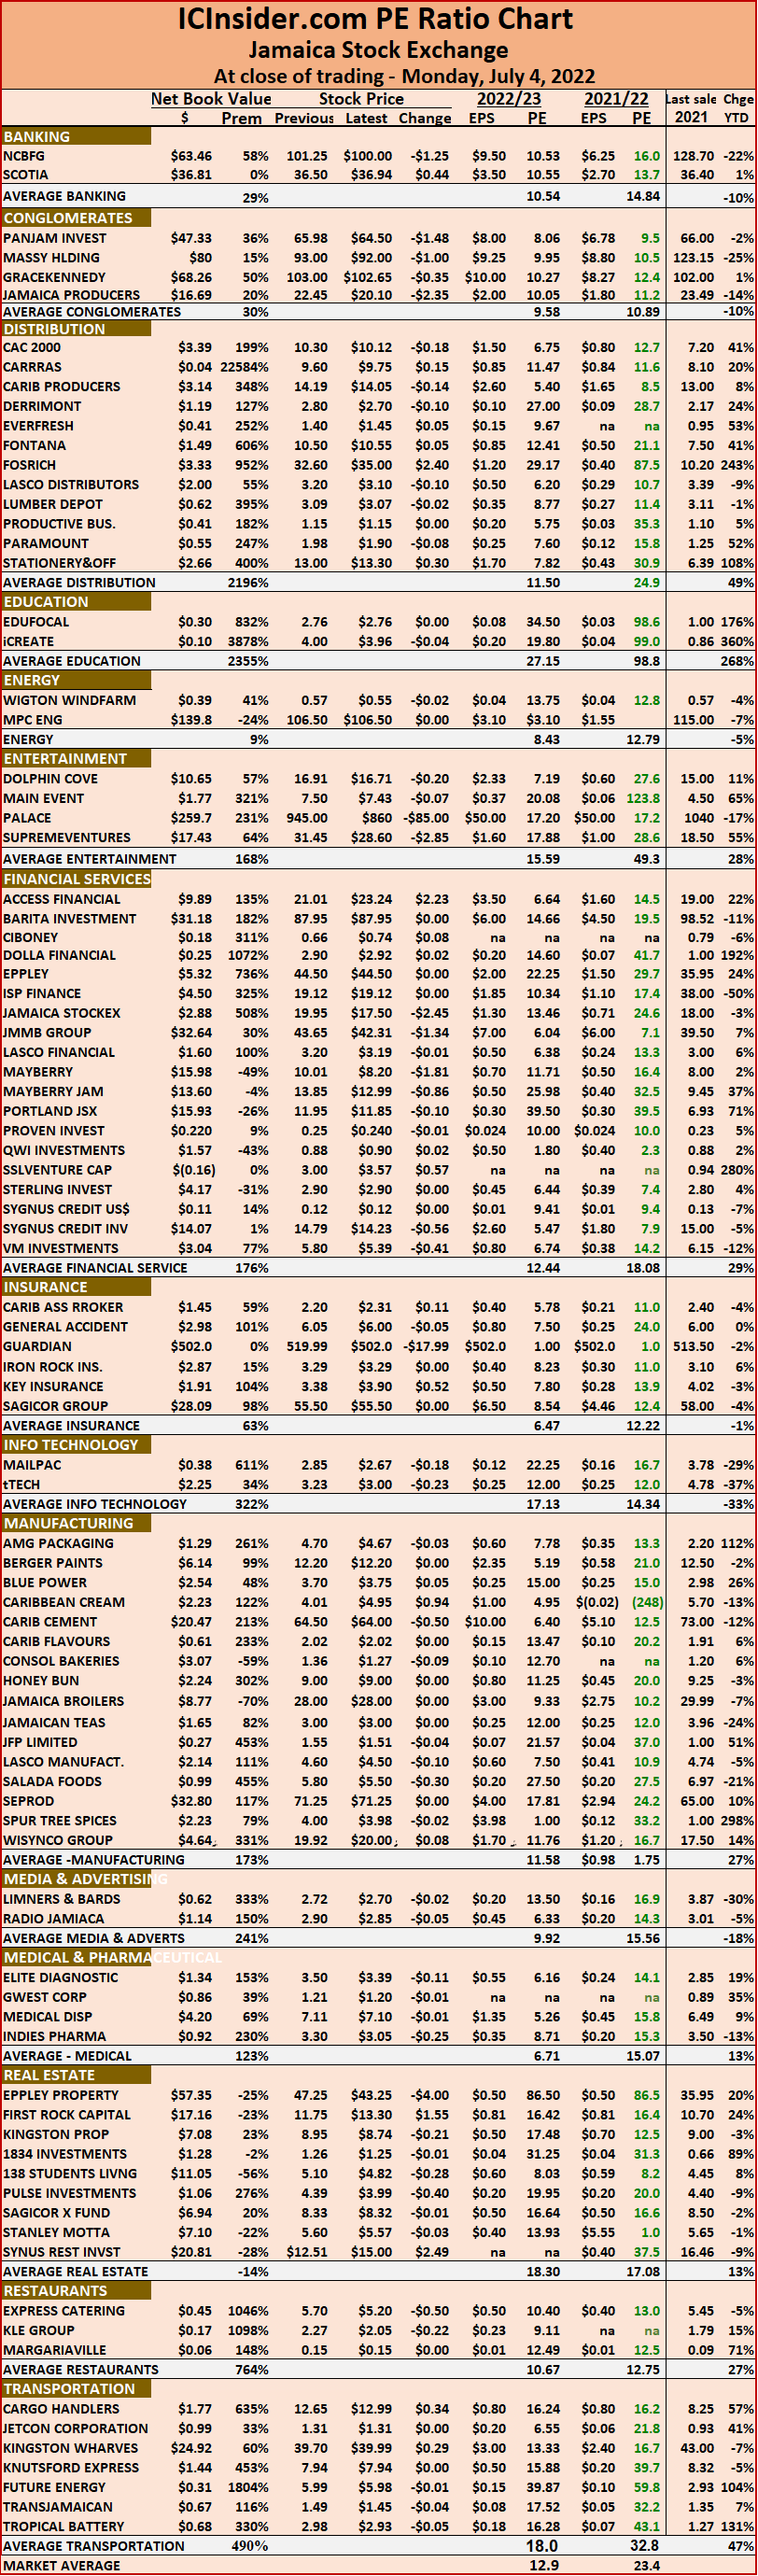
Trading remained moderate on the Jamaica Stock Exchange on Monday with 17,383,723 shares traded in the overall market, with a value of just $108.2 million, while the JSE USD market ended with US$18,398 passing through the market as the market closed with mixed results flowing from the current consolidating mood of the market.
 The JSE Combined Index lost 862.36 points to end at 394,167.02, while the All Jamaican Composite Index dropped 1,389.45 points to 434,420.67, the JSE Main Index shed 1,076.84 points to 379,658.76, the Junior Market Index rose 16.07 points to 4,356.28 and the JSE USD market Index popped 0.73 points to 213.56.
The market’s PE ratio ended at 23.5 based on 2021-22 earnings and 12.7 times those for 2022-23 at the close of trading.
Investors need pertinent information to successfully navigate many investment choices in the local stock market. The ICInsider.com PE ratio chart and the more detailed daily report charts provide investors with regularly updated information to help decision-making.
Investors should use the chart to help make rational investment decisions by investing in stocks close to the average for the sector and not going too far from it unless there are compelling reasons to do so. This approach helps to remove emotions from investment decisions and put in on fundamentals while at the same time not being too far from the majority of investors. Investors who buy when the price of a stock is close to the average will find that they are not inclined to overpay for a stock.
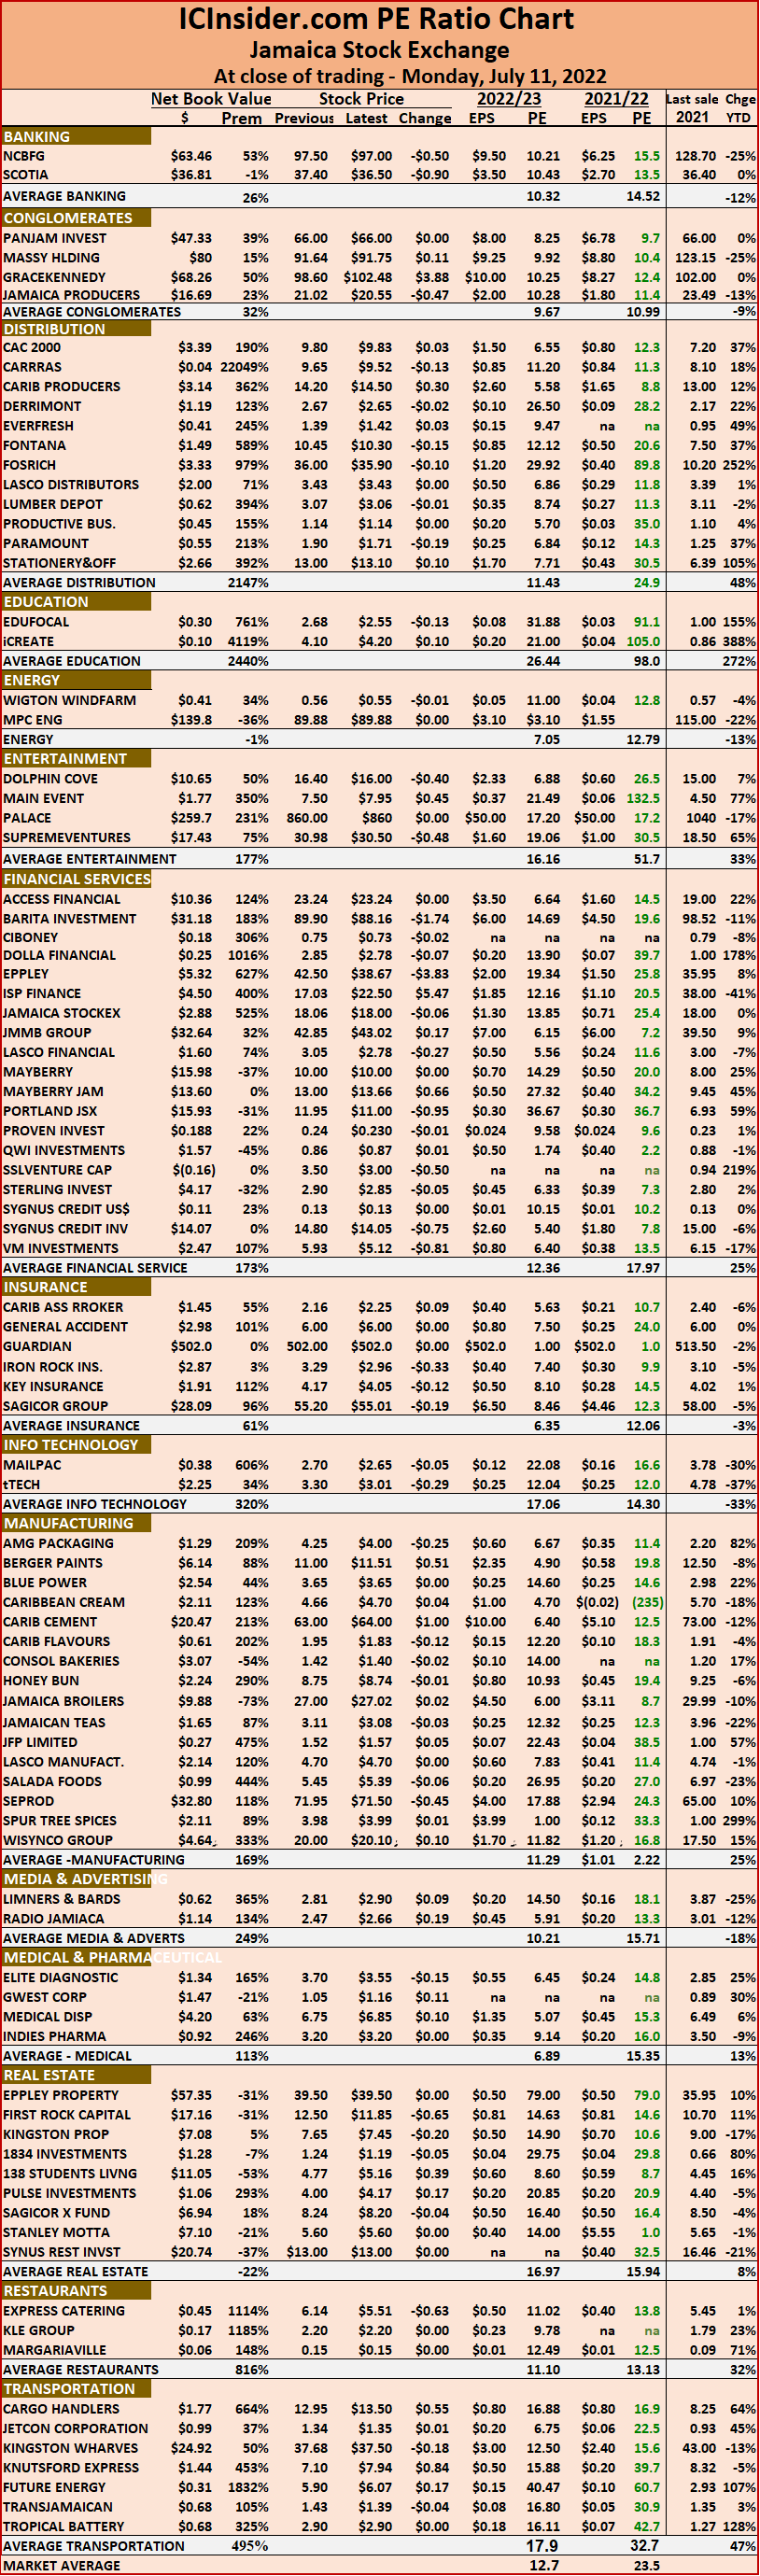 The ICInsider.com PE Ratio chart covers all ordinary shares on the Jamaica Stock Exchange. It shows companies grouped on an industry basis, allowing easy comparisons between the same sector companies and the overall market.
The net asset value of each company is reported as a guide to assess the value of stocks based on this measure quickly. The chart also shows daily changes in stock prices and the percentage year to date price movement based on the last traded prices. Dividends payable and yields for each company are shown in the Main and Junior Markets’ daily report charts that show the closing volume for the bids and offers.
The EPS & PE ratios are based on 2021 and 2022 actual or projected earnings, excluding major one off items. The PE Ratio is the most popular measure used to determine the value of stocks.
Decline for JSE Main Market
Decline for Jamaican Stock Exchange
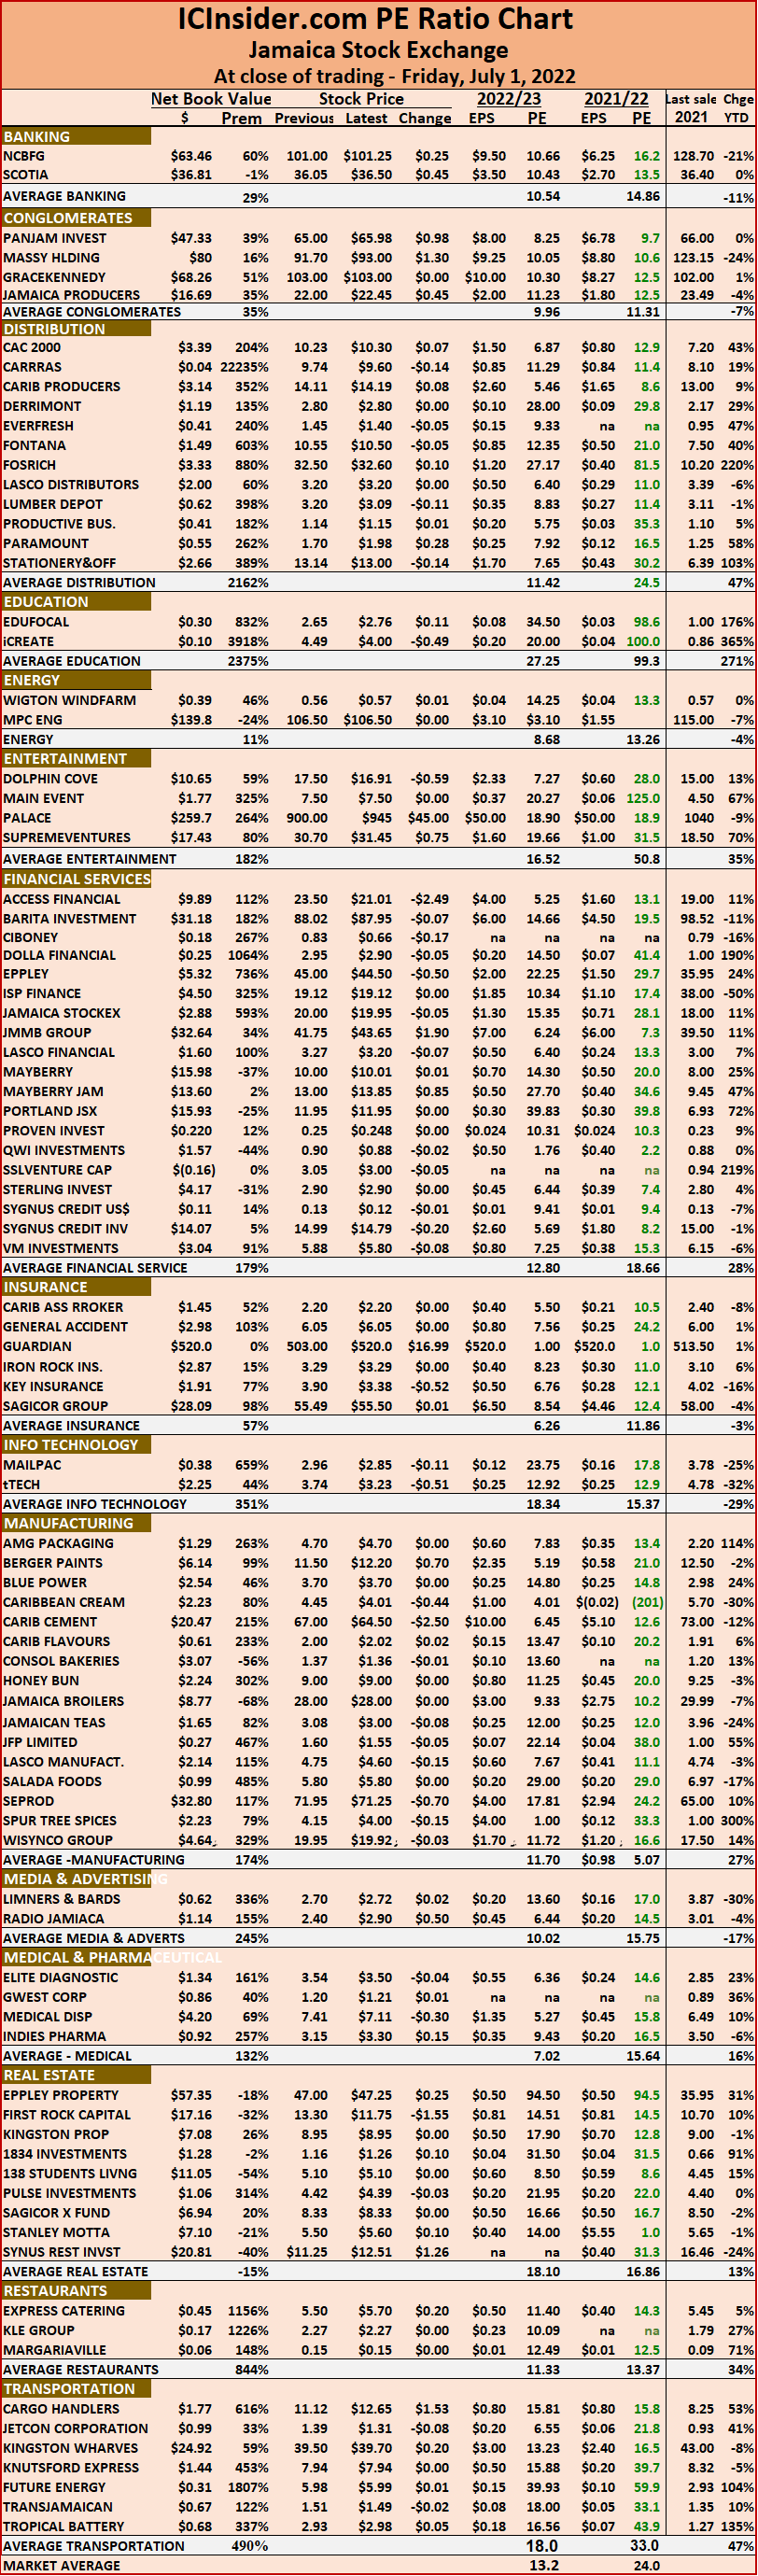
Trading declined moderately on the Jamaica Stock Exchange on Friday with 17,172,004 shares traded in the overall market, with an exchange of $128.2 million worth of shares, while the JSE USD market ended with US$8,982 passing through the market as all three markets suffered declines in their indices.
 The JSE Combined Index lost 1,232.06 points to end at 395,029.38, while the All Jamaican Composite Index dropped 638.67 points to 436,010.12, the JSE Main Index shed 1,167.36 points to 380,735.60, the Junior Market Index slipped 25.44 points to 4,341.21 and the JSE USD market Index dipped 1.97 points to 212.83.
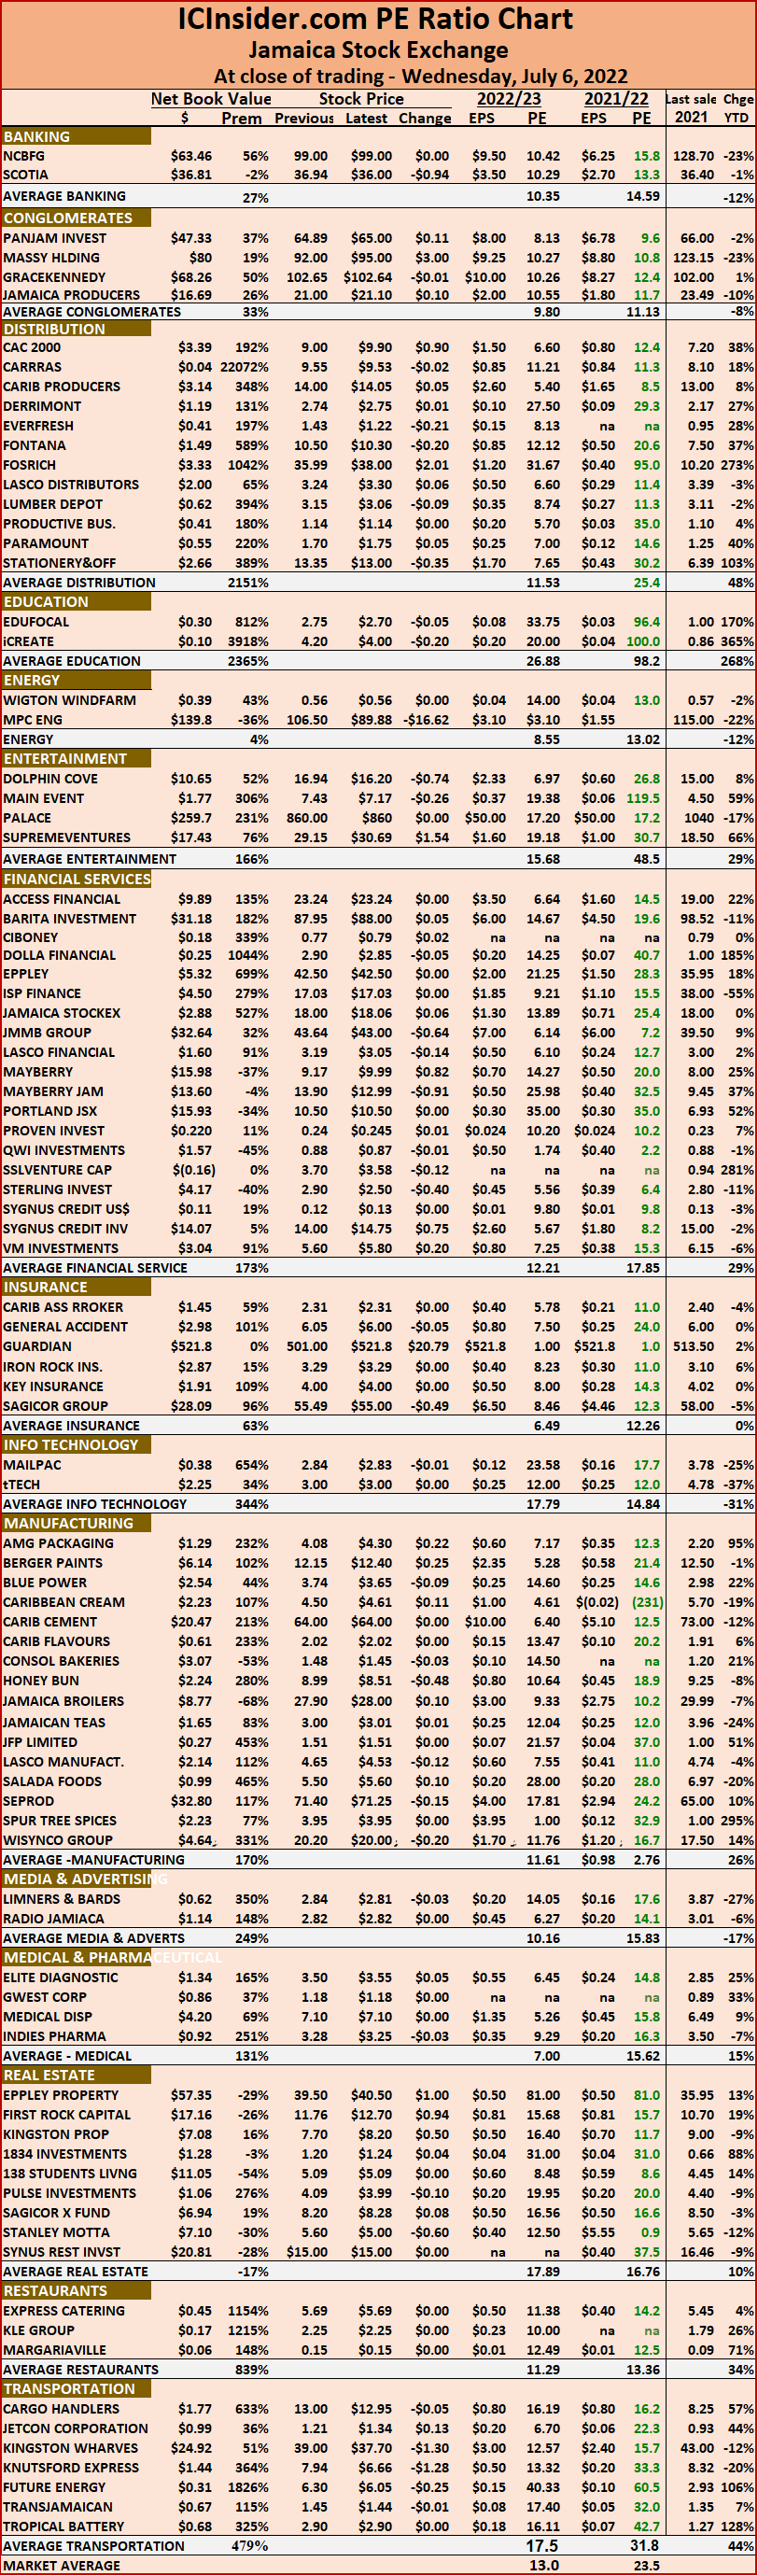
The market’s PE ratio ended at 23.6 based on 2021-22 earnings and 13 times those for 2022-23 at the close of trading.
Investors need pertinent information to successfully navigate the many investment choices, in the local stock market. The ICInsider.com PE ratio chart and the more detailed daily report charts provide investors with regularly updated information to help decision-making.
Investors should use the chart to help make rational investment decisions by investing in stocks close to the average for the sector and not going too far from it unless there are compelling reasons to do so. This approach helps to remove emotions from investment decisions and put in on fundamentals while at the same time not being too far from the majority of investors. Investors who buy when the price of a stock is close to the average will find that they are not inclined to overpay for a stock.
 The ICInsider.com PE Ratio chart covers all ordinary shares on the Jamaica Stock Exchange. It shows companies grouped on an industry basis, allowing easy comparisons between the same sector companies and the overall market.
The net asset value of each company is reported as a guide to assess the value of stocks based on this measure quickly. The chart also shows daily changes in stock prices and the percentage year to date price movement based on the last traded prices. Dividends payable and yields for each company are shown in the Main and Junior Markets’ daily report charts that show the closing volume for the bids and offers.
The EPS & PE ratios are based on 2021 and 2022 actual or projected earnings, excluding major one off items. The PE Ratio is the most popular measure used to determine the value of stocks.
Jamaican Stock Exchange mostly rise
Trading remained moderate on the Jamaica Stock Exchange on Thursday with 18,818,877 shares traded in the overall market, ending with $194.5 million worth of shares trading, while the JSE USD market ended with US$49,241 passing through the market.
 The main market closed slightly higher than on Wednesday while the Junior Market slipped modestly. At the close, the JSE Combined Index rose 232.92 points to 396,261.44, while the All Jamaican Composite Index popped 1,484.02 points to 436,648.80, the JSE Main Index popped 331.94 points to 381,902.96, the Junior Market Index slipped 4.54 points to 4,356.89 and the JSE USD market Index gained 1.01 points to close at 214.80 The market’s PE ratio ended at 23.5 based on 2021-22 earnings and 13 times those for 2022-23 at the close of trading.
Investors need pertinent information to successfully navigate many investment choices, in the local stock market. The ICInsider.com PE ratio chart and the more detailed daily report charts provide investors with regularly updated information to help decision-making.
Investors should use the chart to help make rational investment decisions by investing in stocks close to the average for the sector and not going too far from it unless there are compelling reasons to do so. This approach helps to remove emotions from investment decisions and put in on fundamentals while at the same time not being too far from the majority of investors. Investors who buy when the price of a stock is close to the average will find that they are not inclined to overpay for a stock.
 The ICInsider.com PE Ratio chart covers all ordinary shares on the Jamaica Stock Exchange. It shows companies grouped on an industry basis, allowing easy comparisons between the same sector companies and the overall market.
The net asset value of each company is reported as a guide to assess the value of stocks based on this measure quickly. The chart also shows daily changes in stock prices and the percentage year to date price movement based on the last traded prices. Dividends payable and yields for each company are shown in the Main and Junior Markets’ daily report charts that show the closing volume for the bids and offers.
The EPS & PE ratios are based on 2021 and 2022 actual or projected earnings, excluding major one off items. The PE Ratio is the most popular measure used to determine the value of stocks.
Back to normal for Jamaican Stock Exchange
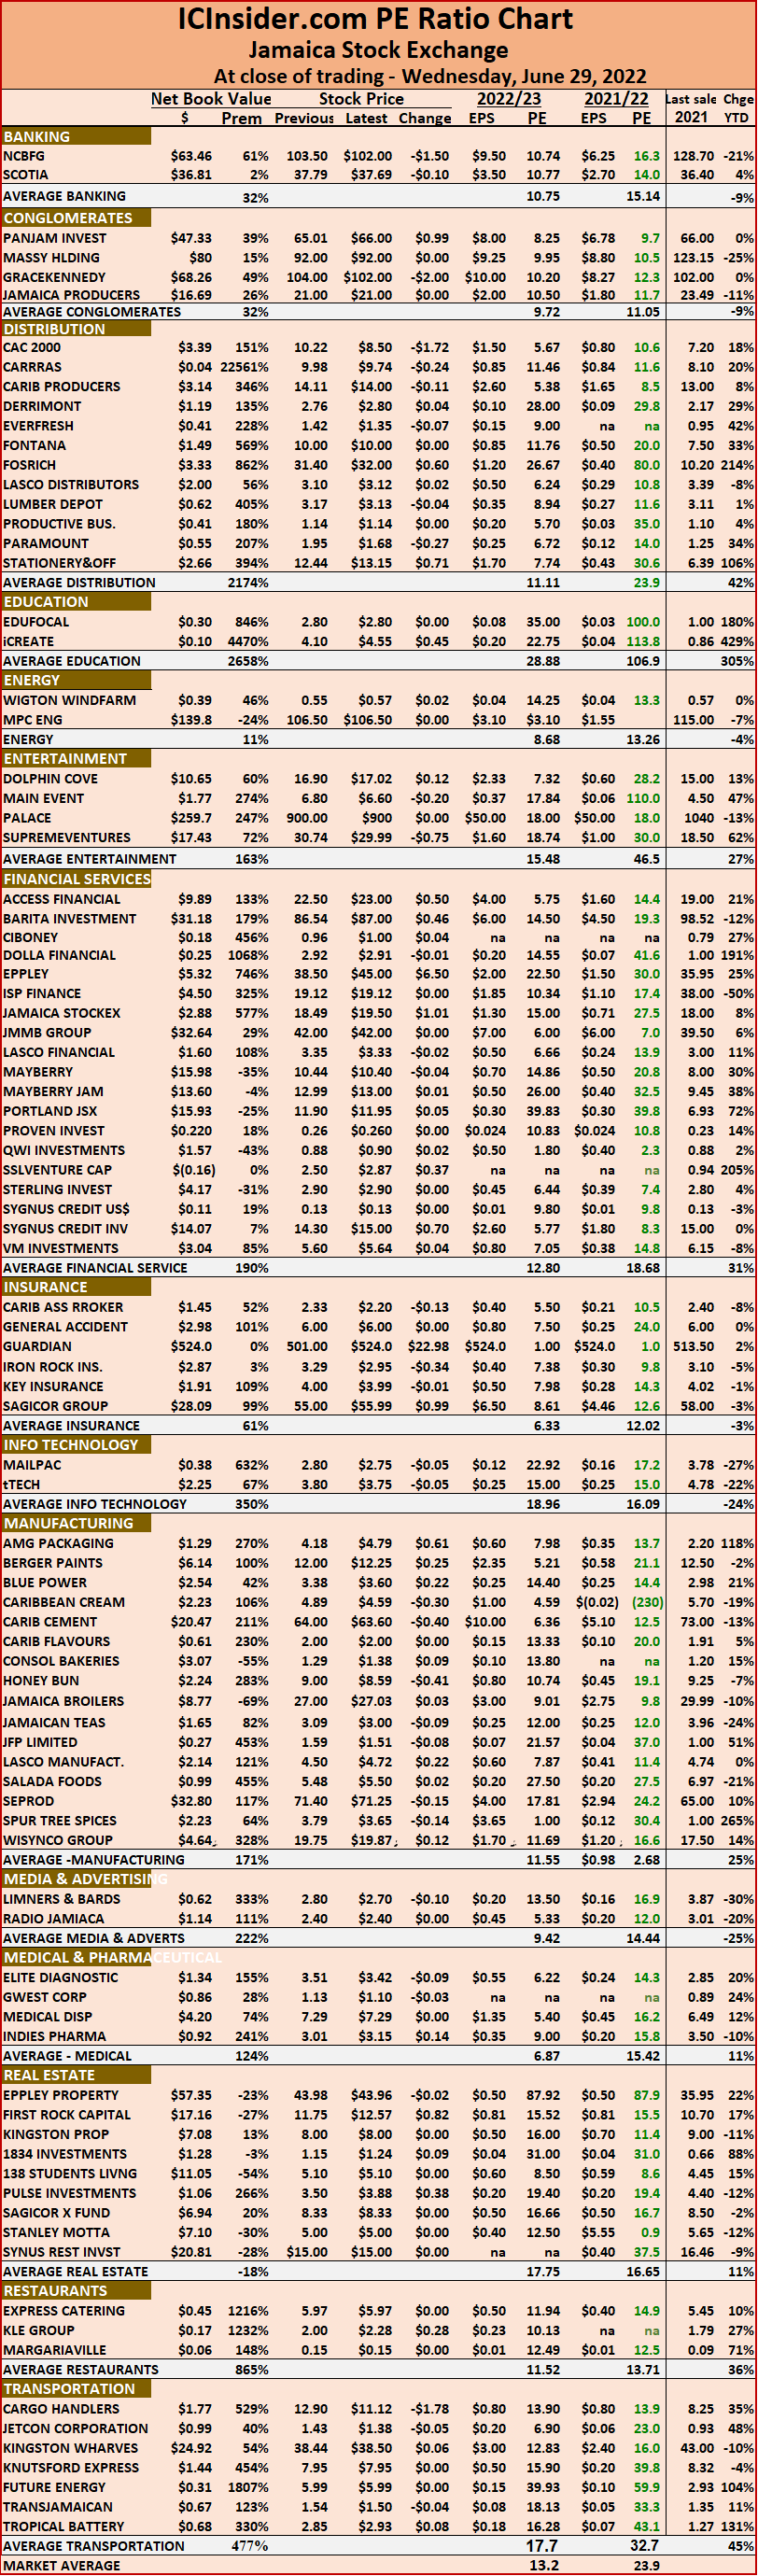
Trading fell back in line with more recent activities on the Jamaica Stock Exchange, following Tuesday’s big Future Energy Source trade of 241.4 million, valued at $1.44 billion as the markets closed on Wednesday with just 18,045,079 shares traded in the overall market and the Main and Junior Markets ending with $122.8 million worth of shares trading and the JSE USD market, with US$$15,558.
 The Main Market ended lower but the Junior Market gained. The JSE Combined Index slipped 16.78 points to 396,028.51, while the All Jamaican Composite Index dived 2,438.78 points to 435,164.77 and the JSE Main Index fell 488.85 points to close at 381,571.02. The Junior Market index rallied 48.92 points to 4,365.44 and the JSE USD market index slipped 1.09 points to 213.79.
The market’s PE ratio ended at 23.5 based on 2021-22 earnings and 13 times those for 2022-23 at the close of trading.
Investors need pertinent information to successfully navigate many investment choices, in the local stock market. The ICInsider.com PE ratio chart and the more detailed daily report charts provide investors with regularly updated information to help decision-making.
Investors should use the chart to help make rational investment decisions by investing in stocks close to the average for the sector and not going too far from it unless there are compelling reasons to do so. This approach helps to remove emotions from investment decisions and put in on fundamentals while at the same time not being too far from the majority of investors. Investors who buy when the price of a stock is close to the average will find that they are not inclined to overpay for a stock.
 The ICInsider.com PE Ratio chart covers all ordinary shares on the Jamaica Stock Exchange. It shows companies grouped on an industry basis, allowing easy comparisons between the same sector companies and the overall market.
The net asset value of each company is reported as a guide to assess the value of stocks based on this measure quickly. The chart also shows daily changes in stock prices and the percentage year to date price movement based on the last traded prices. Dividends payable and yields for each company are shown in the Main and Junior Markets’ daily report charts that show the closing volume for the bids and offers.
The EPS & PE ratios are based on 2021 and 2022 actual or projected earnings, excluding major one off items. The PE Ratio is the most popular measure used to determine the value of stocks.
Fesco dominates Jamaican Stock Exchange
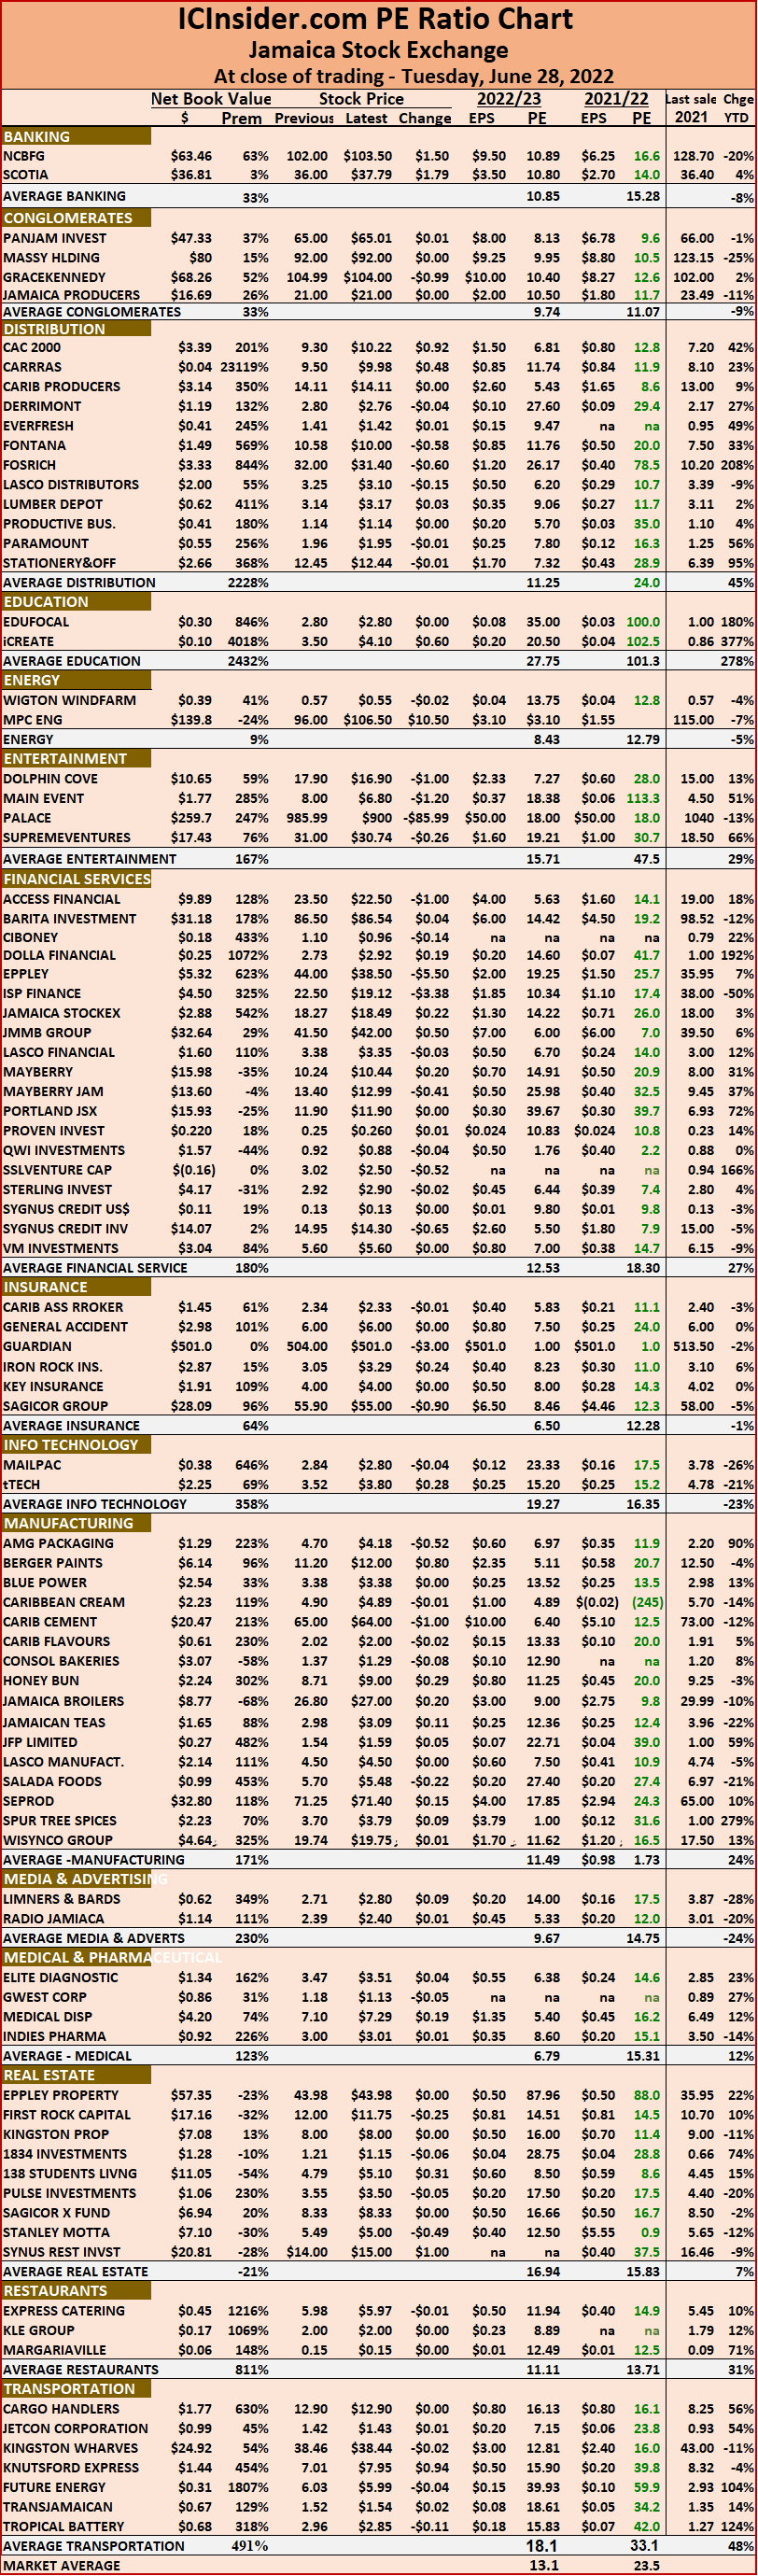
Future Energy Source (Fesco) was the most prominent trade at the close of the Jamaica Stock Exchange on Tuesday with 241.4 million shares traded valued at $1.44 billion, accounting for the largest portion of the 257,507,861 shares traded in all markets, with the value traded in the Main and Junior Markets ending at $1.55 billion and in the JSE USD market, just US$2,776.
 The market closed with the JSE Combined Index rising 500.40 points to close at 396,045.29, while the All Jamaican Composite Index popped 1,073.75 points to 437,603.55. The JSE Main Index gained 631.05 points to end at 382,059.87, the Junior Market Index dipped 9.95 points to 4,316.52 and the JSE USD market Index slipped 0.26 points to 214.88.
The market’s PE ratio ended at 23.8 based on 2021-22 earnings and 13 times those for 2022-23 at the close of trading.
Investors need pertinent information to successfully navigate many investment choices, in the local stock market. The ICInsider.com PE ratio chart and the more detailed daily report charts provide investors with regularly updated information to help decision-making.
Investors should use the chart to help make rational investment decisions by investing in stocks close to the average for the sector and not going too far from it unless there are compelling reasons to do so. This approach helps to remove emotions from investment decisions and put in on fundamentals while at the same time not being too far from the majority of investors. Investors who buy when the price of a stock is close to the average will find that they are not inclined to overpay for a stock.
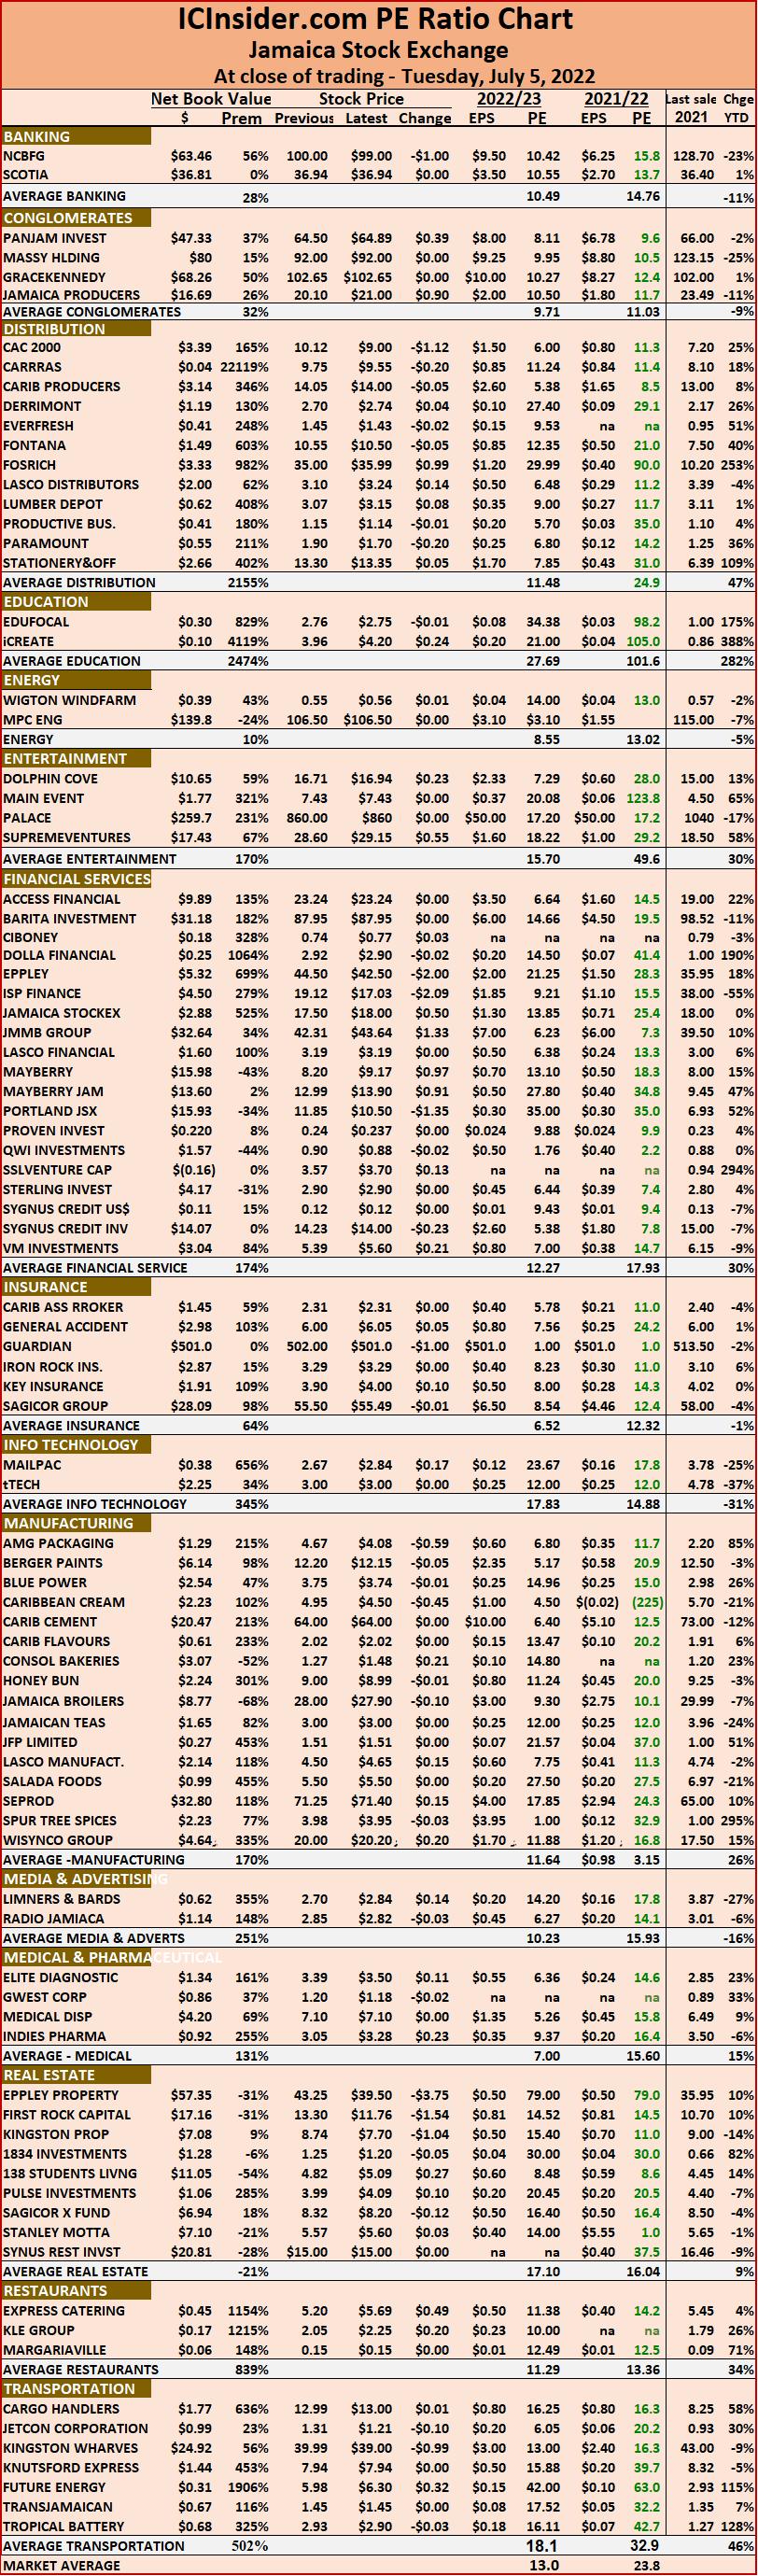 The ICInsider.com PE Ratio chart covers all ordinary shares on the Jamaica Stock Exchange. It shows companies grouped on an industry basis, allowing easy comparisons between the same sector companies and the overall market.
The net asset value of each company is reported as a guide to assess the value of stocks based on this measure quickly. The chart also shows daily changes in stock prices and the percentage year to date price movement based on the last traded prices. Dividends payable and yields for each company are shown in the Main and Junior Markets’ daily report charts that show the closing volume for the bids and offers.
The EPS & PE ratios are based on 2021 and 2022 actual or projected earnings, excluding major one off items. The PE Ratio is the most popular measure used to determine the value of stocks.
Trading falls sharply for Jamaican stocks
Trading ended with a big decline in the Jamaica Stock Exchange main market on Monday, while the Junior Market slipped mildly but USD based stocks enjoyed a modest rally as trading levels more than doubled Friday’s levels.
 The market closed with the JSE Combined Index falling 4,674.85 points to 395,544.89, while the All Jamaican Composite Index dropped a hefty 6,345.40 points to 436,529.89, the JSE Main Index fell 4,898.50 points to close at 381,428.82, the Junior Market index slipped 10.56 points to 4,326.47 and the JSE USD market index rose 1.05 points to 215.14.
There was an exchange of 23,054,505 shares in all markets, with the value traded in the Main and Junior Markets ending at $194.66 million and in the JSE USD market, US$11,473.
The market’s PE ratio ended at 23.4 based on 2021-22 earnings and 12.9 times those for 2022-23 at the close of trading.
Investors need pertinent information to successfully navigate many investment choices, in the local stock market. The ICInsider.com PE ratio chart and the more detailed daily report charts provide investors with regularly updated information to help decision-making.
Investors should use the chart to help make rational investment decisions by investing in stocks close to the average for the sector and not going too far from it unless there are compelling reasons to do so. This approach helps to remove emotions from investment decisions and put in on fundamentals while at the same time not being too far from the majority of investors. Investors who buy when the price of a stock is close to the average will find that they are not inclined to overpay for a stock.
 The ICInsider.com PE Ratio chart covers all ordinary shares on the Jamaica Stock Exchange. It shows companies grouped on an industry basis, allowing easy comparisons between the same sector companies and the overall market.
The net asset value of each company is reported as a guide to assess the value of stocks based on this measure quickly. The chart also shows daily changes in stock prices and the percentage year to date price movement based on the last traded prices. Dividends payable and yields for each company are shown in the Main and Junior Markets’ daily report charts that show the closing volume for the bids and offers.
The EPS & PE ratios are based on 2021 and 2022 actual or projected earnings, excluding major one off items. The PE Ratio is the most popular measure used to determine the value of stocks.
Trading falls sharply for Jamaican stocks
Trading ended mixed on the Jamaica Stock Exchange on Friday, with main market stocks gaining and Junior Market stocks mostly falling as trading levels fell from Thursday’s levels.
 The market closed with the JSE Combined Index climbing 1,890.52 points to 400,219.74 while the All Jamaican Composite Index added 2,638.98 points to end at 442875.20, the JSE Main Index gained 2,141.50 points to 386,327.32, the Junior Market index slipped 12.41 points to 4,337.03 and the JSE USD market index rose 2.44 points to close at 214.09.
Investors exchanged 21,788,058 shares in all markets, with the value traded in the Main and Junior Markets ending at just $96 million and in the JSE USD market, US$14,539.
The market’s PE ratio ended at 24 based on 2021-22 earnings and 13.2 times those for 2022-23 at the close of trading.
Investors need pertinent information to successfully navigate many investment choices, in the local stock market. The ICInsider.com PE ratio chart and the more detailed daily report charts provide investors with regularly updated information to help decision-making.
Investors should use the chart to help make rational investment decisions by investing in stocks close to the average for the sector and not going too far from it unless there are compelling reasons to do so. This approach helps to remove emotions from investment decisions and put in on fundamentals while at the same time not being too far from the majority of investors. Investors who buy when the price of a stock is close to the average will find that they are not inclined to overpay for a stock.
 The ICInsider.com PE Ratio chart covers all ordinary shares on the Jamaica Stock Exchange. It shows companies grouped on an industry basis, allowing easy comparisons between the same sector companies and the overall market.
The net asset value of each company is reported as a guide to assess the value of stocks based on this measure quickly. The chart also shows daily changes in stock prices and the percentage year to date price movement based on the last traded prices. Dividends payable and yields for each company are shown in the Main and Junior Markets’ daily report charts that show the closing volume for the bids and offers.
The EPS & PE ratios are based on 2021 and 2022 actual or projected earnings, excluding major one off items. The PE Ratio is the most popular measure used to determine the value of stocks.
Barita dominates trading to end June
Barita Investments dominated trading on the last day of June on Jamaica Stock Exchange on Thursday, accounting for 21.9 shares valued at $1.9 billion, leading the overall market value to jump sharply to $2.1 billion worth of stocks traded in Main and Junior markets as the volume of stocks trading was just shy doubling Thursday’s trades.

Barita Investments headquarters
The market closed with the JSE Combined Index climbing 1,427.58 points to 398,329.22 while the All Jamaican Composite Index rose 1,350.07 points to 440,236.22, the JSE Main Index gained 1,152.41 points to end at 384,185.82, the Junior Market index popped 38.91 points to 4,349.44 and the JSE USD market index lost 5.91 points to close at 211.65.
Investors exchanged 53,744,711 shares in all markets, with the value traded in the Main and Junior Markets ending at $1.9 billion and in the JSE USD market, US$48,827.
The market’s PE ratio ended at 24.1 based on 2021-22 earnings and 13.2 times those for 2022-23 at the close of trading.
Investors need pertinent information to successfully navigate many investment choices, in the local stock market. The ICInsider.com PE ratio chart and the more detailed daily report charts provide investors with regularly updated information to help decision-making.
Investors should use the chart to help make rational investment decisions by investing in stocks close to the average for the sector and not going too far from it unless there are compelling reasons to do so. This approach helps to remove emotions from investment decisions and put in on fundamentals while at the same time not being too far from the majority of investors. Investors who buy when the price of a stock is close to the average will find that they are not inclined to overpay for a stock.
 The ICInsider.com PE Ratio chart covers all ordinary shares on the Jamaica Stock Exchange. It shows companies grouped on an industry basis, allowing easy comparisons between the same sector companies and the overall market.
The net asset value of each company is reported as a guide to quickly assess the value of stocks based on this measure. The chart also shows daily changes in stock prices and the percentage year to date price movement based on the last traded prices. Dividends payable and yields for each company are shown in the Main and Junior Markets’ daily report charts that show the closing volume for the bids and offers.
The EPS & PE ratios are based on 2021 and 2022 actual or projected earnings, excluding major one off items. The PE Ratio is the most popular measure used to determine the value of stocks.
Jamaica Stocks higher in month end rally
Stock market trading closed with positive price movements as reflected in the gains recorded in the market indices except for a slight decline in the USD market. Recently listed, Dolla Financial seems to be finding an equilibrium price level as it closed 1 cent lower than the $2.92 on Tuesday; icreate created a buzz with the price reaching a record high of $4.70 in response to another acquisition announcement.

iCreate hits record high.
The market closed with the JSE Combined Index climbing 1,477.39 points to 396,901.64 while the All Jamaican Composite Index added 1,951.68 points to end at 438,886.15, the JSE Main Index gained 1,324.62 points to 383,033.41, the Junior Market index popped 26.55 points to 4,310.53 and the JSE USD market index lost 1.14 points to close at 217.56.
Investors exchanged 27,264,015 shares in all markets, with the value of stocks traded in the Main and Junior Markets ending at $339.2 million and in the JSE USD market, US$42,677.
The market’s PE ratio ended at 23.9 based on 2021-22 earnings and 13.2 times those for 2022-23 at the close of trading.
Investors need pertinent information to navigate many investment choices in the local stock market successfully. The ICInsider.com PE ratio chart and the more detailed daily report charts provide investors with regularly updated information to help decision-making.
Investors should use the chart to help make rational investment decisions by investing in stocks close to the average for the sector and not going too far from it unless there are compelling reasons to do so. This approach helps to take emotions out of the investment decision and put in on fundamentals while at the same time not being too far from the majority of investors. Investors who buy when the price of a stock is close to the average will find that they are not inclined to overpay for a stock.
 The ICInsider.com PE Ratio chart covers all ordinary shares on the Jamaica Stock Exchange. It shows companies grouped on an industry basis, allowing easy comparisons between the same sector companies and the overall market.
The net asset value of each company is reported as a guide to quickly assess the value of stocks based on this measure. The chart also shows daily changes in stock prices and the percentage year to date price movement based on the last traded prices. Dividends payable and yields for each company are shown in the Main and Junior Markets’ daily report charts that show the closing volume for the bids and offers.
The EPS & PE ratios are based on 2021 and 2022 actual or projected earnings, excluding major one off items. The PE Ratio is the most popular measure used to determine the value of stocks.
Stocks pull down Jamaica Stock Market
Recently listed Dolla Financial hit a low of $2.63 on Tuesday and bounced 19 cents to close at $2.92 after trading 9 million shares for 50 percent of Junior Market trading as the stock continued to trade above the average volume for Junior Market stocks.
The market closed with the JSE Combined Index losing 1,287.19 points to close at 395,424.25, while the All Jamaican Composite Index lost 883.90 points to end at 436,934.47, the JSE Main Index shed 816.45 points to 381,708.79, the Junior Market index lost 58.21 points in closing at 4,283.98 and the JSE USD market index gained 0.71 points to close at 218.70.
Investors exchanged 28,265,023 shares in all markets, with the value of stocks traded in the Main and Junior Markets ending at $244 million and in the JSE USD market, US$75,902.
The market’s PE ratio ended at 23.5 based on 2021-22 earnings and 13.1 times those for 2022-23 at the close of trading.
Investors need measures and pertinent information to navigate many investment choices in the local stock market successfully. The ICInsider.com PE ratio chart and the more detailed daily report charts provide investors with regularly updated information to help decision-making.
Investors should use the chart to help make rational investment decisions by investing in stocks close to the average for the sector and not going too far from it unless there are compelling reasons to do so. This approach helps to take emotions out of the investment decision and put in on fundamentals while at the same time not being too far from the majority of investors. Investors who buy when the price of a stock is close to the average will find that they are not inclined to overpay for a stock.
 The ICInsider.com PE Ratio chart covers all ordinary shares on the Jamaica Stock Exchange. It shows companies grouped on an industry basis, allowing easy comparisons between the same sector companies and the overall market.
The net asset value of each company is reported as a guide to quickly assess the value of stocks based on this measure. The chart also shows daily changes in stock prices and the percentage year to date price movement based on the last traded prices. Dividends payable and yields for each company are shown in the Main and Junior Markets’ daily report charts that show the closing volume for the bids and offers.
The EPS & PE ratios are based on 2021 and 2022 actual or projected earnings, excluding major one off items. The PE Ratio is the most popular measure used to determine the value of stocks.


