Investors demanding more stocks in the recent IPO issue, Dolla Financial that opened trading this week, bought 2.35 million on Friday, the most since listing on Wednesday, but had to pay $2.32 for them, but that did nothing to quench the 65 million units bid at the close at $2.32, the maximum permitted for the day as the stock rose 132 percent since listing.
 Based on the lopsided bid to offer, the stocks seem poised to hit the maximum on Monday at 3.07 as investors fight to get stocks.
The Junior Market index delivered the best performance for investors with the Index surging a solid 80.93 points to 4,202.44 as it helped the JSE Combined Index rally 423.59 points to close at 394,523.44.
The All Jamaican Composite Index slipped 101.02 points to 436,271.57, the JSE Main Index fell 324.63 points to 381,528.21 and the SE USD market index dipped 3.59 points to close at 210.93.
Investors exchanged 30,725,425 shares in all markets, with the value of stocks traded in the Main and Junior Markets ended at $304.2 million and in the JSE USD market, US$13,970.
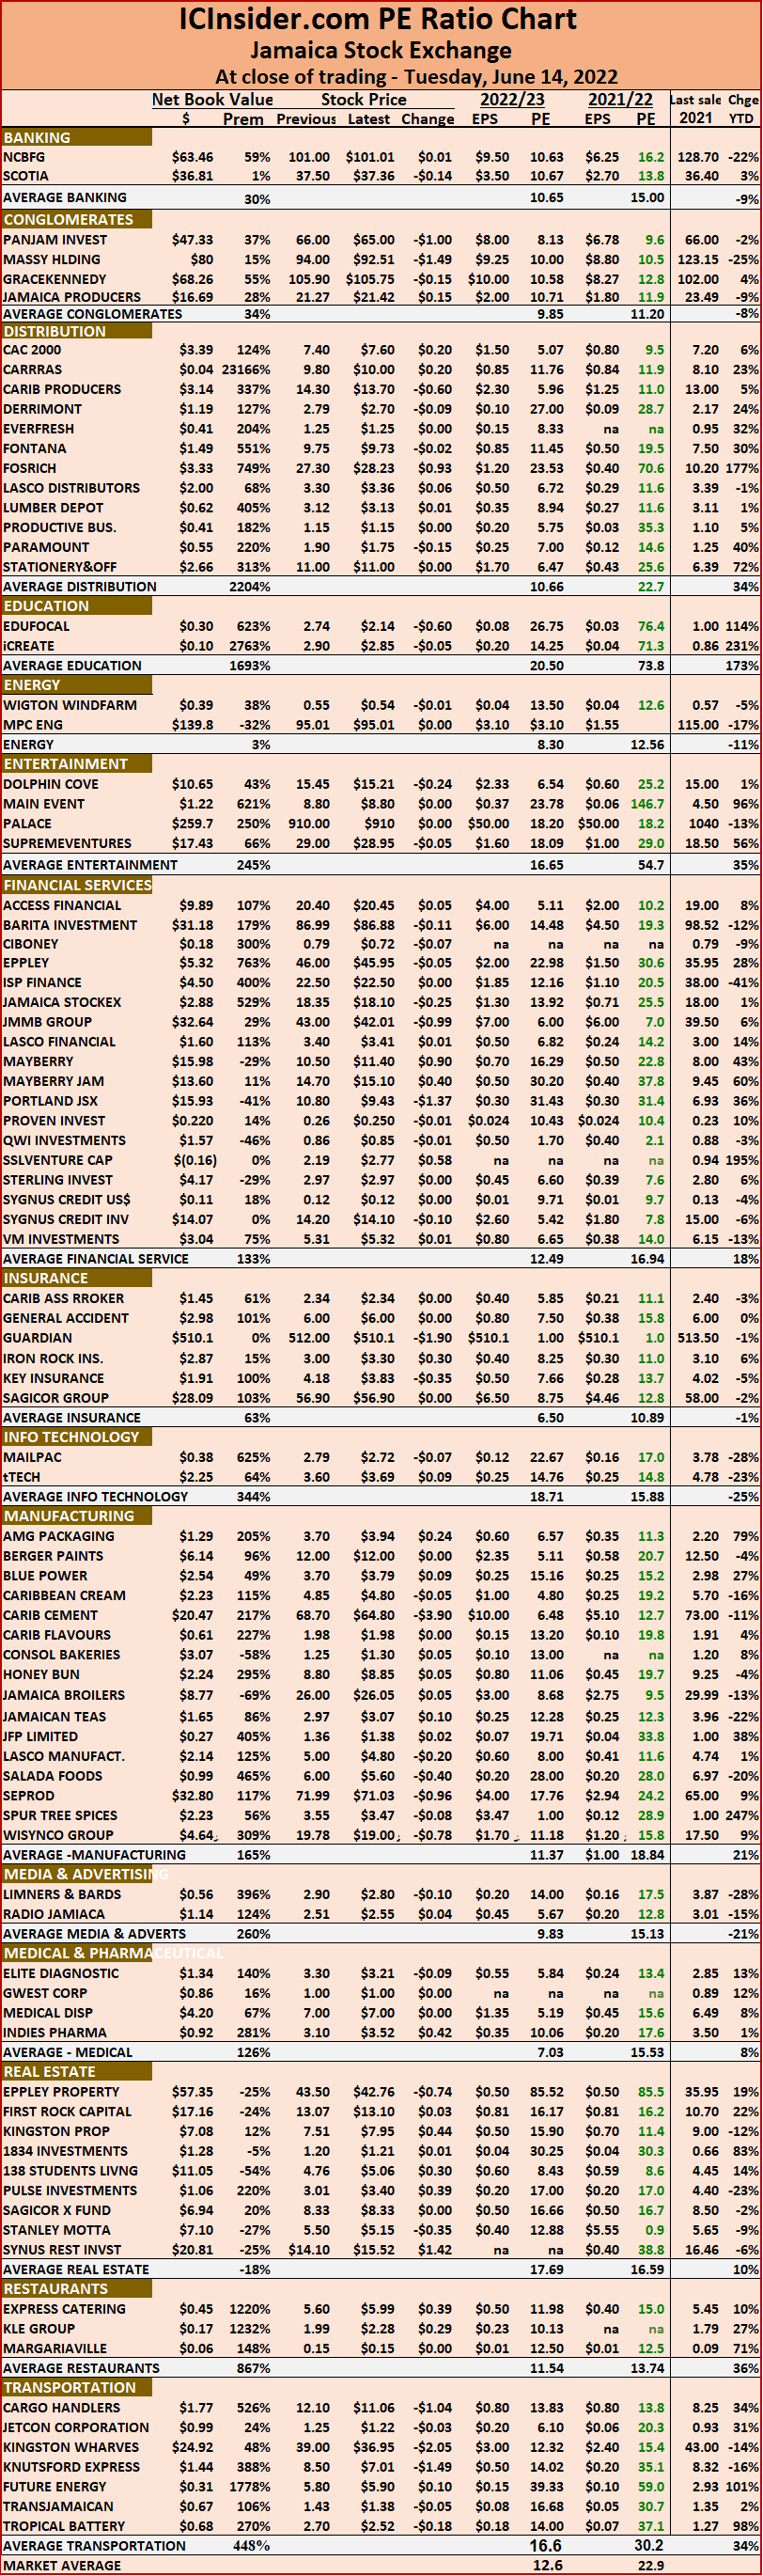
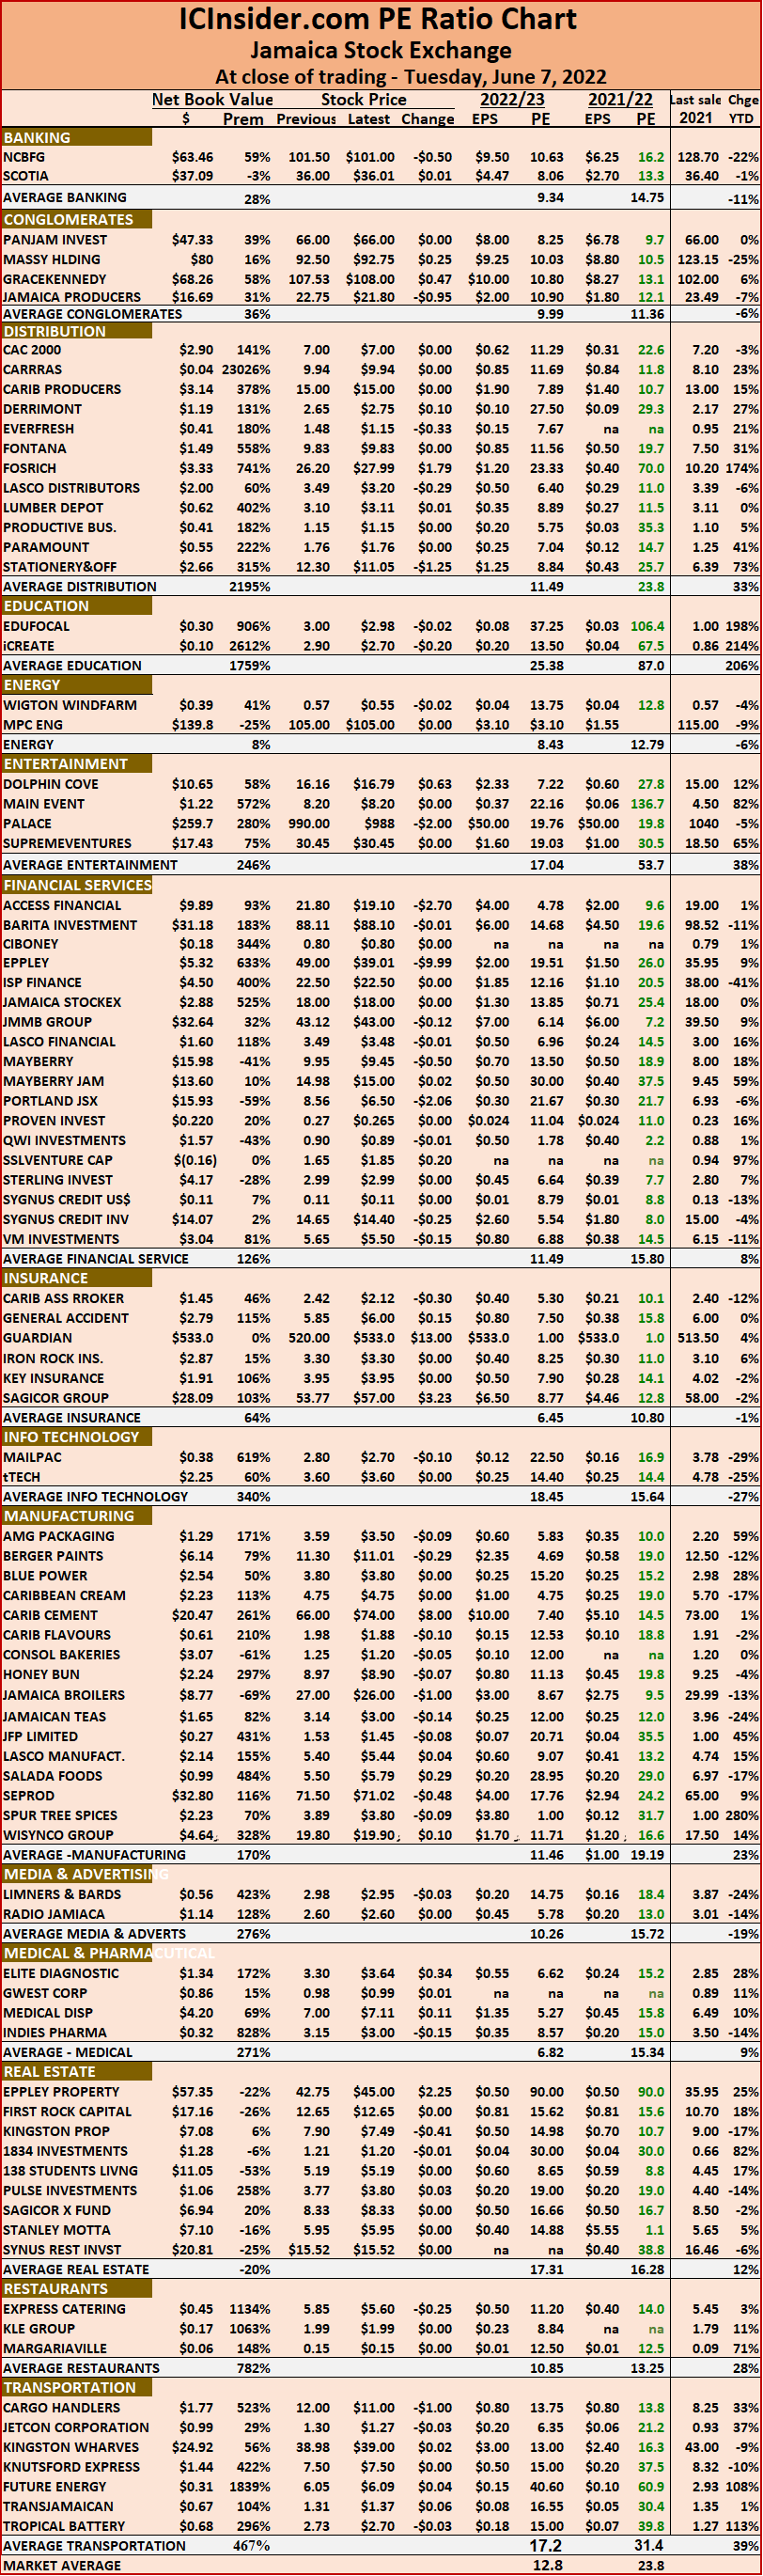
The market’s PE ratio ended at 23.9 based on 2021-22 earnings and 12.9 times those for 2022-23 at the close of trading.
Investors need a series of measures and pertinent information to successfully navigate many investment choices, in the local stock market. The ICInsider.com PE ratio chart and the more detailed daily report charts provide investors with regularly updated information to help with decision-making.
Investors should use the chart to help make rational investment decisions by investing in stocks that are close to the average for the sector and not going too far from it unless there are compelling reasons to do so. This approach helps to take emotions out of the investment decision and put in on fundamentals while at the same time not being too far from the majority of investors. Investors who buy when the price of a stock is close to the average will find that they are not inclined to overpay for a stock.
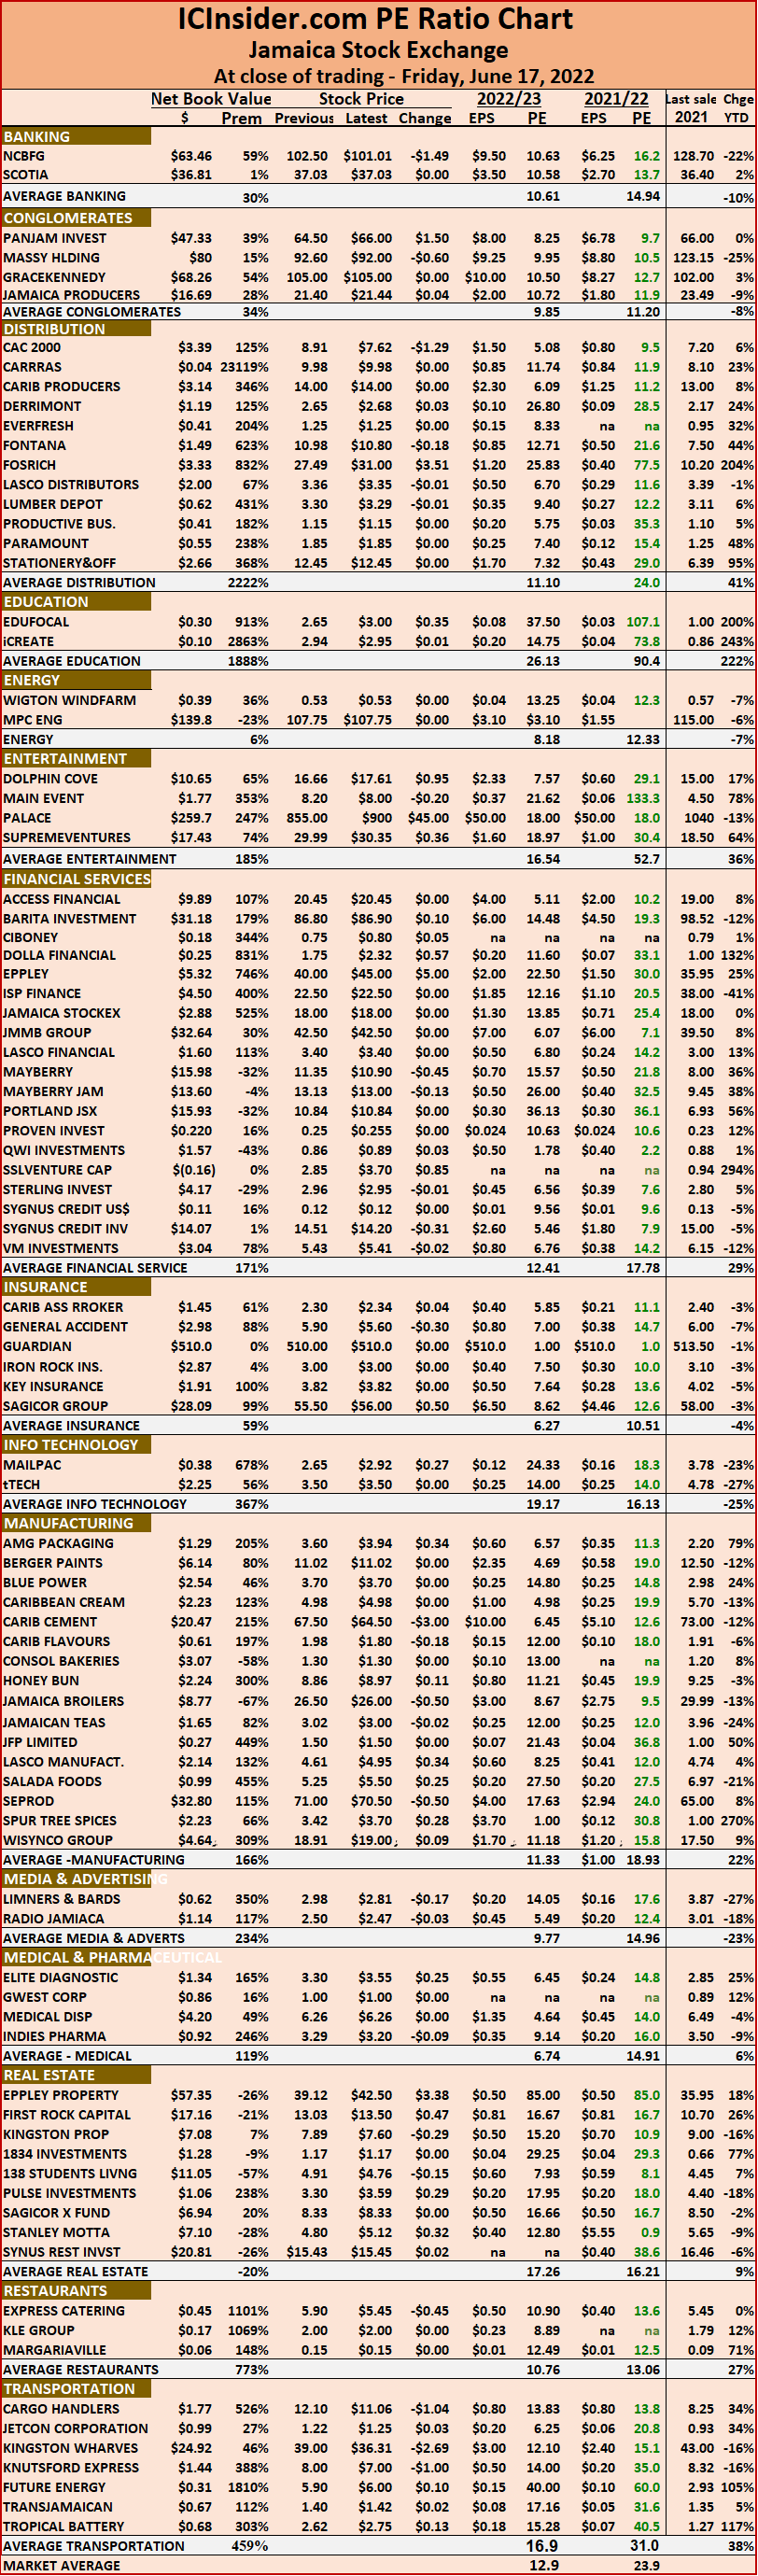 The ICInsider.com PE Ratio chart covers all ordinary shares listed on the Jamaica Stock Exchange. It shows companies grouped on an industry basis, allowing easy comparisons between the same sector companies and the overall market.
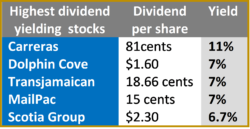
The net asset value of each company is reported as a guide to assess the value of stocks based on this measure quickly. The chart also shows daily changes in stock prices and the percentage year to date price movement based on the last traded prices. Dividends payable and yields for each company are shown in the Main and Junior Markets’ daily report charts that show the closing volume for the bids and offers.
The EPS & PE ratios are based on 2021 and 2022 actual or projected earnings, excluding major one off items. The PE Ratio is the most popular measure used to determine the value of stocks.
Dolla Financial gains 132% in 3 days
Dolla Financial up 75% in two days
On the second day of trading, Dolla Financial opened trading at the maximum 30 percent increase permitted to $1.72, with trading halted for an hour with the maximum for the day recomputed to $1.75, based on the change in the reference price to $1.52 from which it could trade up to 15 percent to $1.75 for the day, where it closed.
Trading ended with 365,000 shares trading, with bids to buy 100 million shares at $1.75 seconds before the close, with 200,000 on the offer at $1.92 and 1 million at $1.94. In short, there is not a great deal of selling below $3, but that may change on Friday.
At the close of trading, the Junior Market rose moderately, while the Main Market, and USD market all slipped moderately, with the JSE Combined Index falling 990.81 points to close at 394,099.84.
The All Jamaican Composite Index lost 1,238.51 points to 436,372.59, the JSE Main Index fell 1,477.94 points to 381,852.85, the Junior Market index rose 43.54 points to 4,121.50 and the SE USD market index dipped 3.42 points to close at 214.52.
Investors exchanged 18,381,484 shares in all markets, with the value of stocks traded in the Main and Junior Markets jumped to $513.2 million and in the JSE USD market, US$12,579.
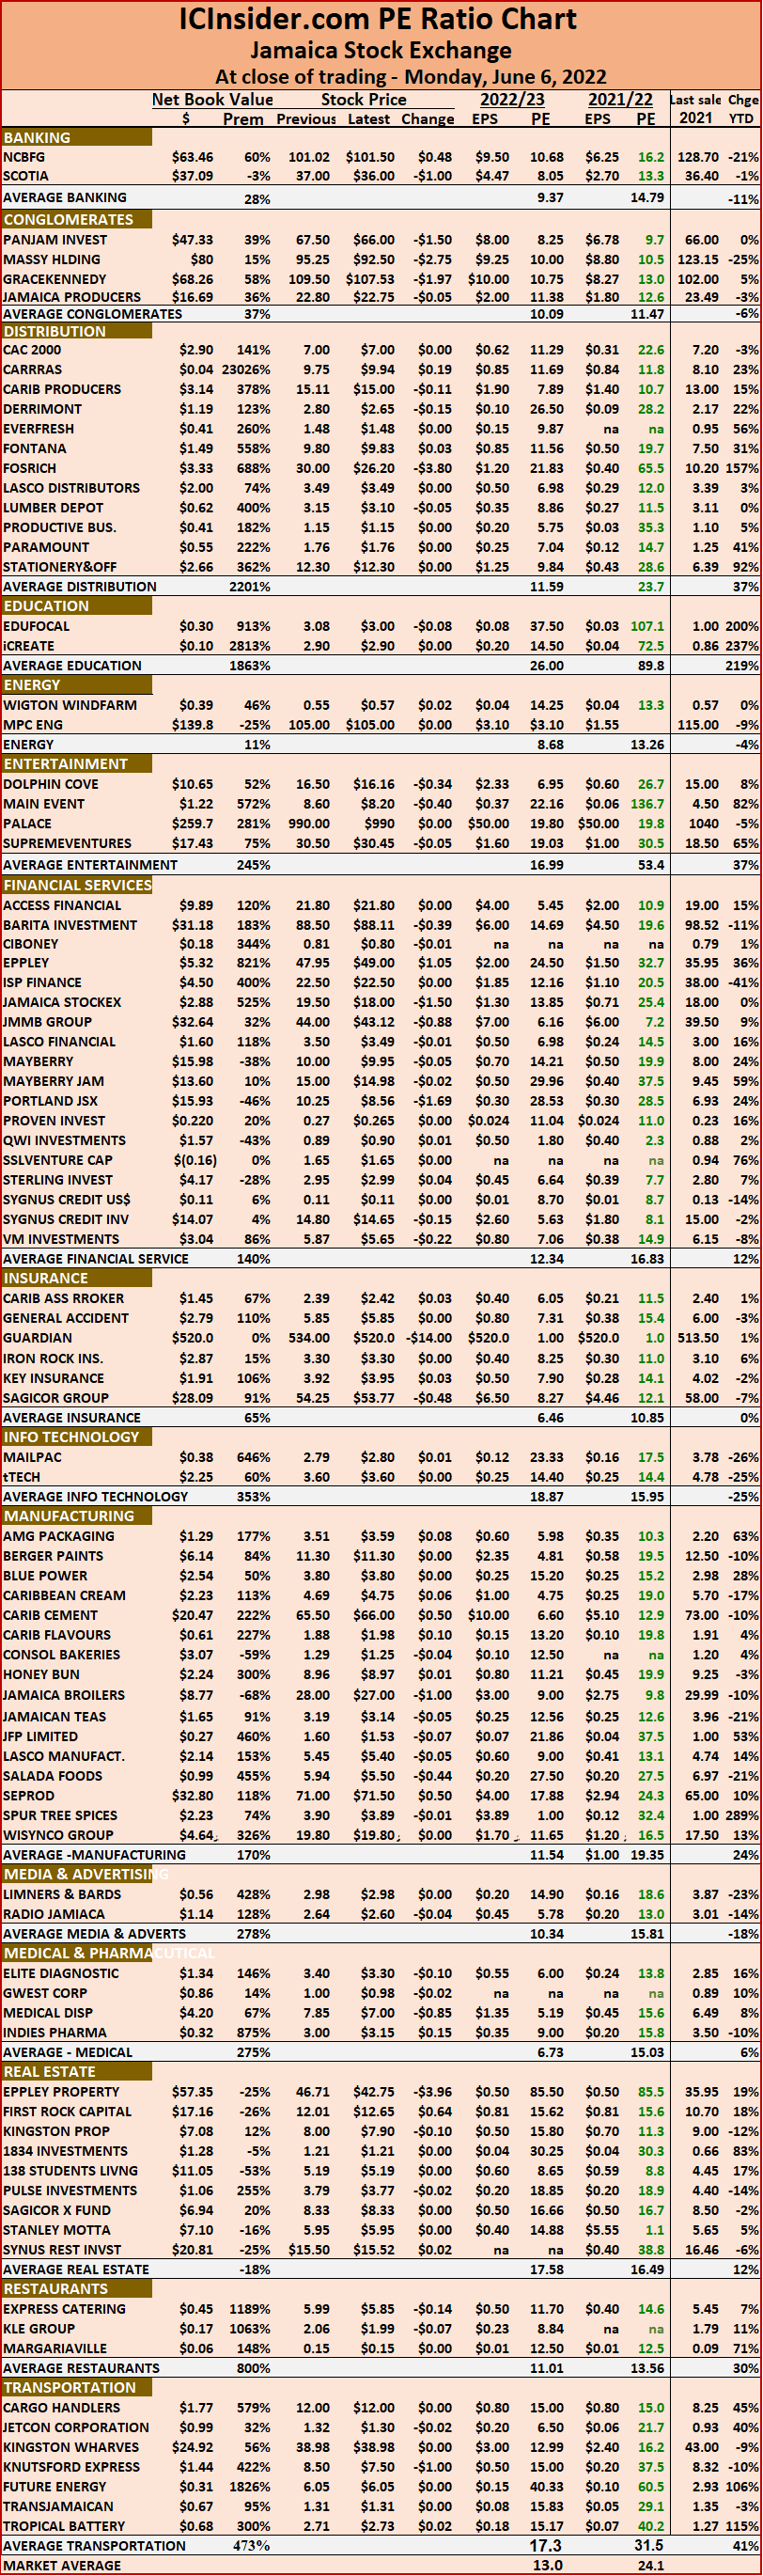
The market’s PE ratio ended at 23.5 based on 2021-22 earnings and 12.7 times those for 2022-23 at the close of trading.
Investors need a series of measures and pertinent information to successfully navigate many investment choices, in the local stock market. The ICInsider.com PE ratio chart and the more detailed daily report charts provide investors with regularly updated information to help with decision-making.
Investors should use the chart to help make rational investment decisions by investing in stocks that are close to the average for the sector and not going too far from it unless there are compelling reasons to do so. This approach helps to take emotions out of the investment decision and put in on fundamentals while at the same time not being too far from the majority of investors. Investors who buy when the price of a stock is close to the average will find that they are not inclined to overpay for a stock.
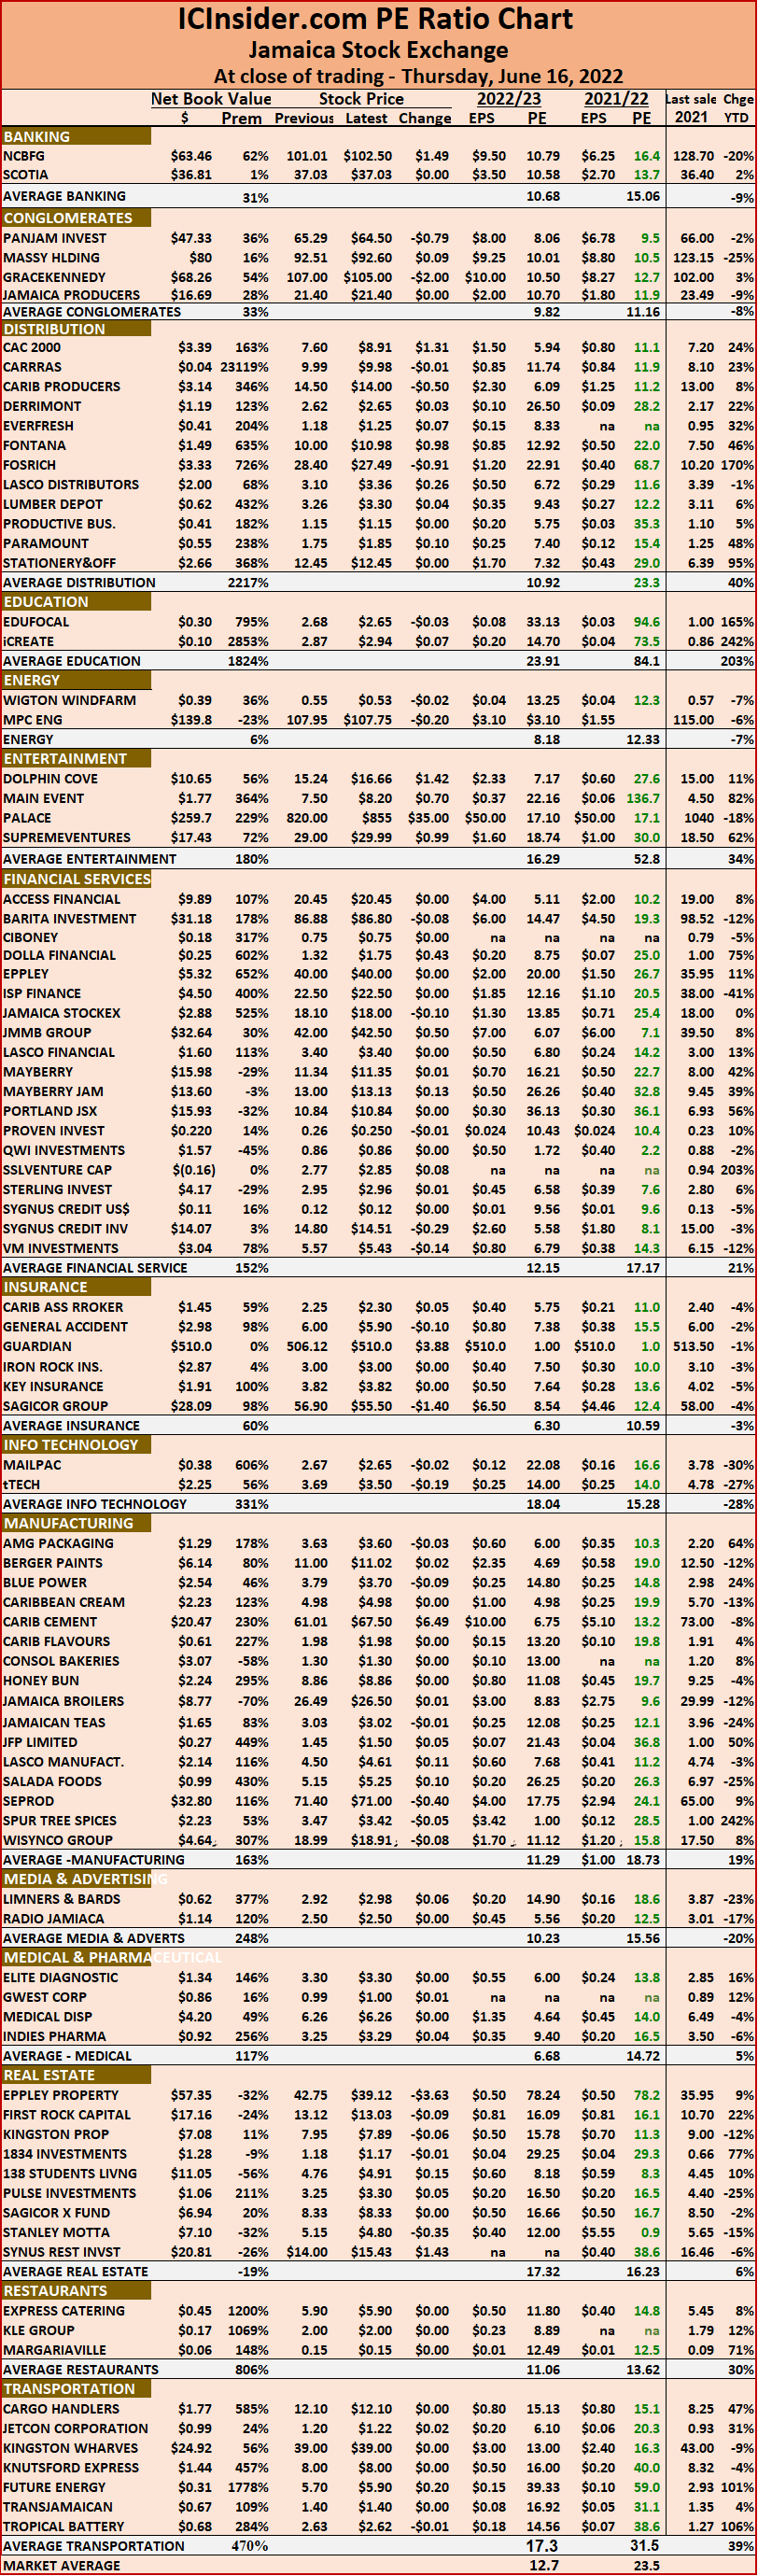 The ICInsider.com PE Ratio chart covers all ordinary shares listed on the Jamaica Stock Exchange. It shows companies grouped on an industry basis, allowing easy comparisons between the same sector companies and the overall market.
The net asset value of each company is reported as a guide to assess the value of stocks based on this measure quickly. The chart also shows daily changes in stock prices and the percentage year to date price movement based on the last traded prices. Dividends payable and yields for each company are shown in the Main and Junior Markets’ daily report charts that show the closing volume for the bids and offers.
The EPS & PE ratios are based on 2021 and 2022 actual or projected earnings, excluding major one off items. The PE Ratio is the most popular measure used to determine the value of stocks.
Dolla Financial gains 32% on debut
Dolla Financial was listed on the Jamaica Stock Exchange Junior Market on Wednesday, with the price hitting the maximum permitted for the day at $1.32, up 32 percent from the IPO price of $1 with trading in only 63,940 shares after the online trading platform frooze up for some time preventing investors from interacting with the market for almost an hour. At the close of trading, there were 45 million units on the bid at $1.32, and just over 30 million at $1.30, with less than 300,000 on the offer below $2.
 At the close of trading, the Main and USD Indices, Junior Market and the USD market all slipped moderately, with the JSE Combined Index falling 394.65 points to 395,090.66.
The All Jamaican Composite Index lost 332.58 points to 437,611.11, the JSE Main Index fell 219.82 points to 383,330.79, and the Junior Market index slipped 21.05 points to 4,077.96 and the SE USD market index dipped 1.02 points to close at 217.95.
Investors exchanged 16,183,710 shares in all markets, with the value of stocks traded in the Main and Junior Markets amounting to a mere $79.8 million and in the JSE USD market, US$$34,212.
The market’s PE ratio ended at 23.6 based on 2021-22 earnings and 13.2 times those for 2022-23 at the close of trading.
Investors need a series of measures and pertinent information to successfully navigate the many investment choices in the local stock market. The ICInsider.com PE ratio chart and the more detailed daily report charts provide investors with regularly updated information to help with decision-making.
Investors should use the chart to help make rational investment decisions by investing in stocks that are close to the average for the sector and not going too far from it unless there are compelling reasons to do so. This approach helps to take emotions out of the investment decision and put in on fundamentals while at the same time not being too far from the majority of investors. Investors who buy when the price of a stock is close to the average will find that they are not inclined to overpay for a stock.
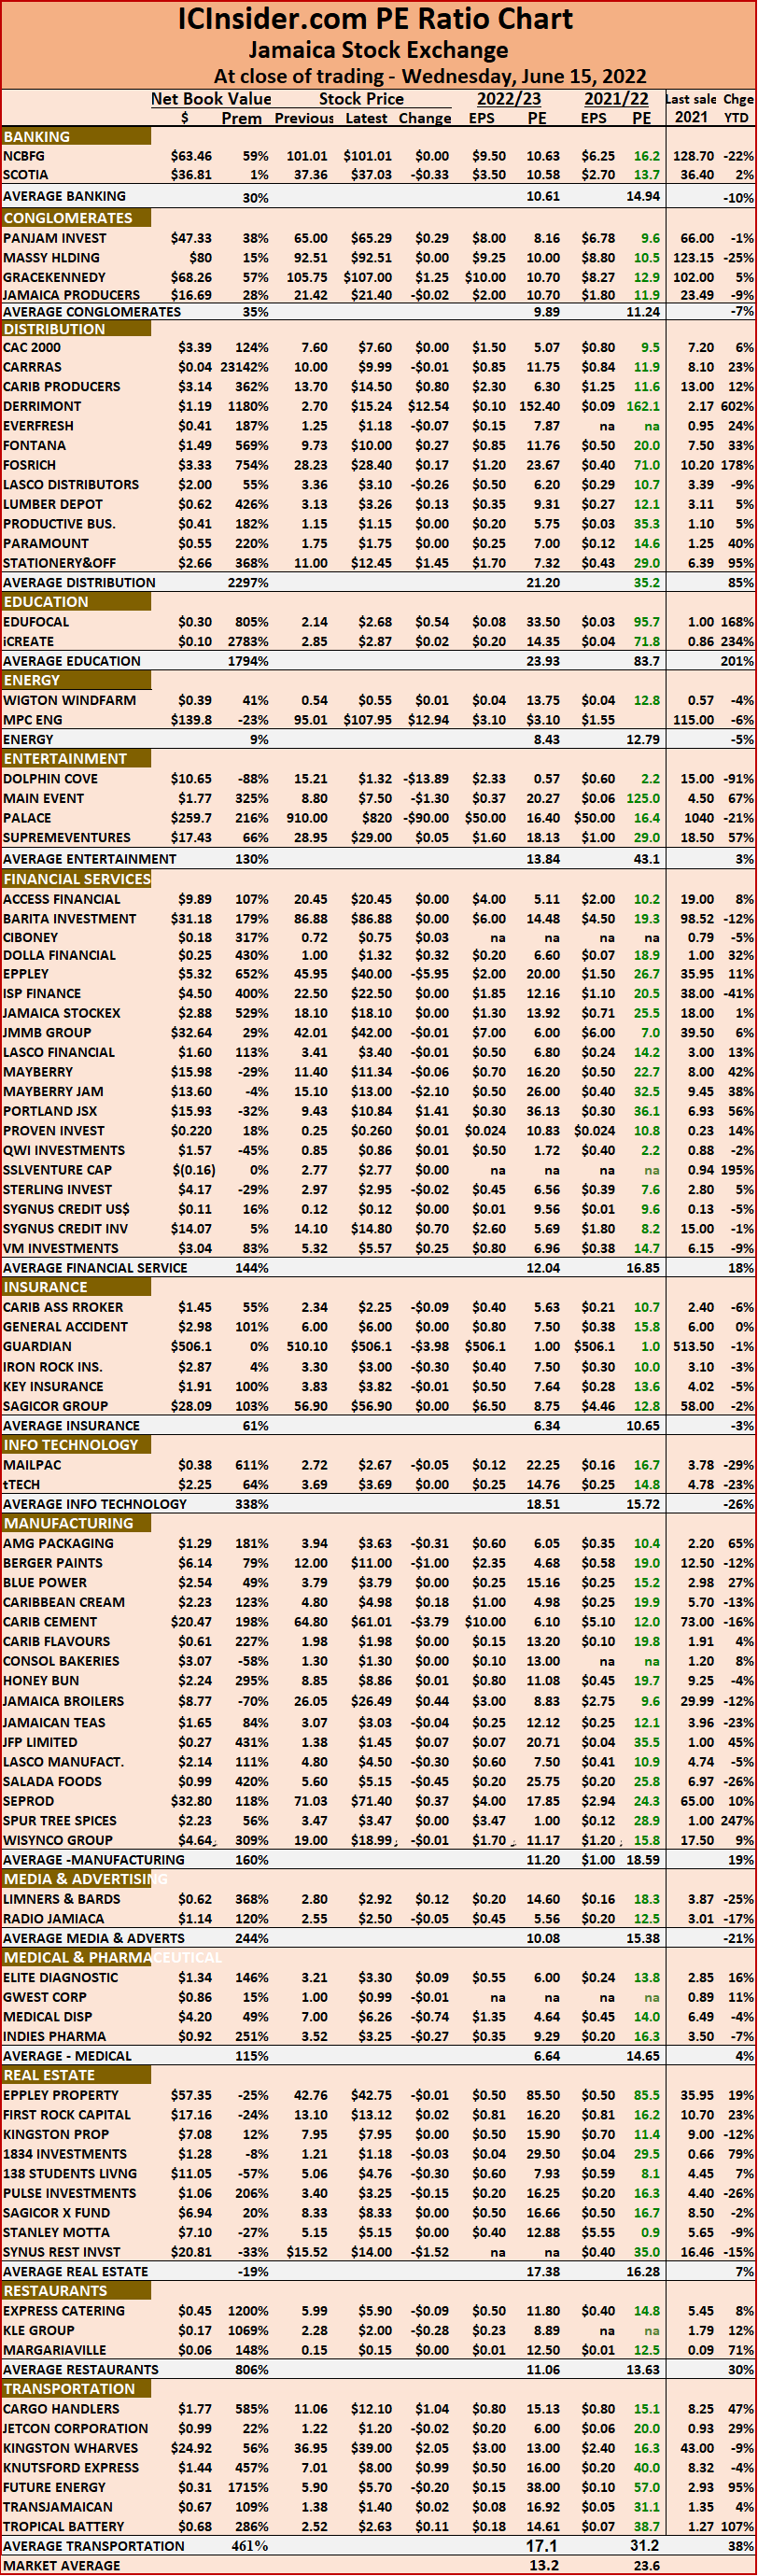 The ICInsider.com PE Ratio chart covers all ordinary shares on the Jamaica Stock Exchange. It shows companies grouped on an industry basis, allowing easy comparisons between the same sector companies and the overall market.
The net asset value of each company is reported as a guide to quickly assess the value of stocks based on this measure. The chart also shows daily changes in stock prices and the percentage year to date price movement based on the last traded prices. Dividends payable and yields for each company are shown in the Main and Junior Markets’ daily report charts that show the closing volume for the bids and offers.
The EPS & PE ratios are based on 2021 and 2022 actual or projected earnings, excluding major one off items. The PE Ratio is the most popular measure used to determine the value of stocks.
JSE markets in consolidation mode
Trading on the Jamaica Stock Exchange on Tuesday ended in consolidation mode with moderate movements in market indices as investors sit on the sideline until closer to the major release of results towards the end of July when the first set should start appearing. At the close of trading, the Main and USD Indices fell and Junior Market rose moderately, with the JSE Combined Index falling 1,393.72 points to close at 395,485.31.
 The All Jamaican Composite Index shed 2,221.13 points to 437,943.69, the JSE Main Index fell 1,733.32 points to 383,550.61, the Junior Market index rose 25.80 points to 4,099.01 and the SE USD market index slipped 1.51 points to close at 218.97.
Investors exchanged 18,817,878 shares in all markets, with the value of stocks traded in the Main and Junior Markets amounting to $139.50 million and in the JSE USD market, US$15,551.
The market’s PE ratio ended at 22.9 based on 2021-22 earnings and 12.6 times those for 2022-23 at the close of trading.
Investors need a series of measures and pertinent information to successfully navigate the many investment choices in the local stock market. The ICInsider.com PE ratio chart and the more detailed daily report charts provide investors with regularly updated information to help with decision-making.
Investors should use the chart to help make rational investment decisions by investing in stocks that are close to the average for the sector and not going too far from it unless there are compelling reasons to do so. This approach helps to take emotions out of the investment decision and put in on fundamentals while at the same time not being too far from the majority of investors. Investors who buy when the price of a stock is close to the average will find that they are not inclined to overpay for a stock.
 The ICInsider.com PE Ratio chart covers all ordinary shares listed on the Jamaica Stock Exchange. It shows companies grouped on an industry basis, allowing easy comparisons between the same sector companies and the overall market.
The net asset value of each company is reported as a guide to assess the value of stocks based on this measure quickly. The chart also shows daily changes in stock prices and the percentage year to date price movement based on the last traded prices. Dividends payable and yields for each company are shown in the Main and Junior Markets’ daily report charts that show the closing volume for the bids and offers.
The EPS & PE ratios are based on 2021 and 2022 actual or projected earnings, excluding major one off items. The PE Ratio is the most popular measure used to determine the value of stocks.
Modest changes to JSE market indices – Monday
Trading on the Jamaica Stock Exchange on Monday ended with more declines in Main and Junior markets, with a marginal increase in the JSE USD market, with the JSE Combined Index slipping 1,350.76 points rally to close at 396,879.03.
 The All Jamaican Composite Index shed just 44.74 points to 440,164.82, the JSE Main Index fell 1,246.97 points to close at 385,283.93, the Junior Market index slipped 20.65 points to 4,073.21 and the SE USD market index added a mere 0.09 points to close at 220.48.
Investors exchanged 18,885,506 shares in all markets, with the value of stocks traded in the Main and Junior Markets amounting to $499.50 million and in the JSE USD market, US$4,111.
The market’s PE ratio ended at 23.9 based on 2021-22 earnings and 12.9 times those for 2022-23 at the close of trading.
Investors need a series of measures and pertinent information to successfully navigate the many investment choices in the local stock market. The ICInsider.com PE ratio chart and the more detailed daily report charts provide investors with regularly updated information to help with decision-making.
Investors should use the chart to help make rational investment decisions by investing in stocks that are close to the average for the sector and not going too far from it unless there are compelling reasons to do so. This approach helps to take emotions out of the investment decision and put in on fundamentals while at the same time not being too far from the majority of investors. Investors who buy when the price of a stock is close to the average will find that they are not inclined to overpay for a stock.
 The ICInsider.com PE Ratio chart covers all ordinary shares listed on the Jamaica Stock Exchange. It shows companies grouped on an industry basis, allowing easy comparisons between the same sector companies and the overall market.
The net asset value of each company is reported as a guide to assess the value of stocks based on this measure quickly. The chart also shows daily changes in stock prices and the percentage year to date price movement based on the last traded prices. Dividends payable and yields for each company are shown in the Main and Junior Markets’ daily report charts that show the closing volume for the bids and offers.
The EPS & PE ratios are based on 2021 and 2022 actual or projected earnings, excluding major one off items. The PE Ratio is the most popular measure used to determine the value of stocks.
Small changes in JSE markets – Friday
There were just small changes to the Jamaica Stock Exchange in closing out Friday and the week with the JSE Combined Index reflecting the mode of the market with an 82.50 points rally to close at 398,229.79.
 The All Jamaican Composite Index shed 510.21 points to 440,209.56, the JSE Main Index rose 102.53 points to 386,530.90, the Junior Market index slipped 1.51 points to 4,093.86 and the JSE USD market index eased a mere 0.06 points to close at 220.39.
A total of 41,181,744 shares were traded in all markets, with the value of stocks traded in the Main and Junior Markets amounting to $189.25 million and in the JSE USD market, US$57,581.
The market’s PE ratio ended at 24 based on 2021-22 earnings and 12.9 times those for 2022-23 at the close of trading.
Investors need a series of measures and pertinent information to successfully navigate the many investment choices in the local stock market. The ICInsider.com PE ratio chart and the more detailed daily report charts provide investors with regularly updated information to help with decision-making.
Investors should use the chart to help make rational investment decisions by investing in stocks that are close to the average for the sector and not going too far from it unless there are compelling reasons to do so. This approach helps to take emotions out of the investment decision and put in on fundamentals while at the same time not being too far from the majority of investors. Investors who buy when the price of a stock is close to the average will find that they are not inclined to overpay for a stock.
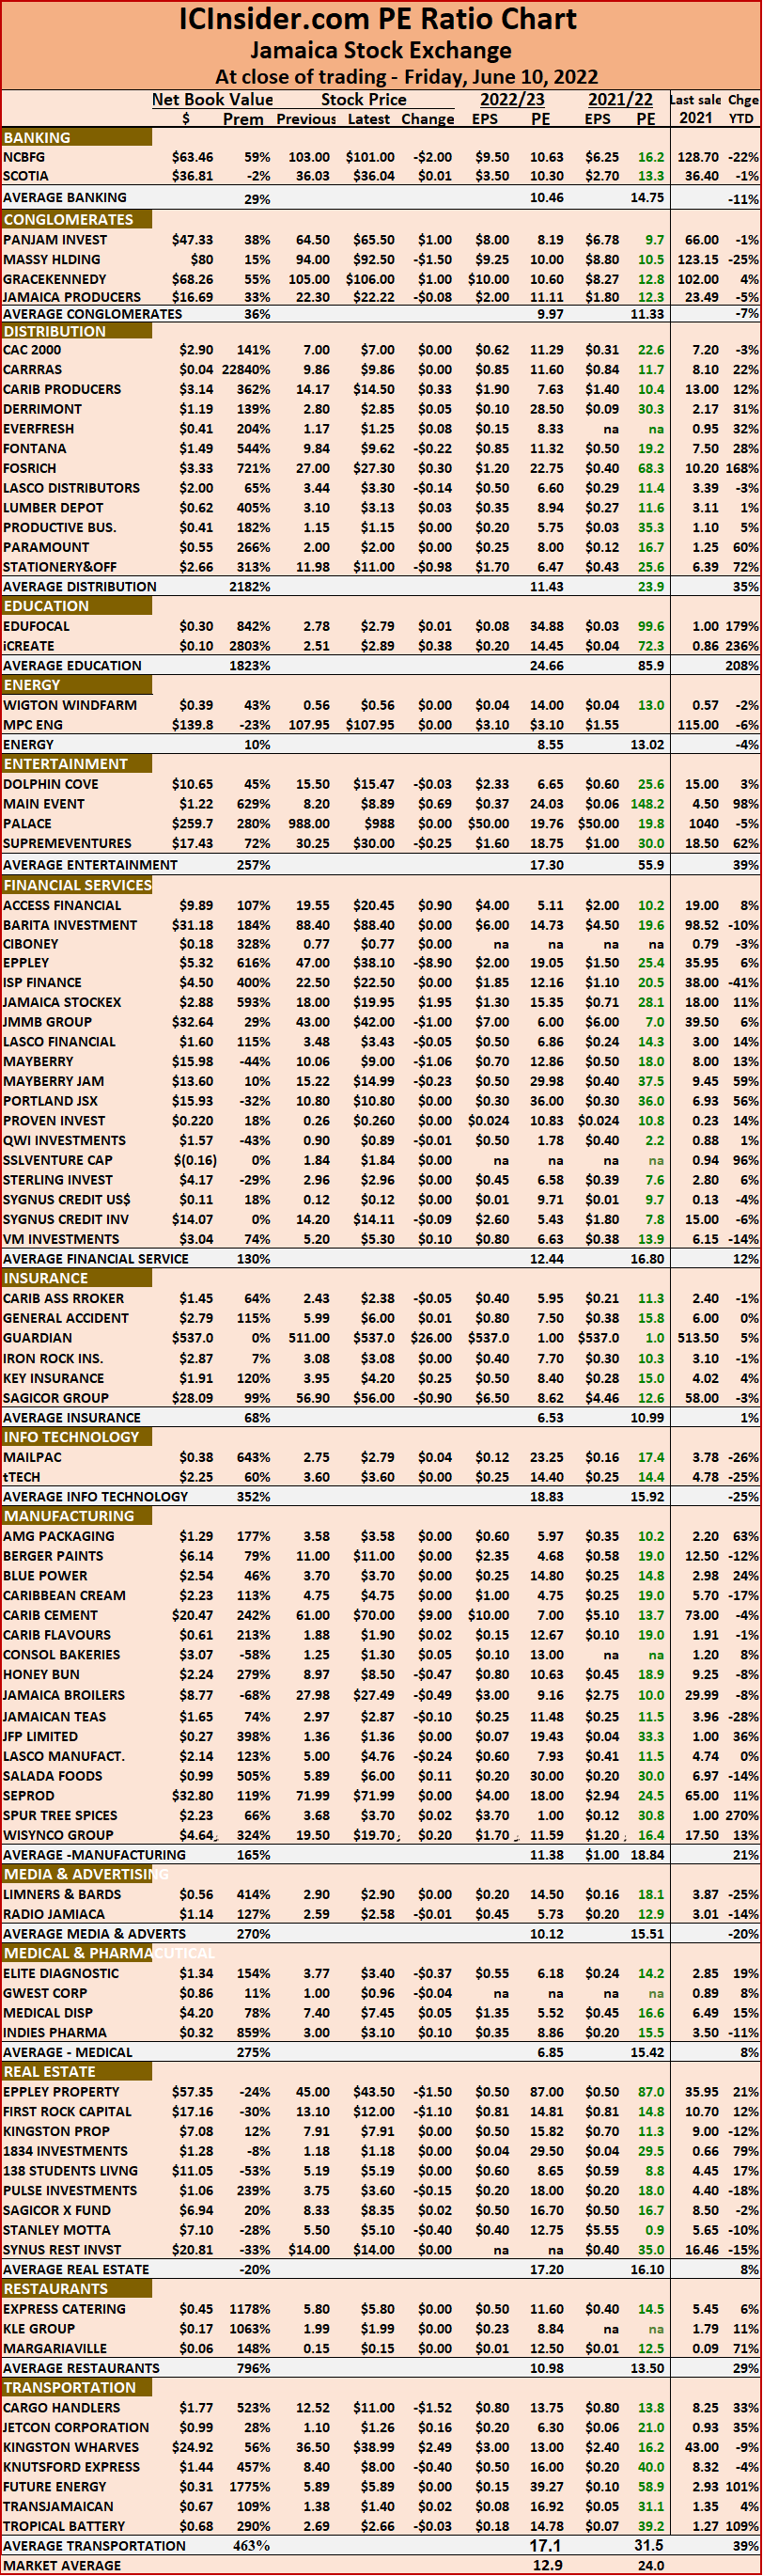 The ICInsider.com PE Ratio chart covers all ordinary shares listed on the Jamaica Stock Exchange. It shows companies grouped on an industry basis, allowing easy comparisons between the same sector companies and the overall market.
The net asset value of each company is reported as a guide to assess the value of stocks based on this measure quickly. The chart also shows daily changes in stock prices and the percentage year to date price movement based on the last traded prices. Dividends payable and yields for each company are shown in the Main and Junior Markets’ daily report charts that show the closing volume for the bids and offers.
The EPS & PE ratios are based on 2021 and 2022 actual or projected earnings, excluding major one off items. The PE Ratio is the most popular measure used to determine the value of stocks.
Marginal changes in JSE markets
Trading on the Jamaica Stock Exchange on Thursday ended with moderate changes to the market indices with the JSE Combined Index falling 1,703.57 points to 398.147.28.
 The All Jamaican Composite Index shed 2,384.19 points to 440,719.77, the JSE Main Index dipped 1,721.84 points to close at 386,428.37, the Junior Market index fell 10.30 points to 4,095.38 and the JSE USD market index slipped 1.51 points to close at 220.45.
Investors exchanged 26,698,445 shares in all markets, with the value of stocks traded in the Main and Junior Markets amounting to $224 million and in the JSE USD market, US$3,819.
The market’s PE ratio ended at 23.5 based on 2021-22 earnings and 12.9 times those for 2022-23 at the close of trading.
Investors need a series of measures and pertinent information to successfully navigate the many investment choices in the local stock market. The ICInsider.com PE ratio chart and the more detailed daily report charts provide investors with regularly updated information to help with decision-making.
Investors should use the chart to help make rational investment decisions by investing in stocks that are close to the average for the sector and not going too far from it unless there are compelling reasons to do so. This approach helps to take emotions out of the investment decision and put in on fundamentals while at the same time not being too far from the majority of investors. Investors who buy when the price of a stock is close to the average will find that they are not inclined to overpay for a stock.
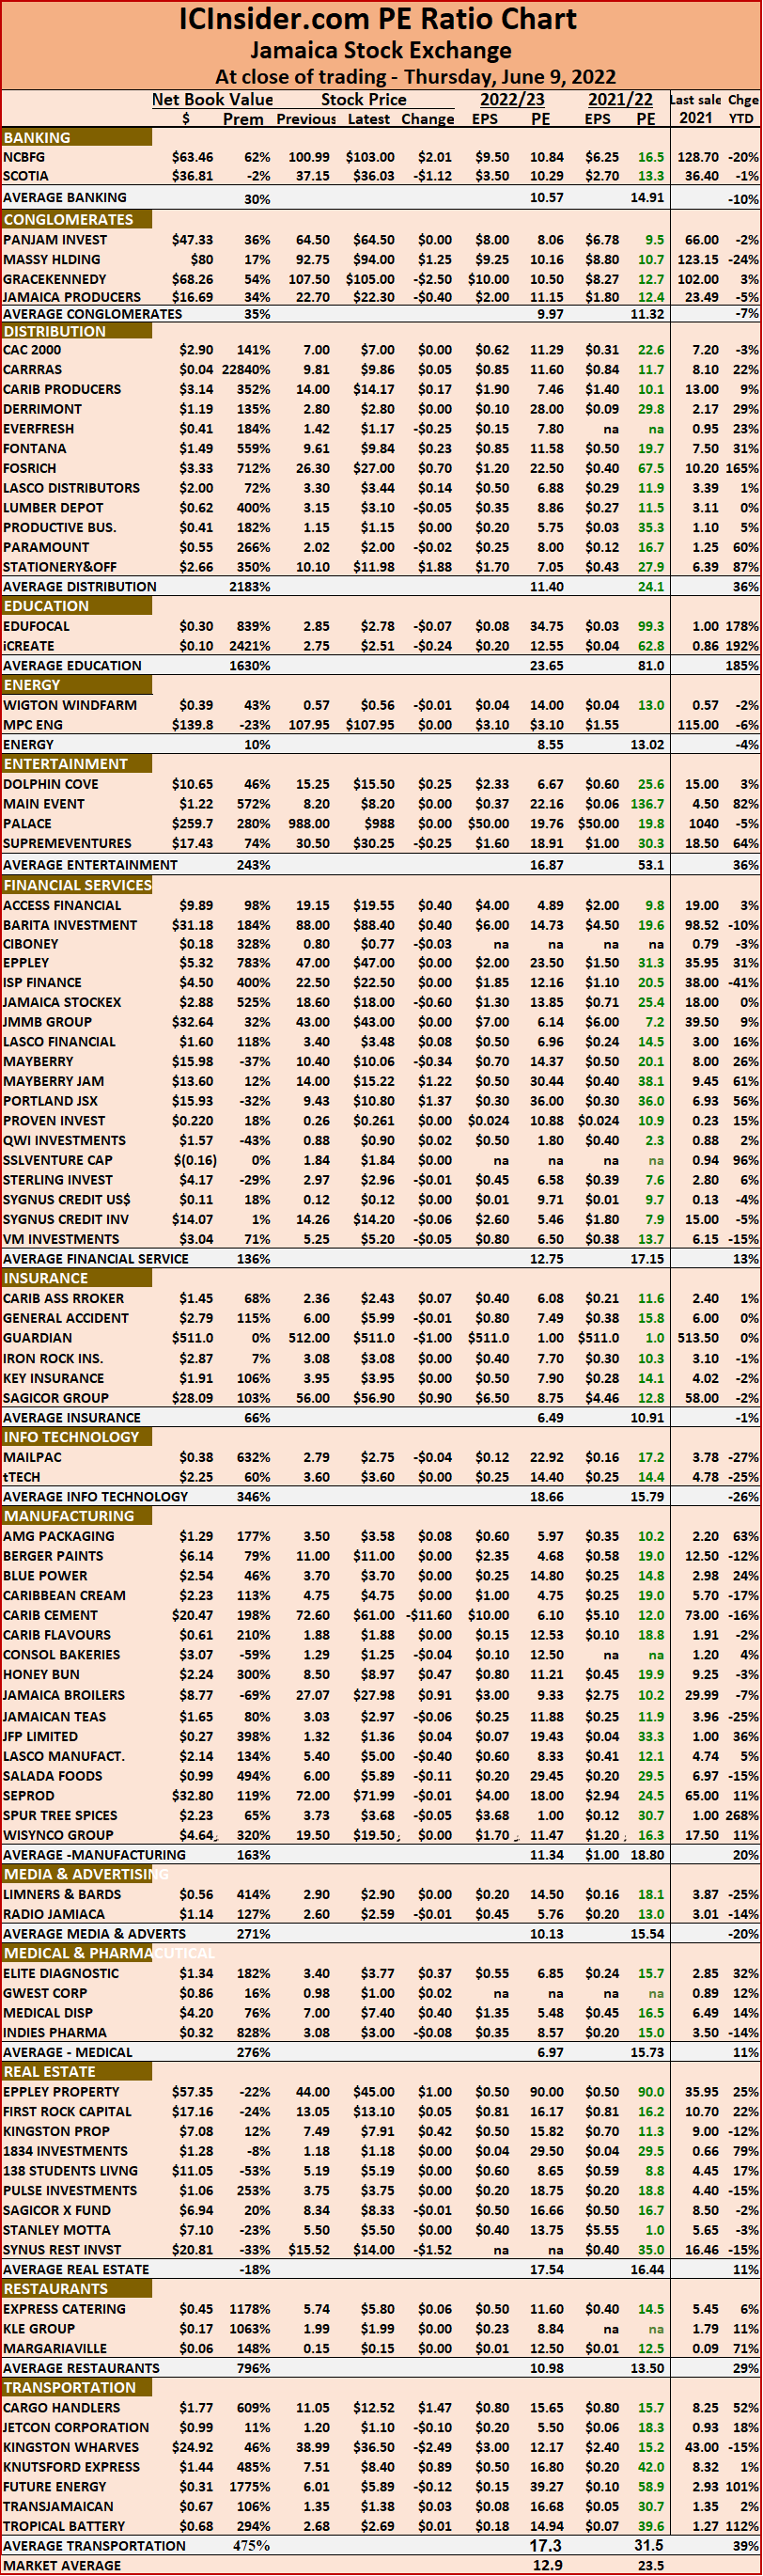 The ICInsider.com PE Ratio chart covers all ordinary shares listed on the Jamaica Stock Exchange. It shows companies grouped on an industry basis, allowing easy comparisons between the same sector companies and the overall market.
The net asset value of each company is reported as a guide to assess the value of stocks based on this measure quickly. The chart also shows daily changes in stock prices and the percentage year to date price movement based on the last traded prices. Dividends payable and yields for each company are shown in the Main and Junior Markets’ daily report charts that show the closing volume for the bids and offers.
The EPS & PE ratios are based on 2021 and 2022 actual or projected earnings, excluding major one off items. The PE Ratio is the most popular measure used to determine the value of stocks.
Juniors down Majors up
Following the fall of 40.93 points on Monday and 84.36 points on Tuesday, the Junior Market continued on a losing streak on Wednesday with a 32.16 point drop in the market index to 4,015.69, while the Main Market of the Jamaica Stock Exchange rose on Tuesday, and led to a jump of 3,484.40 points in the JSE Combined Index to 399,850.85.
 The All Jamaican Composite Index climbed 4,841.97 points to 443,103.96, the JSE Main Index dropped 4,026.85 points to close at 388,150.21, but the JSE USD market index rose 5.84 points to close at 221.96.
Investors exchanged 21,377,107 shares in all markets, with the value of stocks traded in the Main and Junior Markets surging to $520.9 million and the JSE USD market, US$8,144.
The market’s PE ratio ended at 23.7 based on 2021-22 earnings and 12.8 times those for 2022-23 at the close of trading.
Investors need a series of measures and pertinent information to successfully navigate the many investment choices in the local stock market. The ICInsider.com PE ratio chart and the more detailed daily report charts provide investors with regularly updated information to help with decision-making.
Investors should use the chart to help make rational investment decisions by investing in stocks that are close to the average for the sector and not going too far from it unless there are compelling reasons to do so. This approach helps to take emotions out of the investment decision and put in on fundamentals while at the same time not being too far from the majority of investors. Investors who buy when the price of a stock is close to the average will find that they are not inclined to overpay for a stock.
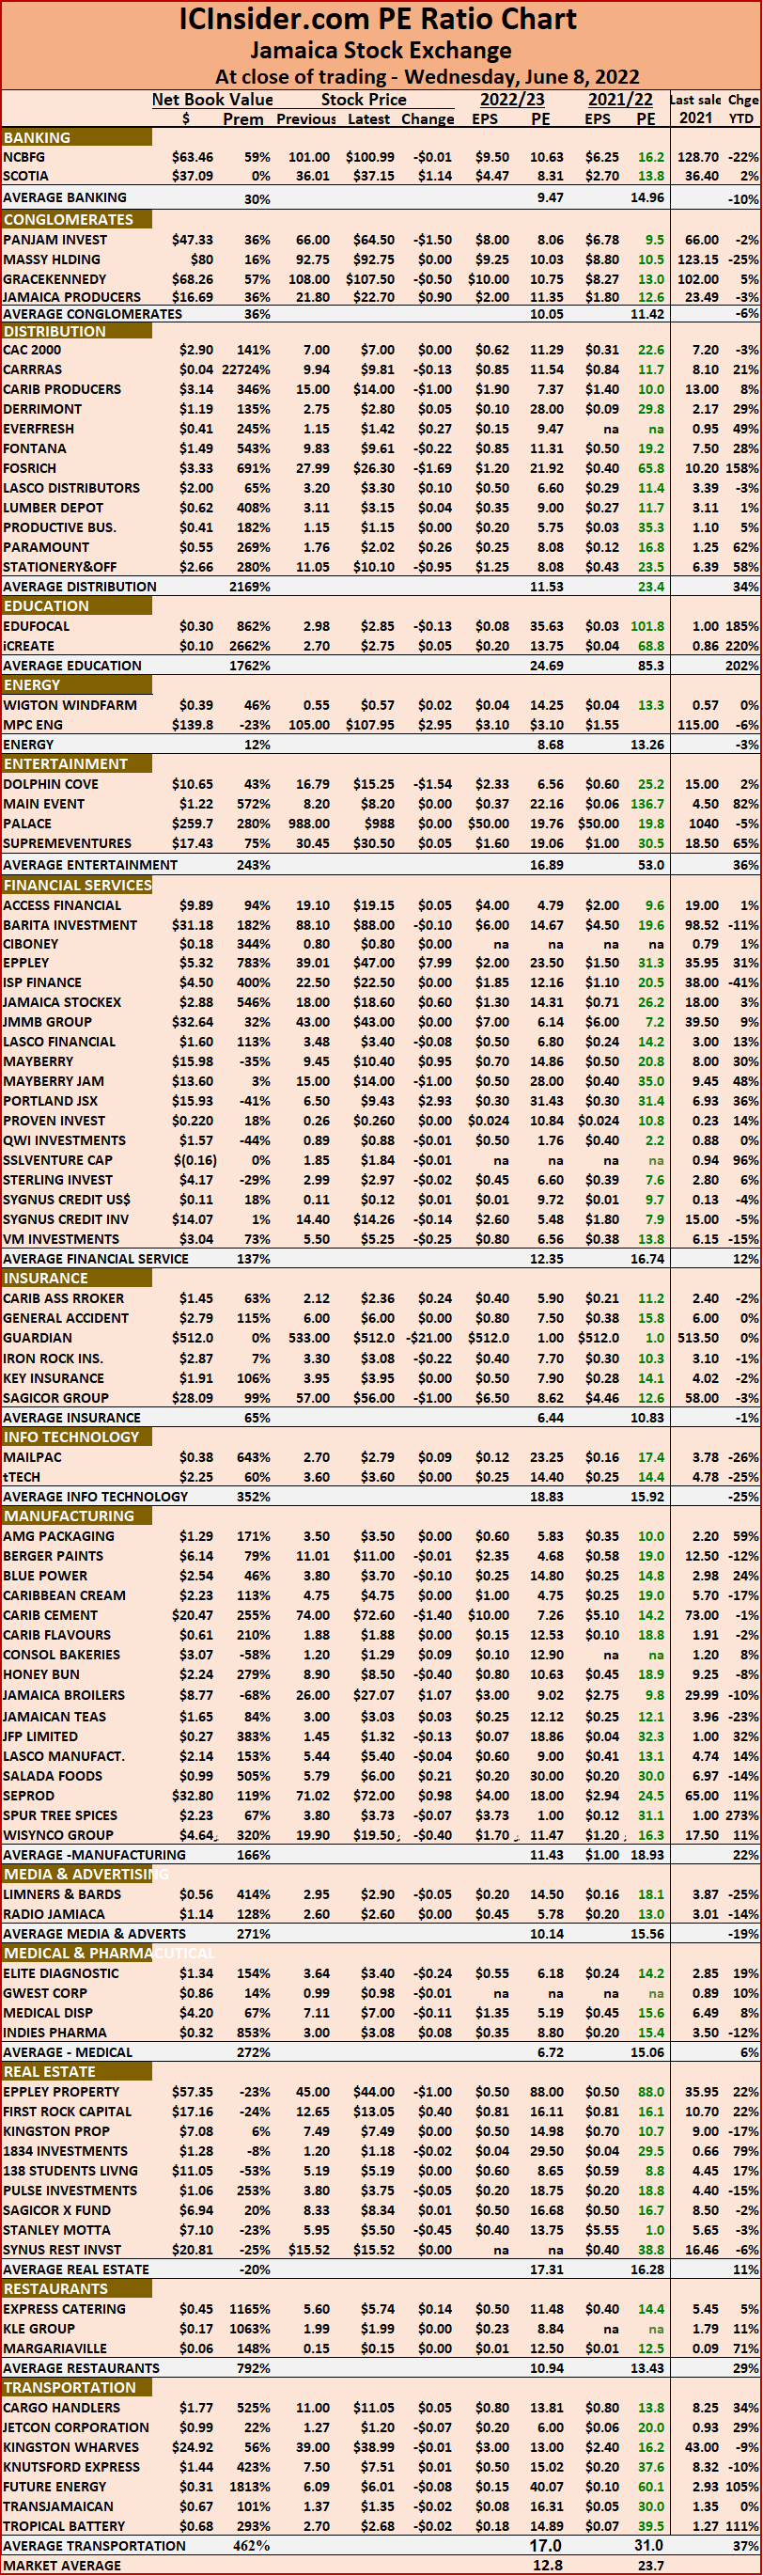 The ICInsider.com PE Ratio chart covers all ordinary shares listed on the Jamaica Stock Exchange. It shows companies grouped on an industry basis, allowing easy comparisons between the same sector companies and the overall market.
The net asset value of each company is reported as a guide to assess the value of stocks based on this measure quickly. The chart also shows daily changes in stock prices and the percentage year to date price movement based on the last traded prices. Dividends payable and yields for each company are shown in the Main and Junior Markets’ daily report charts that show the closing volume for the bids and offers.
The EPS & PE ratios are based on 2021 and 2022 actual or projected earnings, excluding major one off items. The PE Ratio is the most popular measure used to determine the value of stocks.
More decline for Jamaican stocks
Following the 40.93 points drop in the Junior Market index on Monday, investors swiped another 84.36 points off the index on Tuesday as it ended at 4,137.85, as the Stocks fell in the Junior and Main markets of the Jamaica Stock Exchange on Tuesday, leading to a fall of 4,591.28 points in the JSE Combined Index to 396,366.45.
 The All Jamaican Composite Index dived 4,175.98 points to 438,261.99, the JSE Main Index dipped 4,103.95 points to close at 384,123.36 but the JSE USD market index rose 1.18 points to close at 216.12. Investors exchanged 18,835,425 shares in all markets, with the value of stocks traded in the Main and Junior Markets amounting to $119.9 million and in the JSE USD market, US$85,715.
The market’s PE ratio ended at 23.8 based on 2021-22 earnings and 12.8 times those for 2022-23 at the close of trading.
Investors need a series of measures and pertinent information to successfully navigate the many investment choices in the local stock market. The ICInsider.com PE ratio chart and the more detailed daily report charts provide investors with regularly updated information to help with decision-making.
Investors should use the chart to help make rational investment decisions by investing in stocks that are close to the average for the sector and not going too far from it unless there are compelling reasons to do so. This approach helps to take emotions out of the investment decision and put in on fundamentals while at the same time not being too far from the majority of investors. Investors who buy when the price of a stock is close to the average will find that they are not inclined to overpay for a stock.
 The ICInsider.com PE Ratio chart covers all ordinary shares listed on the Jamaica Stock Exchange. It shows companies grouped on an industry basis, allowing easy comparisons between the same sector companies and the overall market.
The net asset value of each company is reported as a guide to assess the value of stocks based on this measure quickly. The chart also shows daily changes in stock prices and the percentage year to date price movement based on the last traded prices. Dividends payable and yields for each company are shown in the Main and Junior Markets’ daily report charts that show the closing volume for the bids and offers.
The EPS & PE ratios are based on 2021 and 2022 actual or projected earnings, excluding major one off items. The PE Ratio is the most popular measure used to determine the value of stocks.
All Jamaica Stock Markets decline
Stocks fell in opening the new week in all three Jamaica Stock Exchange markets on Monday, leading to a fall of 1,609.16 points in the JSE Combined Index in closing at 400,957.74.
 The All Jamaican Composite Index shed 1,166.89 points to 442,437.97, the JSE Main Index dipped 1,330.54 points to close at 388,227.31, the Junior Market dropped 40.93 points to 4,222.21 and the JSE USD market index sipped 0.15 points to 214.94.
Investors exchanged 20,567,883 shares in all markets, with the value of stocks traded in the Main and Junior Markets amounting to just $113.2 million and in the JSE USD market, US$11,513.
The market’s PE ratio ended at 24.1 based on 2021-22 earnings and 13 times those for 2022-23 at the close of trading.
Investors need a series of measures and pertinent information to successfully navigate the many investment choices in the local stock market. The ICInsider.com PE ratio chart and the more detailed daily report charts provide investors with regularly updated information to help with decision-making.
Investors should use the chart to help make rational investment decisions by investing in stocks that are close to the average for the sector and not going too far from it unless there are compelling reasons to do so. This approach helps to take emotions out of the investment decision and put in on fundamentals while at the same time not being too far from the majority of investors. Investors who buy when the price of a stock is close to the average will find that they are not inclined to overpay for a stock.
The ICInsider.com PE Ratio chart includes all ordinary shares listed on the Jamaica Stock Exchange. It shows companies grouped on an industry basis, allowing easy comparisons between the same sector companies and the overall market.
 The net asset value of each company is reported as a guide to assess the value of stocks based on this measure quickly. The chart also shows daily changes in stock prices and the percentage year to date price movement based on the last traded prices. Dividends payable and yields for each company are shown in the Main and Junior Markets’ daily report charts that show the closing volume for the bids and offers.
The EPS & PE ratios are based on 2021 and 2022 actual or projected earnings, excluding major one off items. The PE Ratio is the most popular measure used to determine the value of stocks.