Junior Market stock plunged more than 100 points on Monday while the Main Market fell but the JSEUSD Markets eked out a modest rise at the close of trading on the Jamaica Stock Exchange, leading the JSE Combined Index a measure of the overall market, to dip 2,168.29 points to 388,111.62.
 A total of 13,170,179 shares changing hands in the overall market, with a value of $108.9 million, while the JSE USD market ended with the value of stocks traded at US$3,207.
At the close, the All Jamaican Composite Index dipped 2,082.02 points to 427,776.614, the JSE Main Index declined 1,237.67 points to close at 374,726.99, the Junior Market dived 112.43 points to 4,196.68 and the JSE USD market Index rose 2.38 points to 208.73.
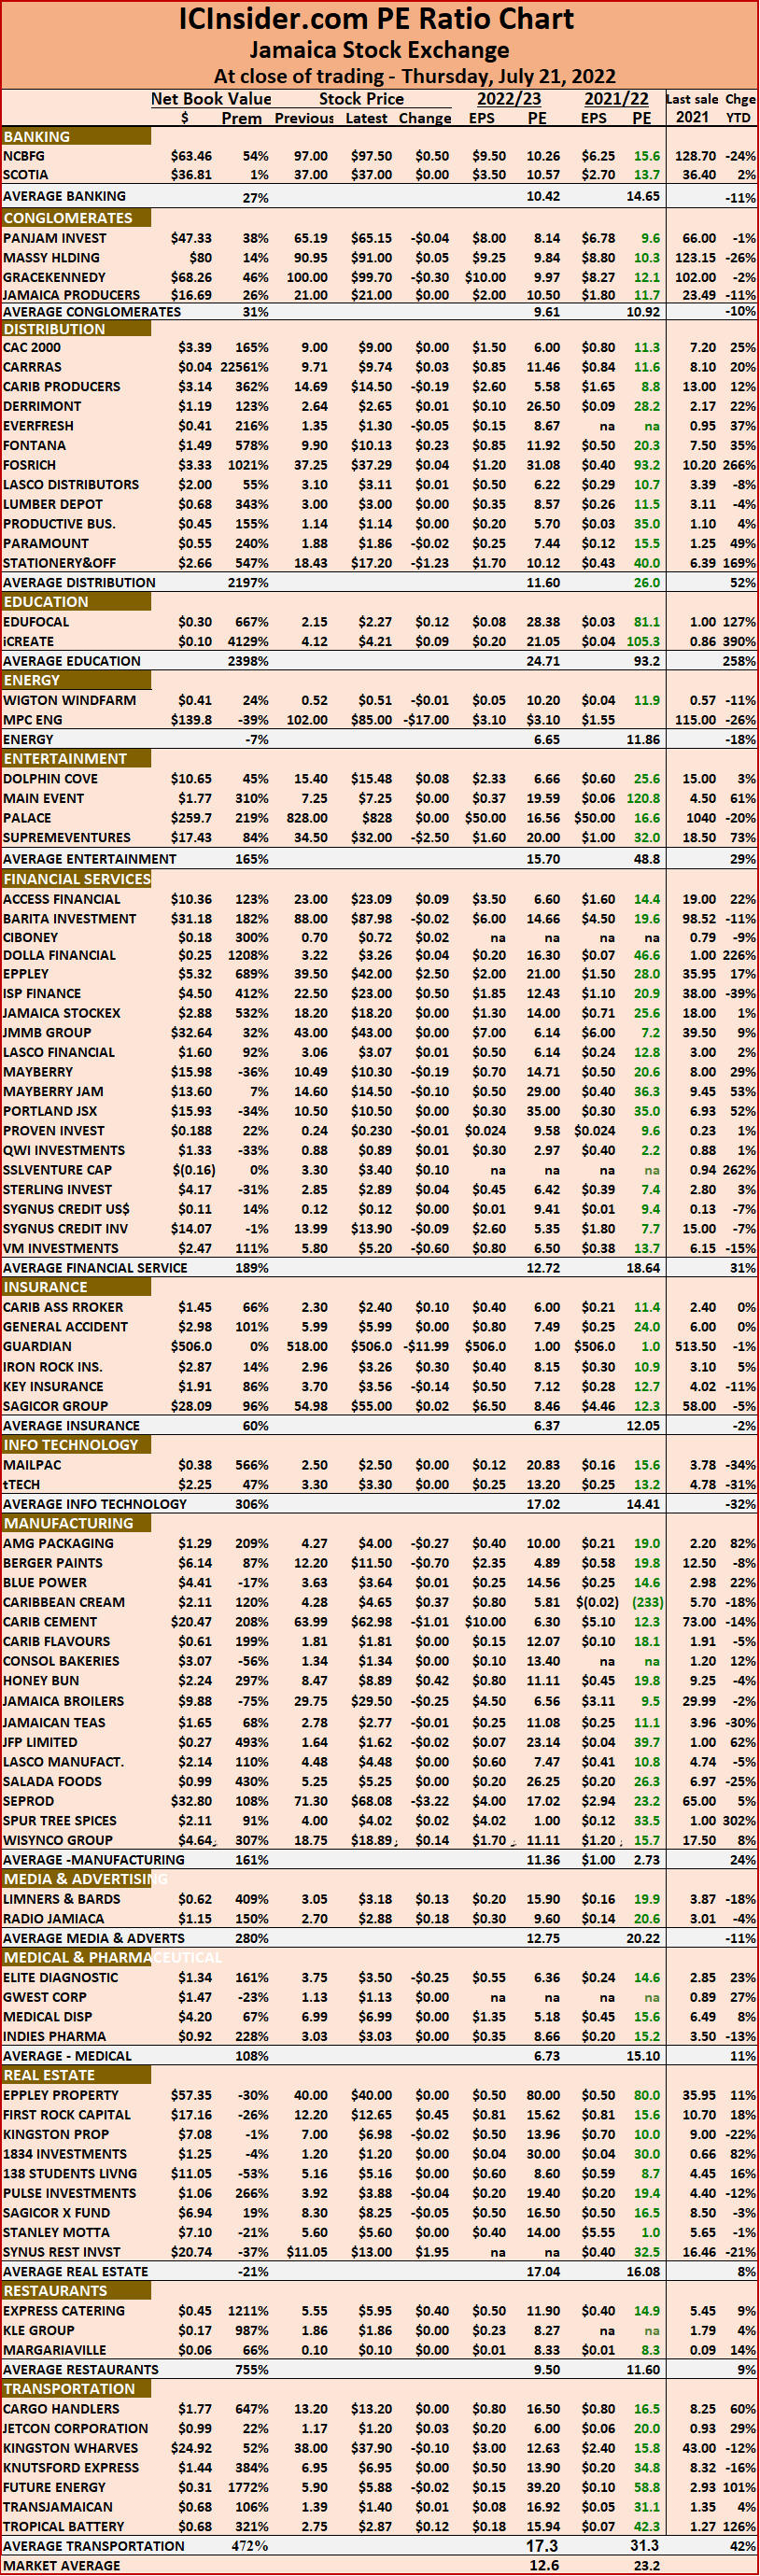
The market’s PE ratio ended at 23.3 based on 2021-22 earnings and 12.5 times those for 2022-23 at the close of trading.
Investors need pertinent information to successfully navigate many investment choices, in the local stock market. The ICInsider.com PE ratio chart and the more detailed daily report charts provide investors with regularly updated information to help decision-making.
Investors should use the chart to help make rational investment decisions by investing in stocks close to the average for the sector and not going too far from it unless there are compelling reasons to do so. This approach helps to remove emotions from investment decisions and put in on fundamentals while at the same time not being too far from the majority of investors. Investors who buy when the price of a stock is close to the average will find that they are not inclined to overpay for a stock.
 The ICInsider.com PE Ratio chart covers all ordinary shares on the Jamaica Stock Exchange. It shows companies grouped on an industry basis, allowing easy comparisons between the same sector companies and the overall market.
The net asset value of each company is reported as a guide to assess the value of stocks based on this measure quickly. The chart also shows daily changes in stock prices and the percentage year to date price movement based on the last traded prices. Dividends payable and yields for each company are shown in the Main and Junior Markets’ daily report charts that show the closing volume for the bids and offers.
The EPS & PE ratios are based on 2021 and 2022 actual or projected earnings, excluding major one off items. The PE Ratio is the most popular measure used to determine the value of stocks.
112 points drop for Junior Market
Big fall for JSE Main Market as Juniors slip
Stocks fell on the Jamaica Stock Exchange market on Friday with the Main Market indices suffering big losses while the Junior and JSEUSD Markets closed marginally lower. The JSE Combined Index a measure of the overall market, dived 3,183.27 points to 390,279.91 as a wide number of Main Market stocks dropped.
 Trading ended, with 22,466,609 shares changing hands in the overall market, with a value of $162.1 million, while the JSE USD market ended with the value of stocks traded at US$24,741.
At the close, the All Jamaican Composite Index dropped 4,182.94 points to 429,858.63, the JSE Main Index declined 3,266.08 points to close at 375,964.46, the Junior Market lost 14.40 points to 4,309.11 and the JSE USD market Index dipped 1.71 points to 206.35.
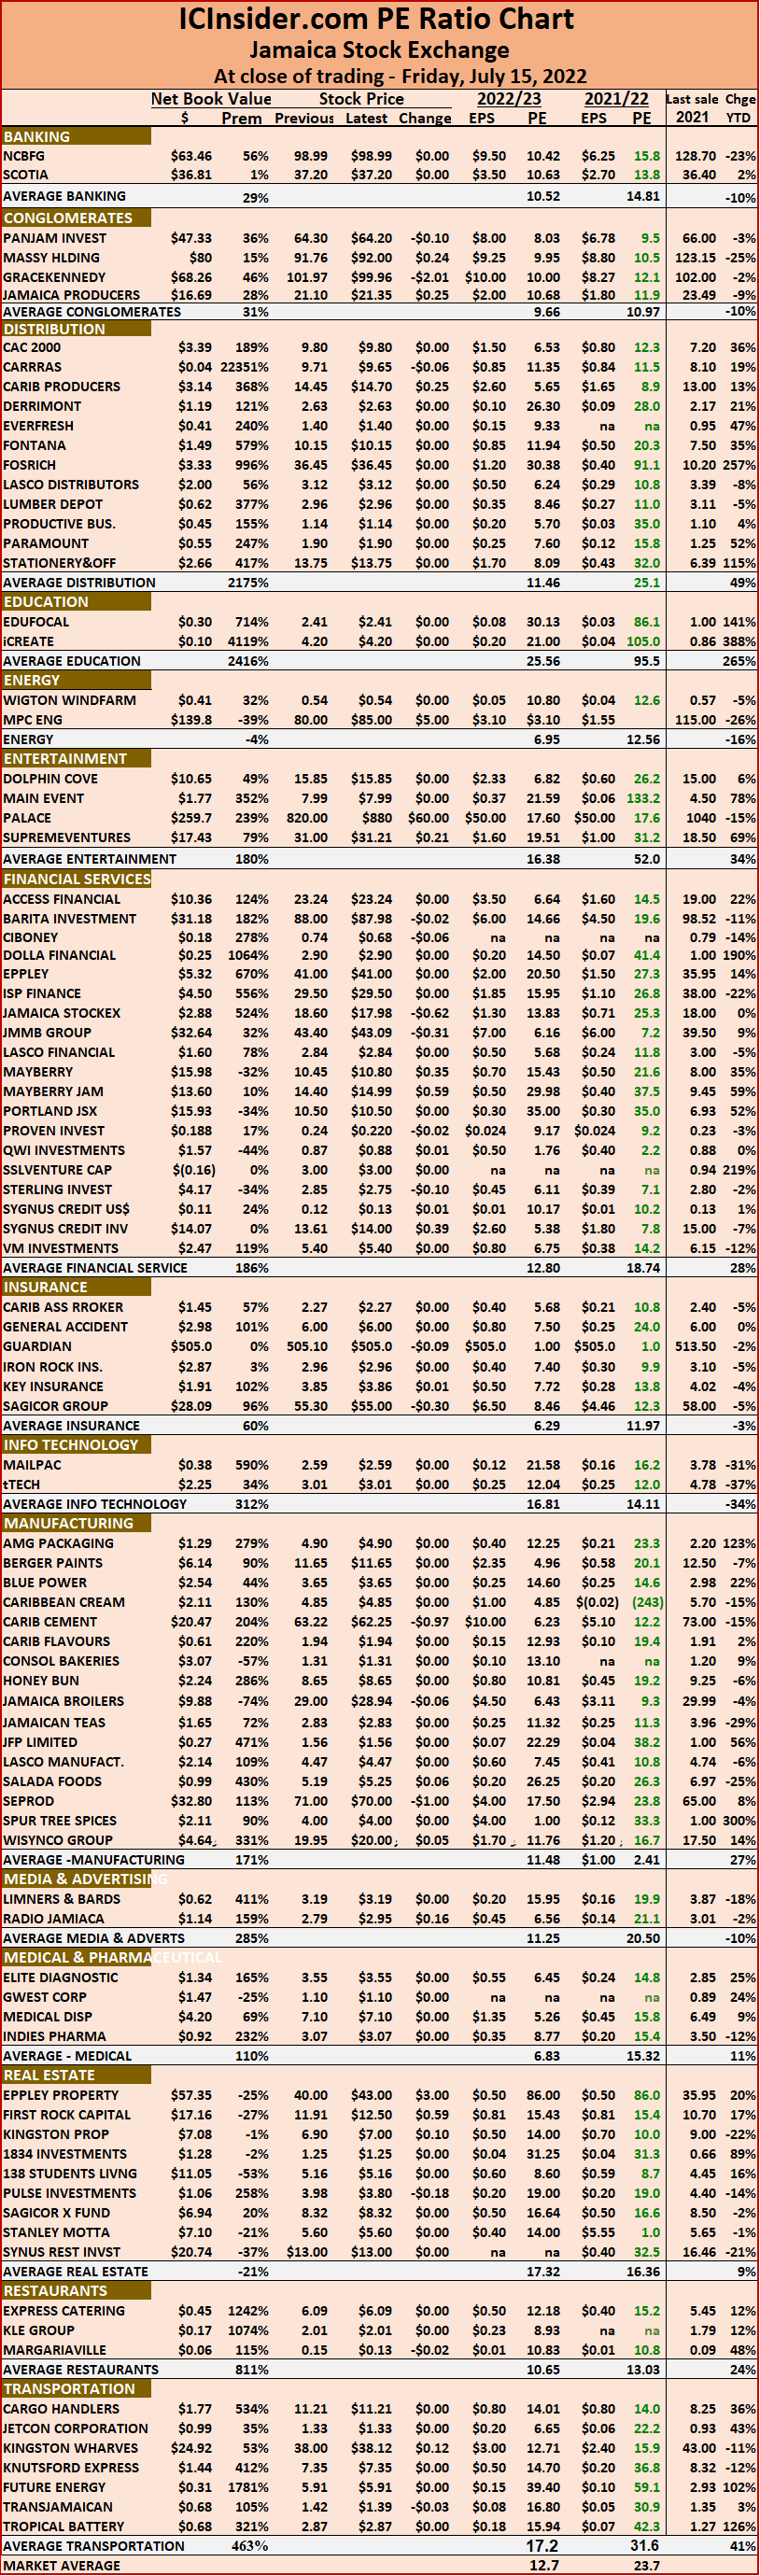
The market’s PE ratio ended at 23.5 based on 2021-22 earnings and 12.6 times those for 2022-23 at the close of trading.
Investors need pertinent information to successfully navigate many investment choices, in the local stock market. The ICInsider.com PE ratio chart and the more detailed daily report charts provide investors with regularly updated information to help decision-making.
Investors should use the chart to help make rational investment decisions by investing in stocks close to the average for the sector and not going too far from it unless there are compelling reasons to do so. This approach helps to remove emotions from investment decisions and put in on fundamentals while at the same time not being too far from the majority of investors. Investors who buy when the price of a stock is close to the average will find that they are not inclined to overpay for a stock.
 The ICInsider.com PE Ratio chart covers all ordinary shares on the Jamaica Stock Exchange. It shows companies grouped on an industry basis, allowing easy comparisons between the same sector companies and the overall market.
The net asset value of each company is reported as a guide to assess the value of stocks based on this measure quickly. The chart also shows daily changes in stock prices and the percentage year to date price movement based on the last traded prices. Dividends payable and yields for each company are shown in the Main and Junior Markets’ daily report charts that show the closing volume for the bids and offers.
The EPS & PE ratios are based on 2021 and 2022 actual or projected earnings, excluding major one off items. The PE Ratio is the most popular measure used to determine the value of stocks.
JSE Main Market fell, Junior Market rises
The Jamaica Stock Exchange main market and the JSE USD market closed lower on Wednesday with just modest changes to the market indices while the Junior Market closed higher. The JSE Combined Index a measure of the overall market, fell 1,084.11 points to 393,463.18.
Trading ended, with 18,447,686 shares changing hands in the overall market, with a value of $105.14 million, while the JSE USD market ended with the value of stocks traded at US$11,046.
At the close, the All Jamaican Composite Index dipped 1,348.21 points to 434,041.57, the JSE Main Index declined 1,439.56 points to close at 379,230.74, the Junior Market climbed 29.12 points to 4,323.51 and the JSE USD market Index dipped 3.17 points to 208.06.
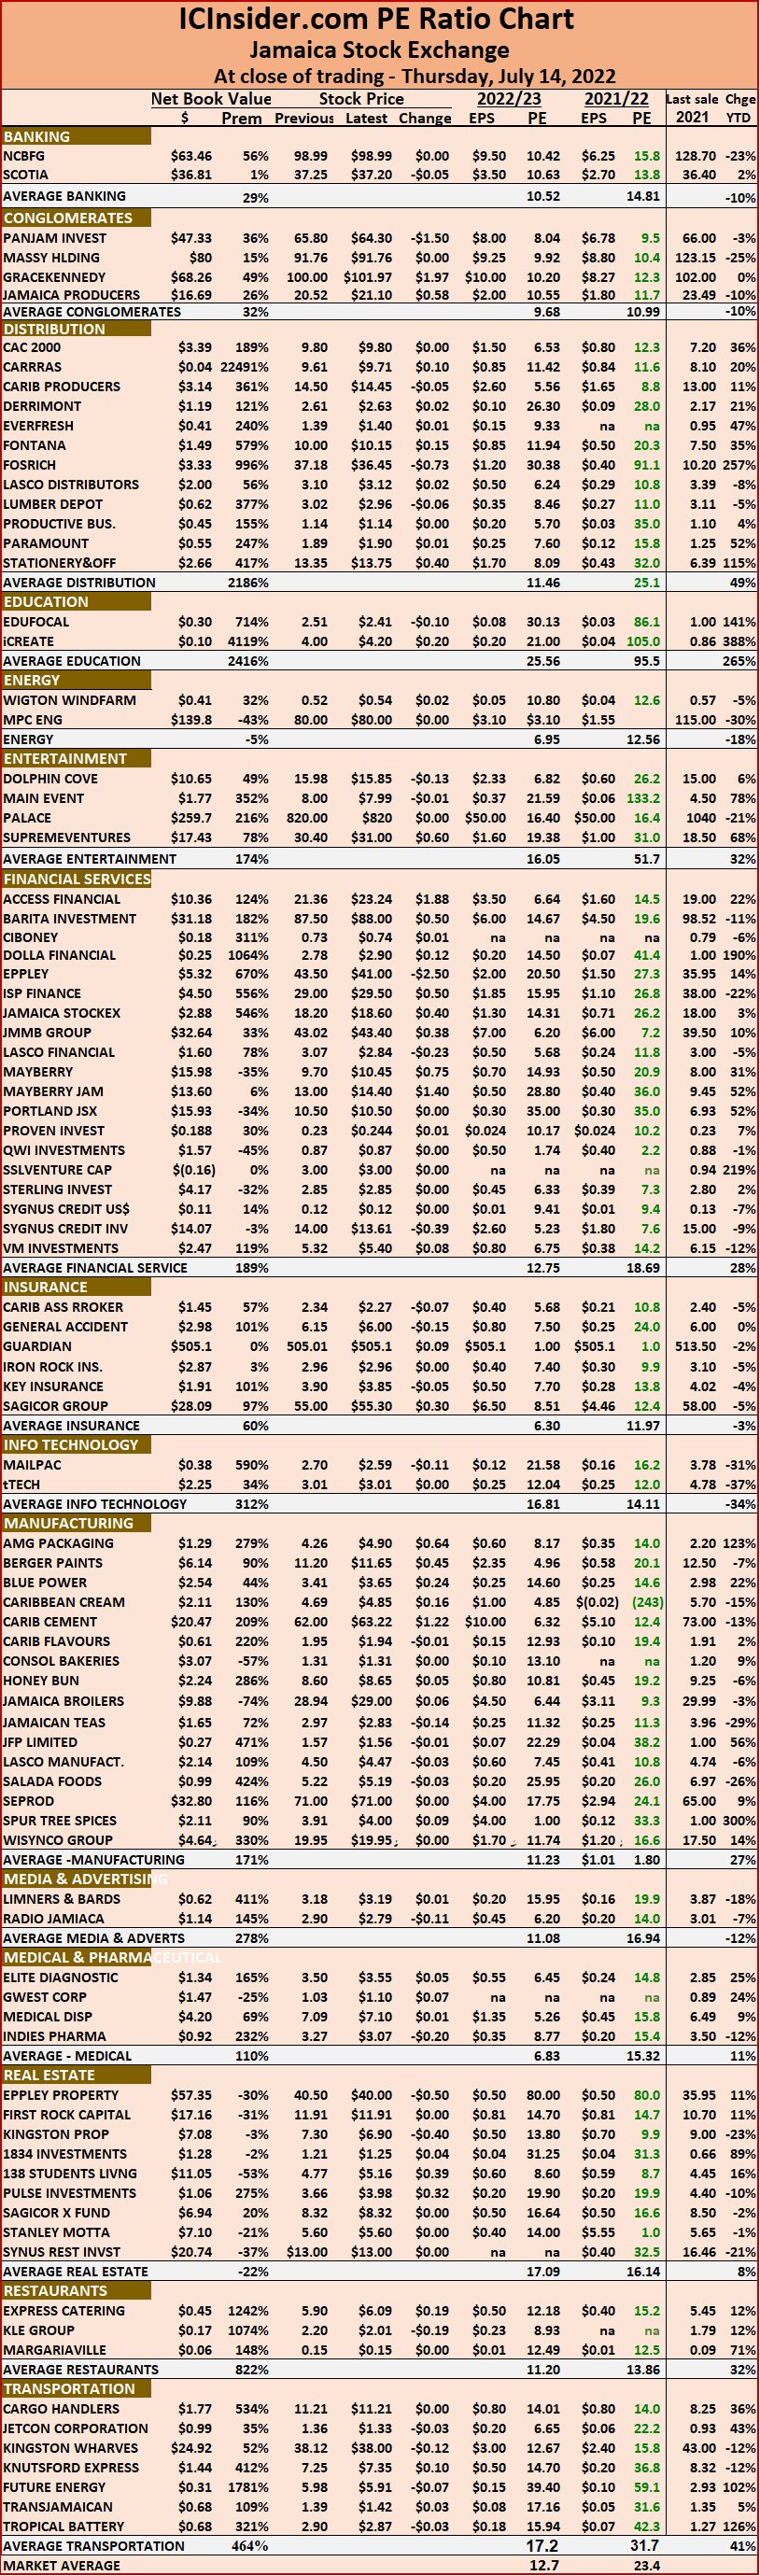
The market’s PE ratio ended at 23.2 based on 2021-22 earnings and 12.6 times those for 2022-23 at the close of trading.
Investors need pertinent information to successfully navigate many investment choices, in the local stock market. The ICInsider.com PE ratio chart and the more detailed daily report charts provide investors with regularly updated information to help decision-making.
Investors should use the chart to help make rational investment decisions by investing in stocks close to the average for the sector and not going too far from it unless there are compelling reasons to do so. This approach helps to remove emotions from investment decisions and put in on fundamentals while at the same time not being too far from the majority of investors. Investors who buy when the price of a stock is close to the average will find that they are not inclined to overpay for a stock.
 The ICInsider.com PE Ratio chart covers all ordinary shares on the Jamaica Stock Exchange. It shows companies grouped on an industry basis, allowing easy comparisons between the same sector companies and the overall market.
The net asset value of each company is reported as a guide to assess the value of stocks based on this measure quickly. The chart also shows daily changes in stock prices and the percentage year to date price movement based on the last traded prices. Dividends payable and yields for each company are shown in the Main and Junior Markets’ daily report charts that show the closing volume for the bids and offers.
The EPS & PE ratios are based on 2021 and 2022 actual or projected earnings, excluding major one off items. The PE Ratio is the most popular measure used to determine the value of stocks.
Moderate changes to JSE market value
The Jamaica Stock Exchange closed on Tuesday with just modest changes to the market indices as trading levels declined from that on Tuesday and closed with the JSE Combined Index rising just 30.44 points to 394,547.29.
 Trading ended, with 18,618,446 shares changing hands in the overall market, with a value of $100.4 million, while the JSE USD market ended with the value of stocks traded at US$5,437.
At the close, the All Jamaican Composite Index dipped 100.26 points to 435,389.78, the JSE Main Index rose 34.28 points to close at 380,670.30, the Junior Market slipped 0.17 points to 4,294.39 and the JSE USD market Index dipped 0.99 points to 211.23.
The market’s PE ratio ended at 23 based on 2021-22 earnings and 12.5 times those for 2022-23 at the close of trading.
Investors need pertinent information to successfully navigate many investment choices, in the local stock market. The ICInsider.com PE ratio chart and the more detailed daily report charts provide investors with regularly updated information to help decision-making.
Investors should use the chart to help make rational investment decisions by investing in stocks close to the average for the sector and not going too far from it unless there are compelling reasons to do so. This approach helps to remove emotions from investment decisions and put in on fundamentals while at the same time not being too far from the majority of investors. Investors who buy when the price of a stock is close to the average will find that they are not inclined to overpay for a stock.
 The ICInsider.com PE Ratio chart covers all ordinary shares on the Jamaica Stock Exchange. It shows companies grouped on an industry basis, allowing easy comparisons between the same sector companies and the overall market.
The net asset value of each company is reported as a guide to assess the value of stocks based on this measure quickly. The chart also shows daily changes in stock prices and the percentage year to date price movement based on the last traded prices. Dividends payable and yields for each company are shown in the Main and Junior Markets’ daily report charts that show the closing volume for the bids and offers.
The EPS & PE ratios are based on 2021 and 2022 actual or projected earnings, excluding major one off items. The PE Ratio is the most popular measure used to determine the value of stocks.
Mixed trading for JSE markets
Stocks lost steam at the close of the trading on the Jamaica Stock Exchange on Tuesday with main market indices falling and the Junior and JSE USD markets rising, with modest changes as the market closed with the JSE Combined Index falling 967.97 points to 394,516.85 on a day when trading rose firmly over Monday’s levels.
Trading ended, with 27,304,700 shares changing hands in the overall market, carrying a value of $167.4 million, while the JSE USD market ended with the value of stocks traded at US$8,686.
At the close, the All Jamaican Composite Index dipped 1,135.65 points to 435,490.04 the JSE Main Index shed 1,091.49 points to close at 380,636.02, the Junior Market rose just 5.84 points to 4,294.56 and the JSE USD market Index popped 5.75 points to 212.22.
The market’s PE ratio ended at 23.4 based on 2021-22 earnings and 12.8 times those for 2022-23 at the close of trading.
Investors need pertinent information to successfully navigate many investment choices, in the local stock market. The ICInsider.com PE ratio chart and the more detailed daily report charts provide investors with regularly updated information to help decision-making.
 Investors should use the chart to help make rational investment decisions by investing in stocks close to the average for the sector and not going too far from it unless there are compelling reasons to do so. This approach helps to remove emotions from investment decisions and put in on fundamentals while at the same time not being too far from the majority of investors. Investors who buy when the price of a stock is close to the average will find that they are not inclined to overpay for a stock.
The ICInsider.com PE Ratio chart covers all ordinary shares on the Jamaica Stock Exchange. It shows companies grouped on an industry basis, allowing easy comparisons between the same sector companies and the overall market.
The net asset value of each company is reported as a guide to assess the value of stocks based on this measure quickly. The chart also shows daily changes in stock prices and the percentage year to date price movement based on the last traded prices. Dividends payable and yields for each company are shown in the Main and Junior Markets’ daily report charts that show the closing volume for the bids and offers.
The EPS & PE ratios are based on 2021 and 2022 actual or projected earnings, excluding major one off items. The PE Ratio is the most popular measure used to determine the value of stocks.
Moderate trading continues for JSE markets
The Jamaica Stock Exchange main market indices rose on a day when the Junior and JSE USD markets slipped but changes were modest with the JSE Combined Index rising 760.60 points to close at 395,484.82 on a day of moderate trading.
 Trading ended with just 14,618,589 shares changing hands in the overall market, carrying a value of a mere $111.67 million, while the JSE USD market ended with the value of stocks traded at US$8,502.
At the close, the All Jamaican Composite Index rose 982.40 points to 436,625.69 the JSE Main Index climbed 1,063.47 points to close at 381,727.51, the Junior Market slipped by 25.98 points to 4,288.72 and the JSE USD market Index dipped 3.19 points lower to 206.47.
The market’s PE ratio ended at 23.2 based on 2021-22 earnings and 12.7 times those for 2022-23 at the close of trading.
Investors need pertinent information to successfully navigate many investment choices, in the local stock market. The ICInsider.com PE ratio chart and the more detailed daily report charts provide investors with regularly updated information to help decision-making.
Investors should use the chart to help make rational investment decisions by investing in stocks close to the average for the sector and not going too far from it unless there are compelling reasons to do so. This approach helps to remove emotions from investment decisions and put in on fundamentals while at the same time not being too far from the majority of investors. Investors who buy when the price of a stock is close to the average will find that they are not inclined to overpay for a stock.
 The ICInsider.com PE Ratio chart covers all ordinary shares on the Jamaica Stock Exchange. It shows companies grouped on an industry basis, allowing easy comparisons between the same sector companies and the overall market.
The net asset value of each company is reported as a guide to assess the value of stocks based on this measure quickly. The chart also shows daily changes in stock prices and the percentage year to date price movement based on the last traded prices. Dividends payable and yields for each company are shown in the Main and Junior Markets’ daily report charts that show the closing volume for the bids and offers.
The EPS & PE ratios are based on 2021 and 2022 actual or projected earnings, excluding major one off items. The PE Ratio is the most popular measure used to determine the value of stocks.
All round losses for JSE markets
All markets slipped on the Jamaica Stock Exchange to close out the week and closed with modest changes in the indices. The JSE Combined Index fell 774.70 points to 394,724.22.
Trading ended, with a mere 15,955,497 shares changing hands in the overall market, with a value of just $82.5 million, while the JSE USD market ended with the value of stocks traded at US$96,524.
At the close, the All Jamaican Composite Index fell 768.00 points to 435,643.29, the JSE Main Index lost 652.21 points to close at 380,664.04, the Junior Market slipped 18.34 points to 4,314.71 and the JSE USD market Index slipped 1.25 points lower to 209.66.
The market’s PE ratio ended at 23.7 based on 2021-22 earnings and 12.7 times those for 2022-23 at the close of trading.
Investors need pertinent information to successfully navigate many investment choices, in the local stock market. The ICInsider.com PE ratio chart and the more detailed daily report charts provide investors with regularly updated information to help decision-making.
Investors should use the chart to help make rational investment decisions by investing in stocks close to the average for the sector and not going too far from it unless there are compelling reasons to do so. This approach helps to remove emotions from investment decisions and put in on fundamentals while at the same time not being too far from the majority of investors. Investors who buy when the price of a stock is close to the average will find that they are not inclined to overpay for a stock.
 The ICInsider.com PE Ratio chart covers all ordinary shares on the Jamaica Stock Exchange. It shows companies grouped on an industry basis, allowing easy comparisons between the same sector companies and the overall market.
The net asset value of each company is reported as a guide to assess the value of stocks based on this measure quickly. The chart also shows daily changes in stock prices and the percentage year to date price movement based on the last traded prices. Dividends payable and yields for each company are shown in the Main and Junior Markets’ daily report charts that show the closing volume for the bids and offers.
The EPS & PE ratios are based on 2021 and 2022 actual or projected earnings, excluding major one off items. The PE Ratio is the most popular measure used to determine the value of stocks.
Gains for Jamaican stocks
Trading on the Junior Market was spirited on Thursday accounting for $40 million against $87 million in the Jamaica Stock Exchange Main Market, with PanJam Investment trading nearly $17 million in shares, with the market closing with modest changes in the indices as shown by the JSE Combined Index that rose a mere 82.65 points to end at 395,498.92.

PanJam Investment topped trading on Thursday with $17m
Trading ended on Thursday, with a mere 17,460,701 shares changing hands in the overall market, with a value of just $127.2 million, while the JSE USD market ended with the value of stocks traded at US$24,336.
At the close, the All Jamaican Composite Index rose 169.71 points to 436,411.29, the JSE Main Index added just 30.25 points to close at 381,316.25, the Junior Market rose 6.05 points to 4,333.05 and the JSE USD market Index slipped 1.35 points to 210.92.
The market’s PE ratio ended at 23.4 based on 2021-22 earnings and 12.7 times those for 2022-23 at the close of trading.
Investors need pertinent information to successfully navigate many investment choices, in the local stock market. The ICInsider.com PE ratio chart and the more detailed daily report charts provide investors with regularly updated information to help decision-making.
Investors should use the chart to help make rational investment decisions by investing in stocks close to the average for the sector and not going too far from it unless there are compelling reasons to do so. This approach helps to remove emotions from investment decisions and put in on fundamentals while at the same time not being too far from the majority of investors. Investors who buy when the price of a stock is close to the average will find that they are not inclined to overpay for a stock.
 The ICInsider.com PE Ratio chart covers all ordinary shares on the Jamaica Stock Exchange. It shows companies grouped on an industry basis, allowing easy comparisons between the same sector companies and the overall market.
The net asset value of each company is reported as a guide to assess the value of stocks based on this measure quickly. The chart also shows daily changes in stock prices and the percentage year to date price movement based on the last traded prices. Dividends payable and yields for each company are shown in the Main and Junior Markets’ daily report charts that show the closing volume for the bids and offers.
The EPS & PE ratios are based on 2021 and 2022 actual or projected earnings, excluding major one off items. The PE Ratio is the most popular measure used to determine the value of stocks.
Sharp drop for Junior Market
Junior Market pulled back on Wednesday with the market index plunging 73.38 points to 4,327.00 with a pullback in prices of several stocks, with the Junior Market fall spilling over into the JSE Combined Index fell 310.14 points to end at 395,416.26.
Trading ended on the Jamaica Stock Exchange on Wednesday with 24,248,164 shares trading in the overall market, with a value of just $93.8 million, while the JSE USD market ended with US$6,586, following market consolidation.
At the close, the All Jamaican Composite Index rose 495.67 points to 436,241.57, the JSE Main Index added 374.05 points to close at 381,286.00 and the JSE USD market Index inched 0.41 points lower to 212.27.
The market’s PE ratio ended at 23.4 based on 2021-22 earnings and 12.7 times those for 2022-23 at the close of trading.
Investors need pertinent information to successfully navigate many investment choices, in the local stock market. The ICInsider.com PE ratio chart and the more detailed daily report charts provide investors with regularly updated information to help decision-making.
Investors should use the chart to help make rational investment decisions by investing in stocks close to the average for the sector and not going too far from it unless there are compelling reasons to do so. This approach helps to remove emotions from investment decisions and put in on fundamentals while at the same time not being too far from the majority of investors. Investors who buy when the price of a stock is close to the average will find that they are not inclined to overpay for a stock.
 The ICInsider.com PE Ratio chart covers all ordinary shares on the Jamaica Stock Exchange. It shows companies grouped on an industry basis, allowing easy comparisons between the same sector companies and the overall market.
The net asset value of each company is reported as a guide to assess the value of stocks based on this measure quickly. The chart also shows daily changes in stock prices and the percentage year to date price movement based on the last traded prices. Dividends payable and yields for each company are shown in the Main and Junior Markets’ daily report charts that show the closing volume for the bids and offers.
The EPS & PE ratios are based on 2021 and 2022 actual or projected earnings, excluding major one off items. The PE Ratio is the most popular measure used to determine the value of stocks.
Gains for Jamaica Stock Exchange
Trading remained moderate on the Jamaica Stock Exchange on Monday with a mere 21,150,413 shares trading in the overall market, with a value of just $117 million, while the JSE USD market ended with US$33,962 passing through the market, as the market closed with mixed results flowing from the current consolidating mood of the market.
 The JSE Combined Index rose 1,559.39 points to end at 395,726.41, the All Jamaican Composite Index climbed 1,325.22 points to 435,745.89, the JSE Main Index added 1,253.18 points to close at 380,911.94, the Junior Market Index rose 43.10 points to 4,400.38 and the JSE USD market Index dipped 0.87 points to 212.69.
The market’s PE ratio ended at 23.7 based on 2021-22 earnings and 12.9 times those for 2022-23 at the close of trading.
Investors need pertinent information to successfully navigate many investment choices in the local stock market. The ICInsider.com PE ratio chart and the more detailed daily report charts provide investors with regularly updated information to help decision-making.
Investors should use the chart to help make rational investment decisions by investing in stocks close to the average for the sector and not going too far from it unless there are compelling reasons to do so. This approach helps to remove emotions from investment decisions and put in on fundamentals while at the same time not being too far from the majority of investors. Investors who buy when the price of a stock is close to the average will find that they are not inclined to overpay for a stock.
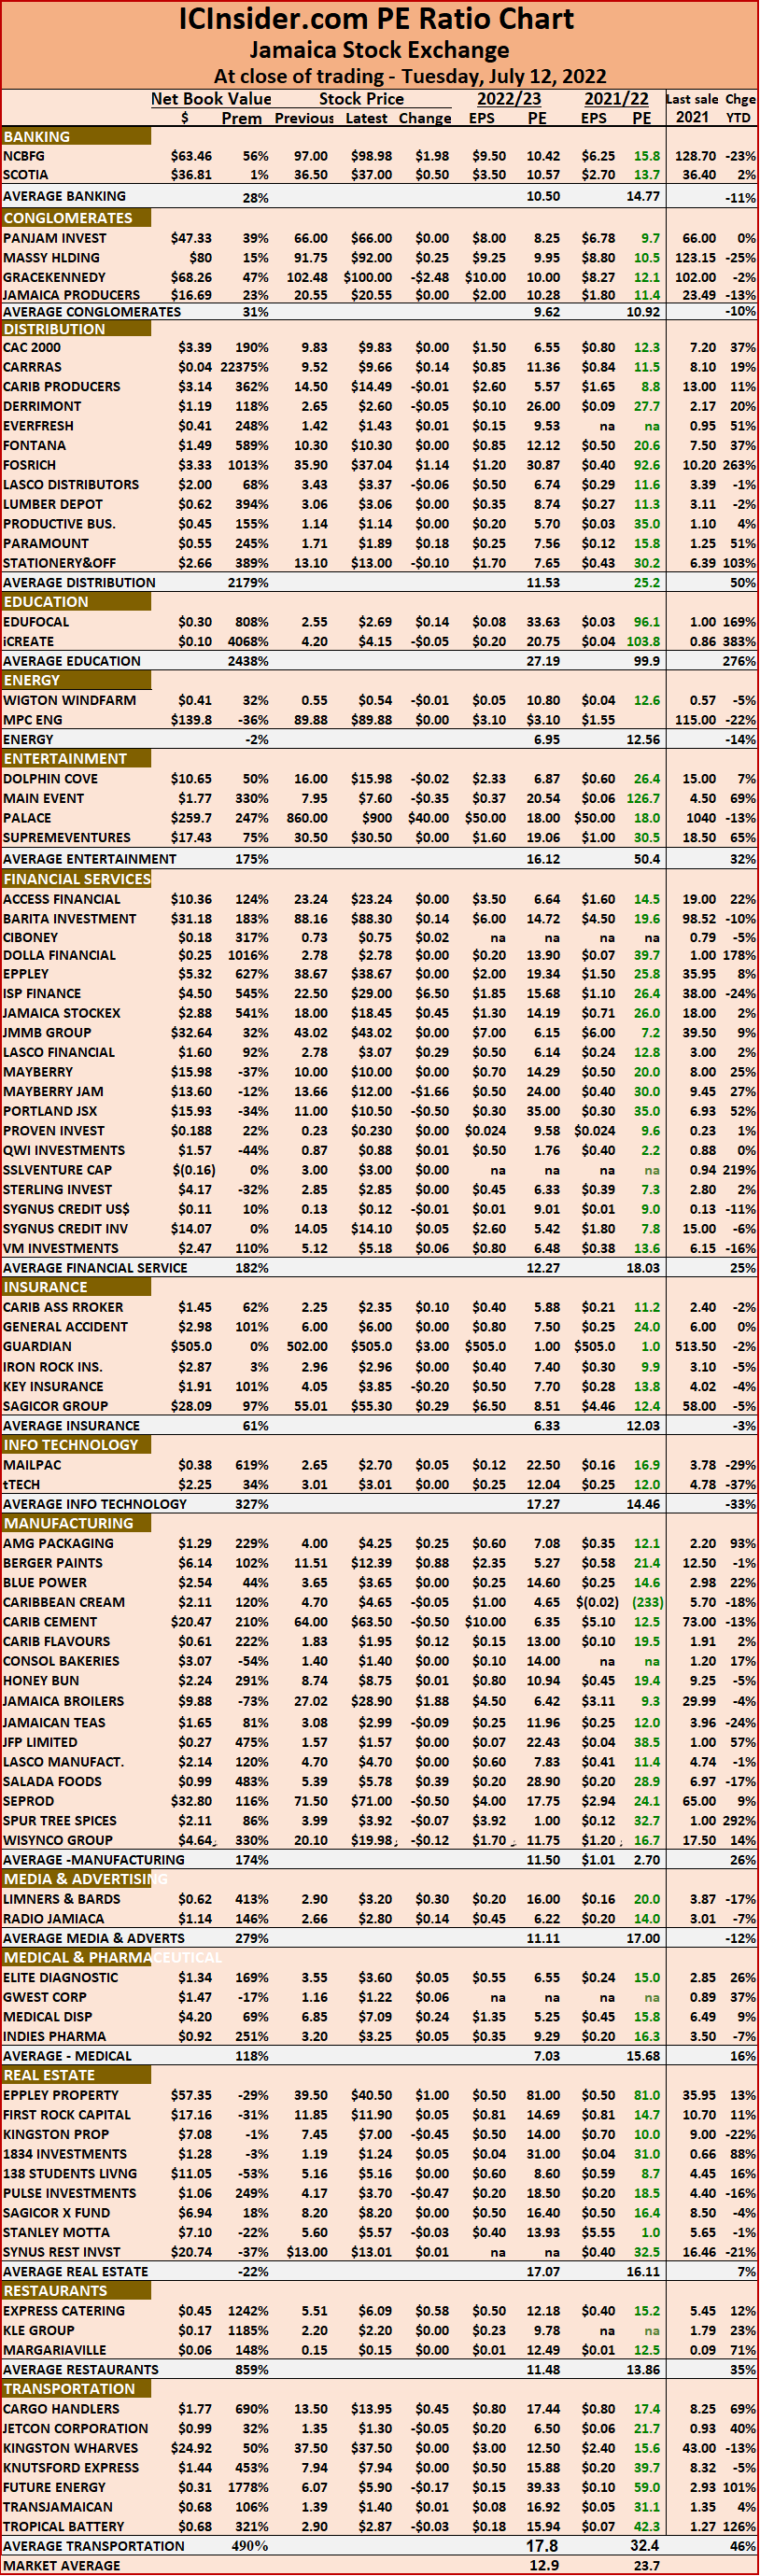 The ICInsider.com PE Ratio chart covers all ordinary shares on the Jamaica Stock Exchange. It shows companies grouped on an industry basis, allowing easy comparisons between the same sector companies and the overall market.
The net asset value of each company is reported as a guide to assess the value of stocks based on this measure quickly. The chart also shows daily changes in stock prices and the percentage year to date price movement based on the last traded prices. Dividends payable and yields for each company are shown in the Main and Junior Markets’ daily report charts that show the closing volume for the bids and offers.
The EPS & PE ratios are based on 2021 and 2022 actual or projected earnings, excluding major one off items. The PE Ratio is the most popular measure used to determine the value of stocks.


