The Jamaica Stock Exchange Main Market indices picked up some points on Tuesday but the Junior Market and the JSEUSD markets recorded a modest fall, resulting in the JSE Combined Index a measure of the overall market, rising 544.73 points to 371,605.77, with a rise in the value of stocks traded.
 The All Jamaican Composite Index dropped 2,541,98 points to 407,422.08, the JSE Main Index rose 619.64 points to 357,814.48, the Junior Market Index dipped 3.86 points to 4,119.65 and the JSE USD market Index slipped 2.48 points to 202.32.
Trading ended with 18,943,371 shares changing hands with the value jumping to $158.2 million, from $115 million, with 40,760,502 shares traded in the overall market on the prior trading day. The JSE USD market ended with the value of stocks traded at US$98,429 versus US$14,534 on the previous day of trading.
The market’s PE ratio ended at 22.9 based on 2021-22 earnings and 12.4 times those for 2022-23 at the close of trading.
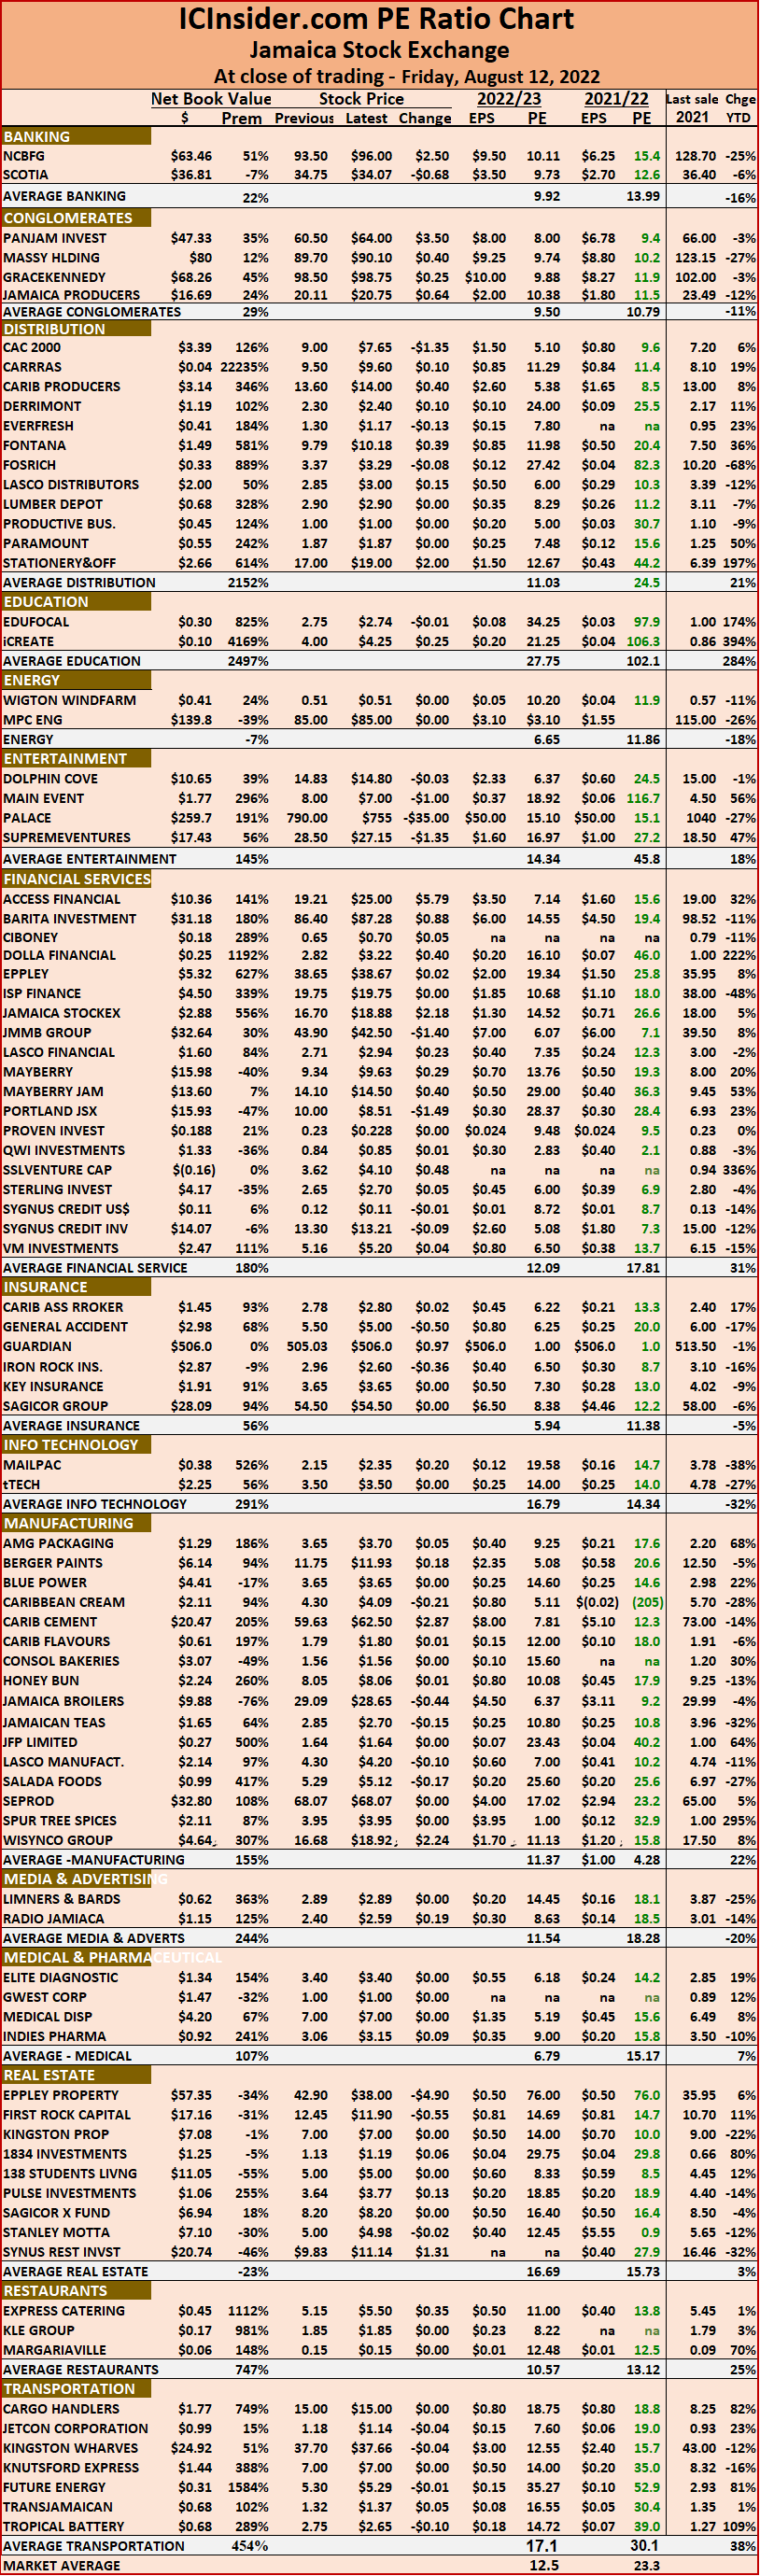
Investors need pertinent information to successfully navigate many investment options in the local stock market. The ICInsider.com PE ratio chart and the more detailed daily report charts provide investors with regularly updated information to help decision-making.
Investors should use the chart to help make rational investment decisions by investing in stocks close to the average for the sector and not going too far from it unless there are compelling reasons to do so. This approach helps to remove emotions from investment decisions and put in on fundamentals while at the same time not being too far from the majority of investors. Investors who buy when the price of a stock is close to the average will find that they are not inclined to overpay for a stock.
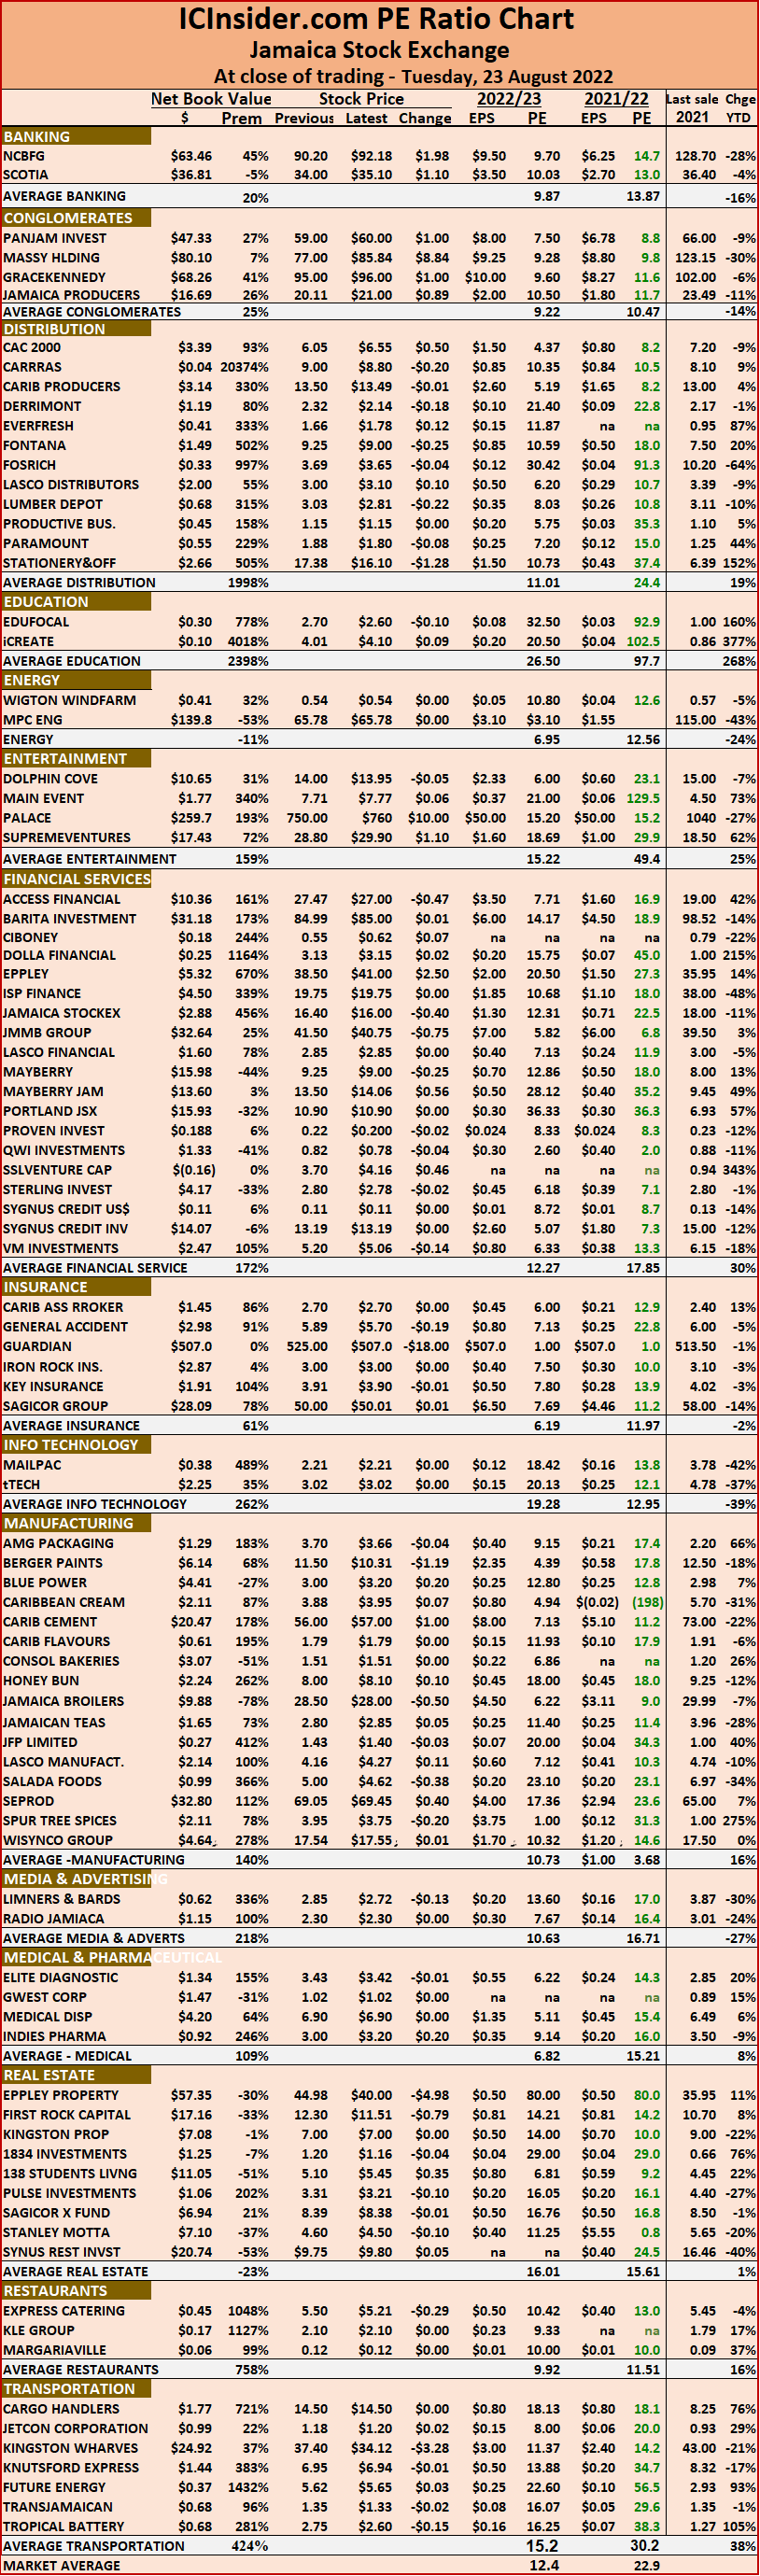 The ICInsider.com PE Ratio chart covers all ordinary shares on the Jamaica Stock Exchange. It shows companies grouped on an industry basis, allowing easy comparisons between the same sector companies and the overall market.
The net asset value of each company is reported as a guide to assess the value of stocks based on this measure quickly. The chart also shows daily changes in stock prices and the percentage year to date price movement based on the last traded prices. Dividends payable and yields for each company are shown in the Main and Junior Markets’ daily report charts that show the closing volume for the bids and offers.
The EPS & PE ratios are based on 2021 and 2022 actual or projected earnings, excluding major one off items. The PE Ratio is the most popular measure used to determine the value of stocks.
 The All Jamaican Composite Index fell 2,052.20 points to 409,964.06, the JSE Main Index dived 5,339.22 points to 357,194.84, the Junior Market Index gained 22.70 points to end at 4,123.51 and the JSE USD market Index popped 4.49 points to 204.80.
 The net asset value of each company is reported as a guide to assess the value of stocks based on this measure quickly. The chart also shows daily changes in stock prices and the percentage year to date price movement based on the last traded prices. Dividends payable and yields for each company are shown in the Main and Junior Markets’ daily report charts that show the closing volume for the bids and offers.
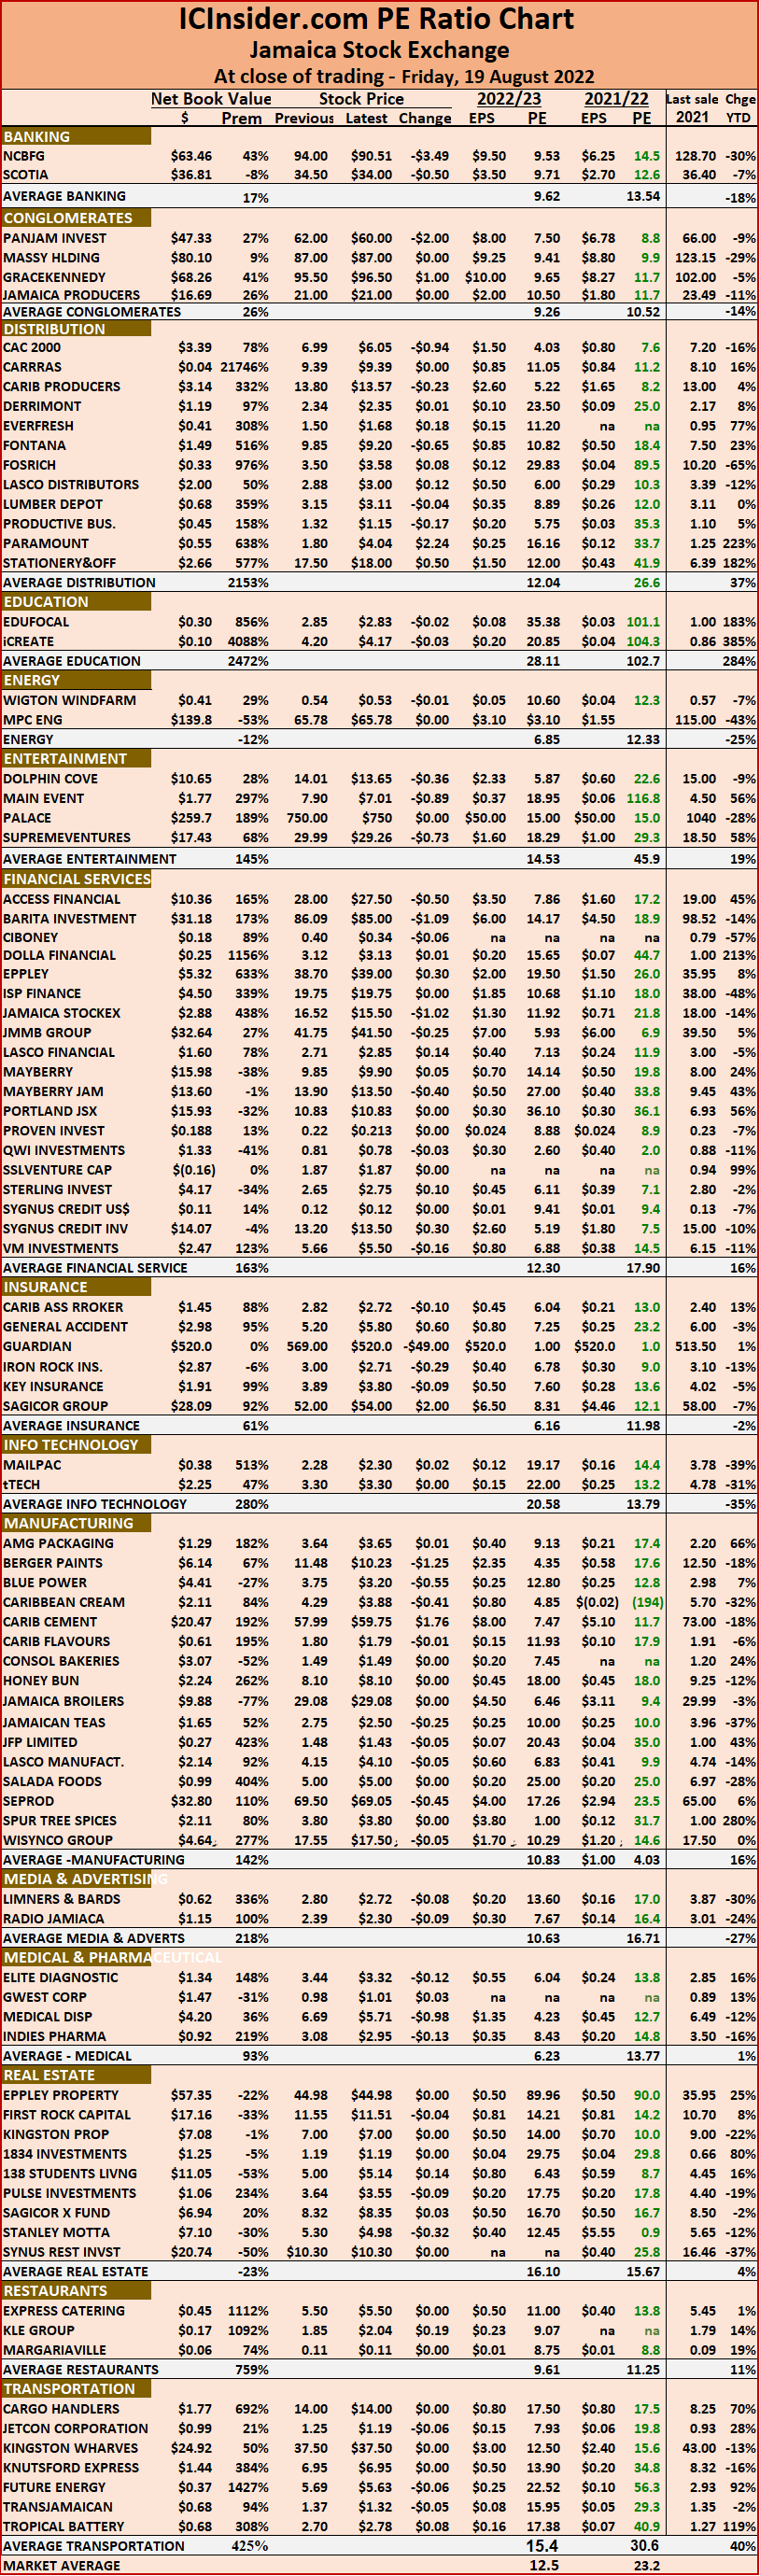 The ICInsider.com PE Ratio chart covers all ordinary shares on the Jamaica Stock Exchange. It shows companies grouped on an industry basis, allowing easy comparisons between the same sector companies and the overall market.
 The ICInsider.com PE Ratio chart covers all ordinary shares on the Jamaica Stock Exchange. It shows companies grouped on an industry basis, allowing easy comparisons between the same sector companies and the overall market.
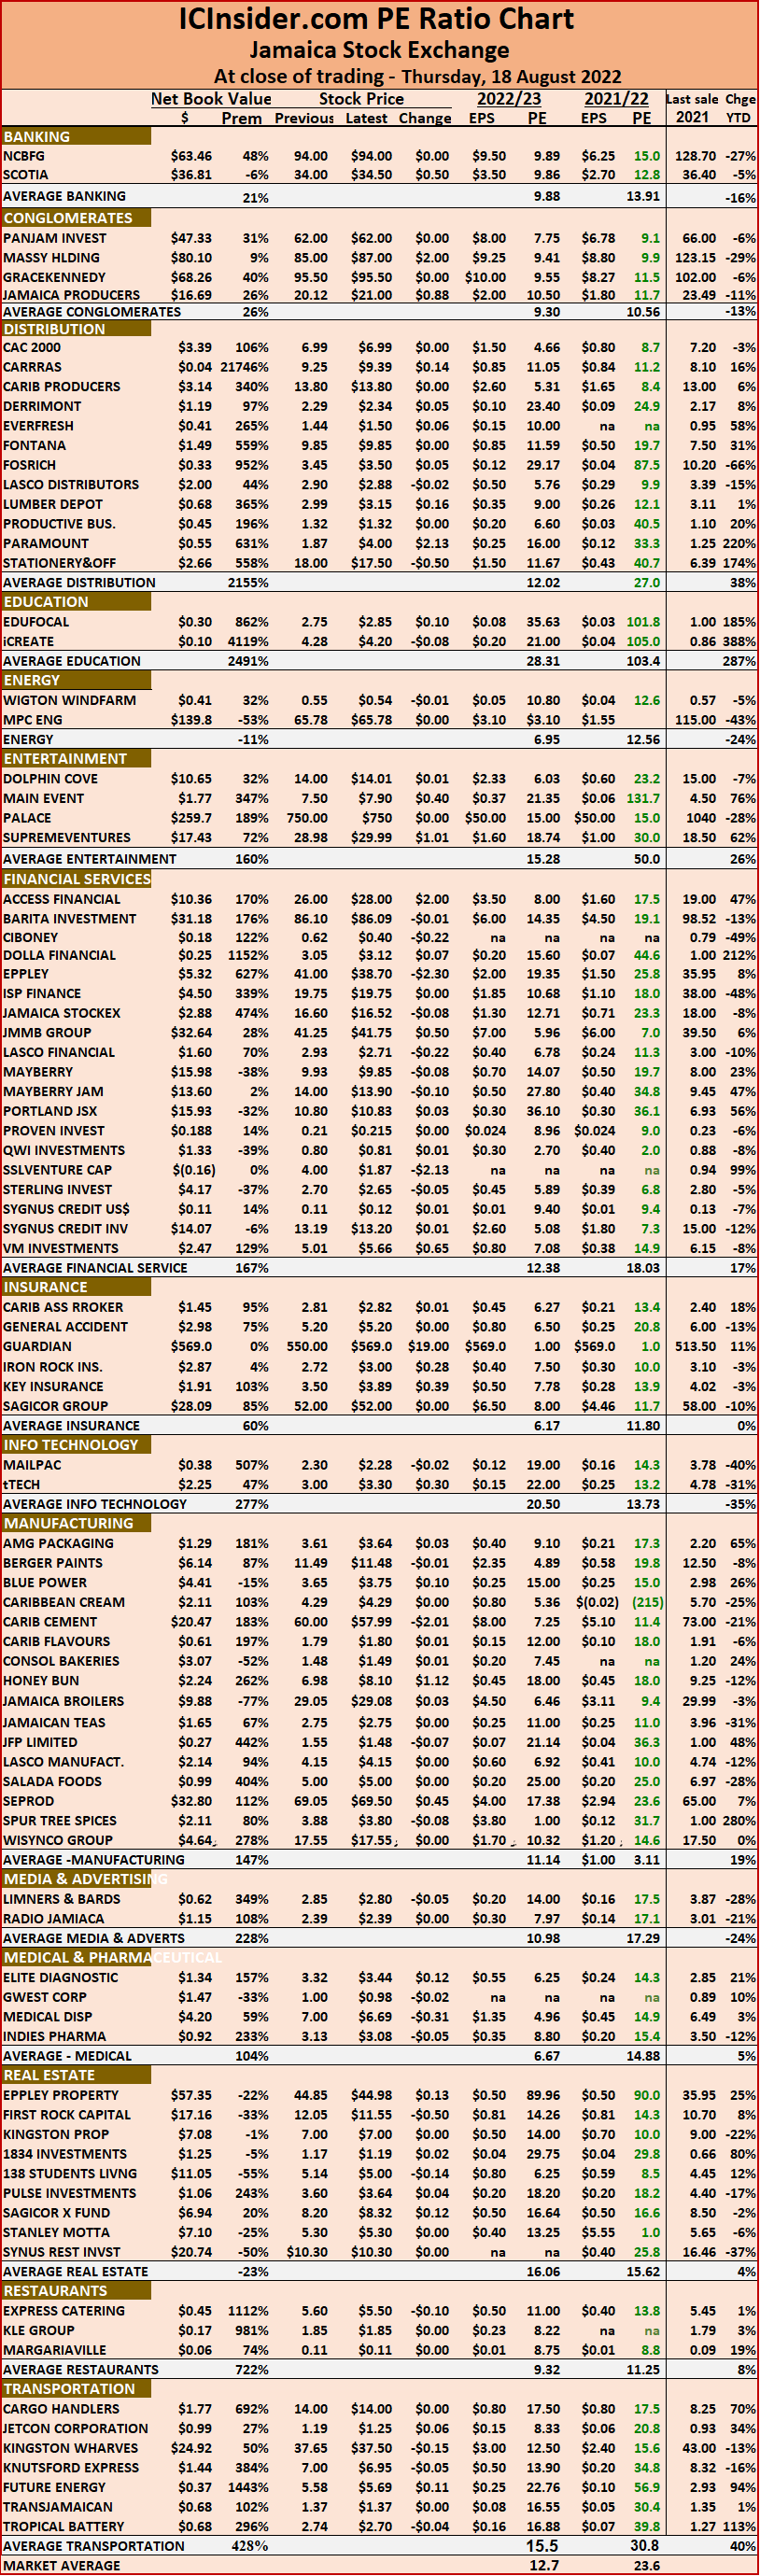
 The All Jamaican Composite Index shed 2,917.62 points to 414,850.94, the JSE Main Index dropped 847.36 points to 365,868.63, the Junior Market Index fell 27.04 points to 4,126.96 and the JSE USD Market Index declined 6.98 points to 208.31.
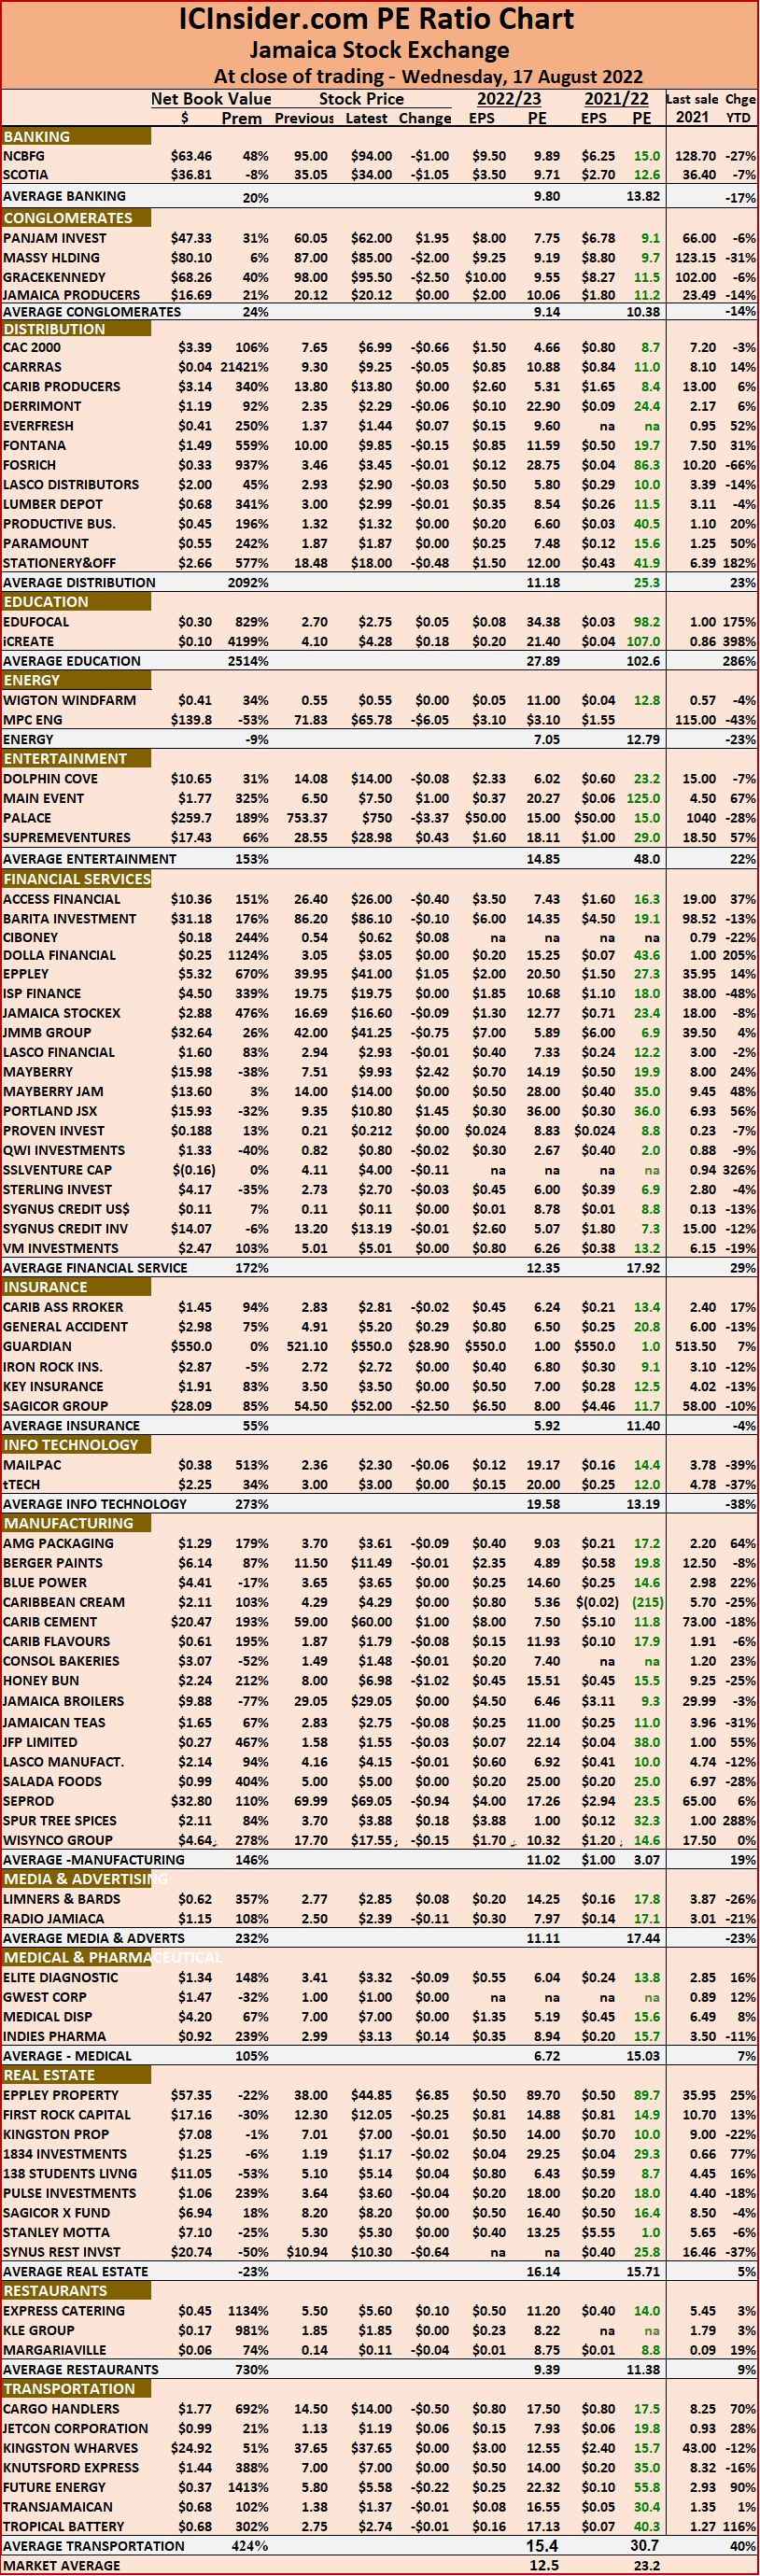 The net asset value of each company is reported as a guide to assess the value of stocks based on this measure quickly. The chart also shows daily changes in stock prices and the percentage year to date price movement based on the last traded prices. Dividends payable and yields for each company are shown in the Main and Junior Markets’ daily report charts that show the closing volume for the bids and offers.
 The All Jamaican Composite Index declined 1,679.50 points to 417,768.56, the JSE Main Index dropped 808.60 points to 366,715.99.
 The ICInsider.com PE Ratio chart covers all ordinary shares on the Jamaica Stock Exchange. It shows companies grouped on an industry basis, allowing easy comparisons between the same sector companies and the overall market.
 The JSE Combined Index a measure of the overall market gained 69.77 points to end at 380,782.61. The All Jamaican Composite Index rose 897.37 points to 419,448.06, the JSE Main Index added 188.92 points to close at 367,524.60, the Junior Market Index slipped 11.88 points to 4,130.54 and the JSE USD Market Index jumped 18 points to 212.22.
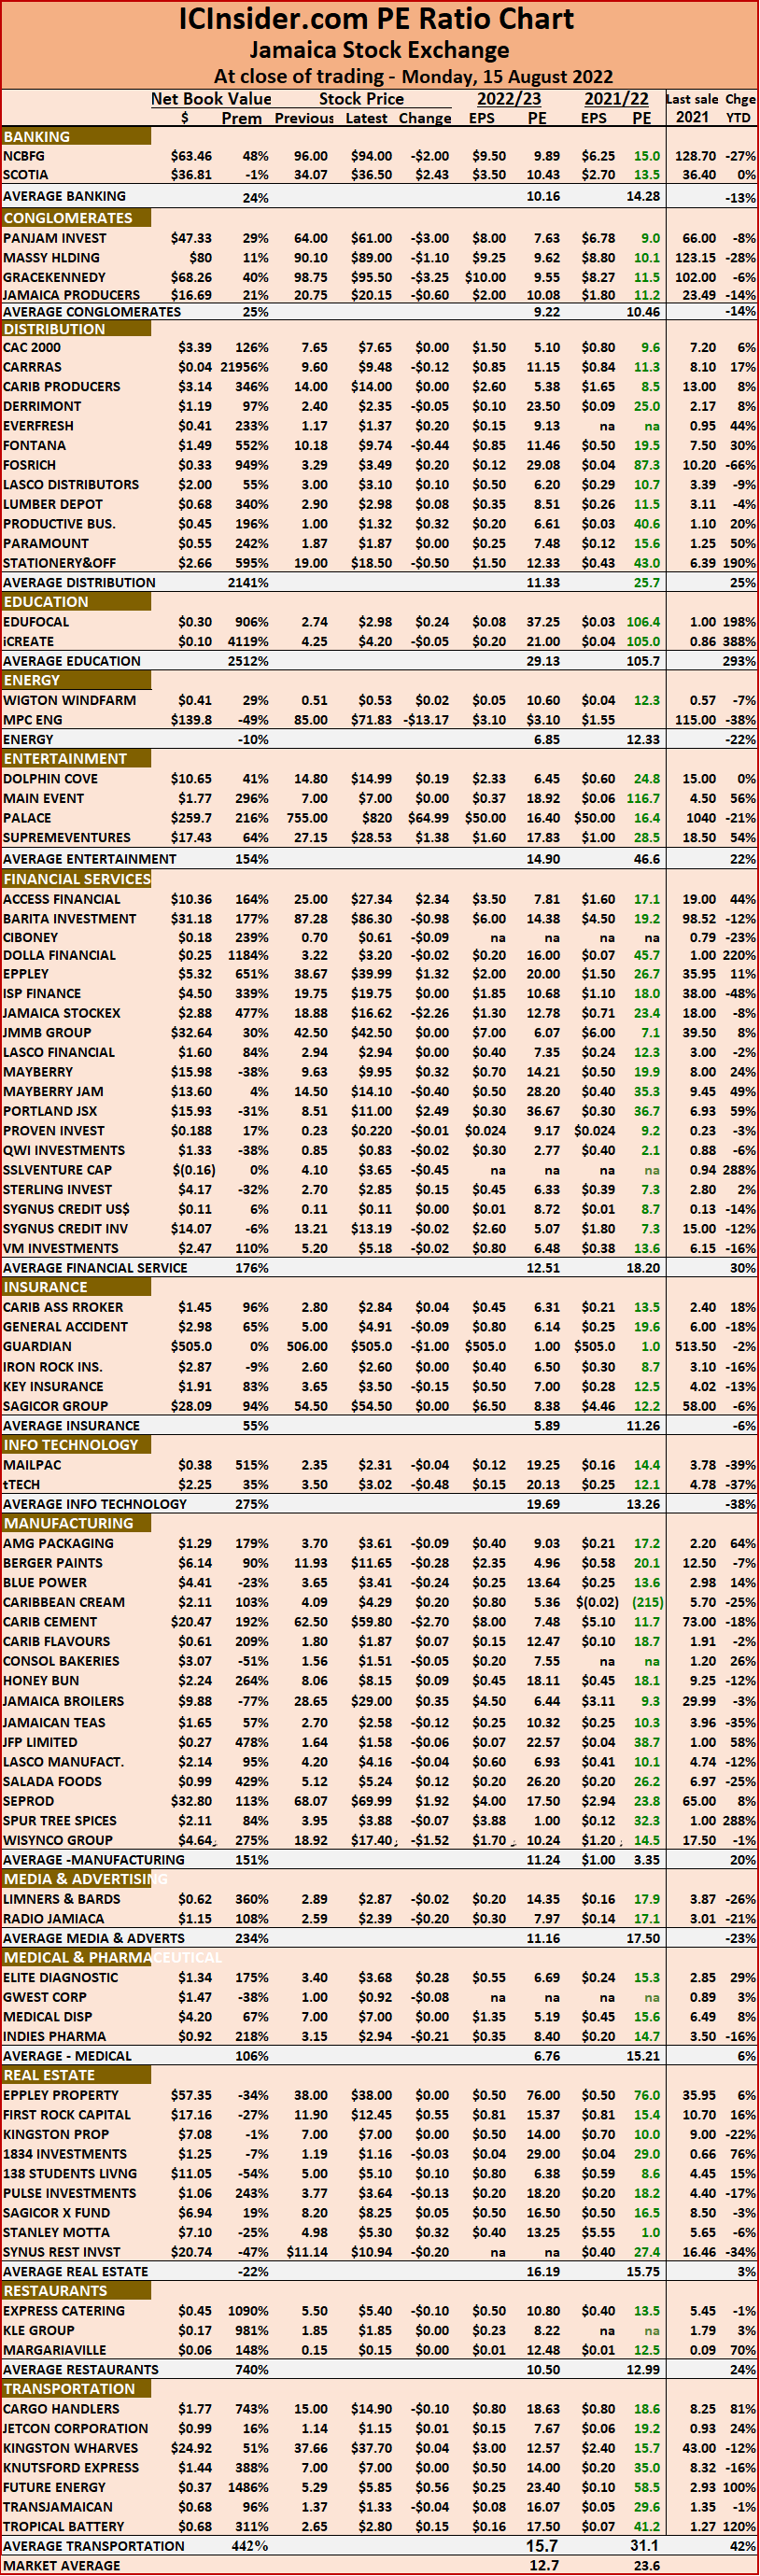 The ICInsider.com PE Ratio chart covers all ordinary shares on the Jamaica Stock Exchange. It shows companies grouped on an industry basis, allowing easy comparisons between the same sector companies and the overall market.
 The ICInsider.com PE Ratio chart covers all ordinary shares on the Jamaica Stock Exchange. It shows companies grouped on an industry basis, allowing easy comparisons between the same sector companies and the overall market.
 At the close, the All Jamaican Composite Index rose 1,075.26 points to 417,929.17, the JSE Main Index dropped 225.41 points to close at 366,974.17, the Junior Market Index rose 37.78 points to 4064.12 and the JSE USD market Index dipped 0.40 points to 194.73.
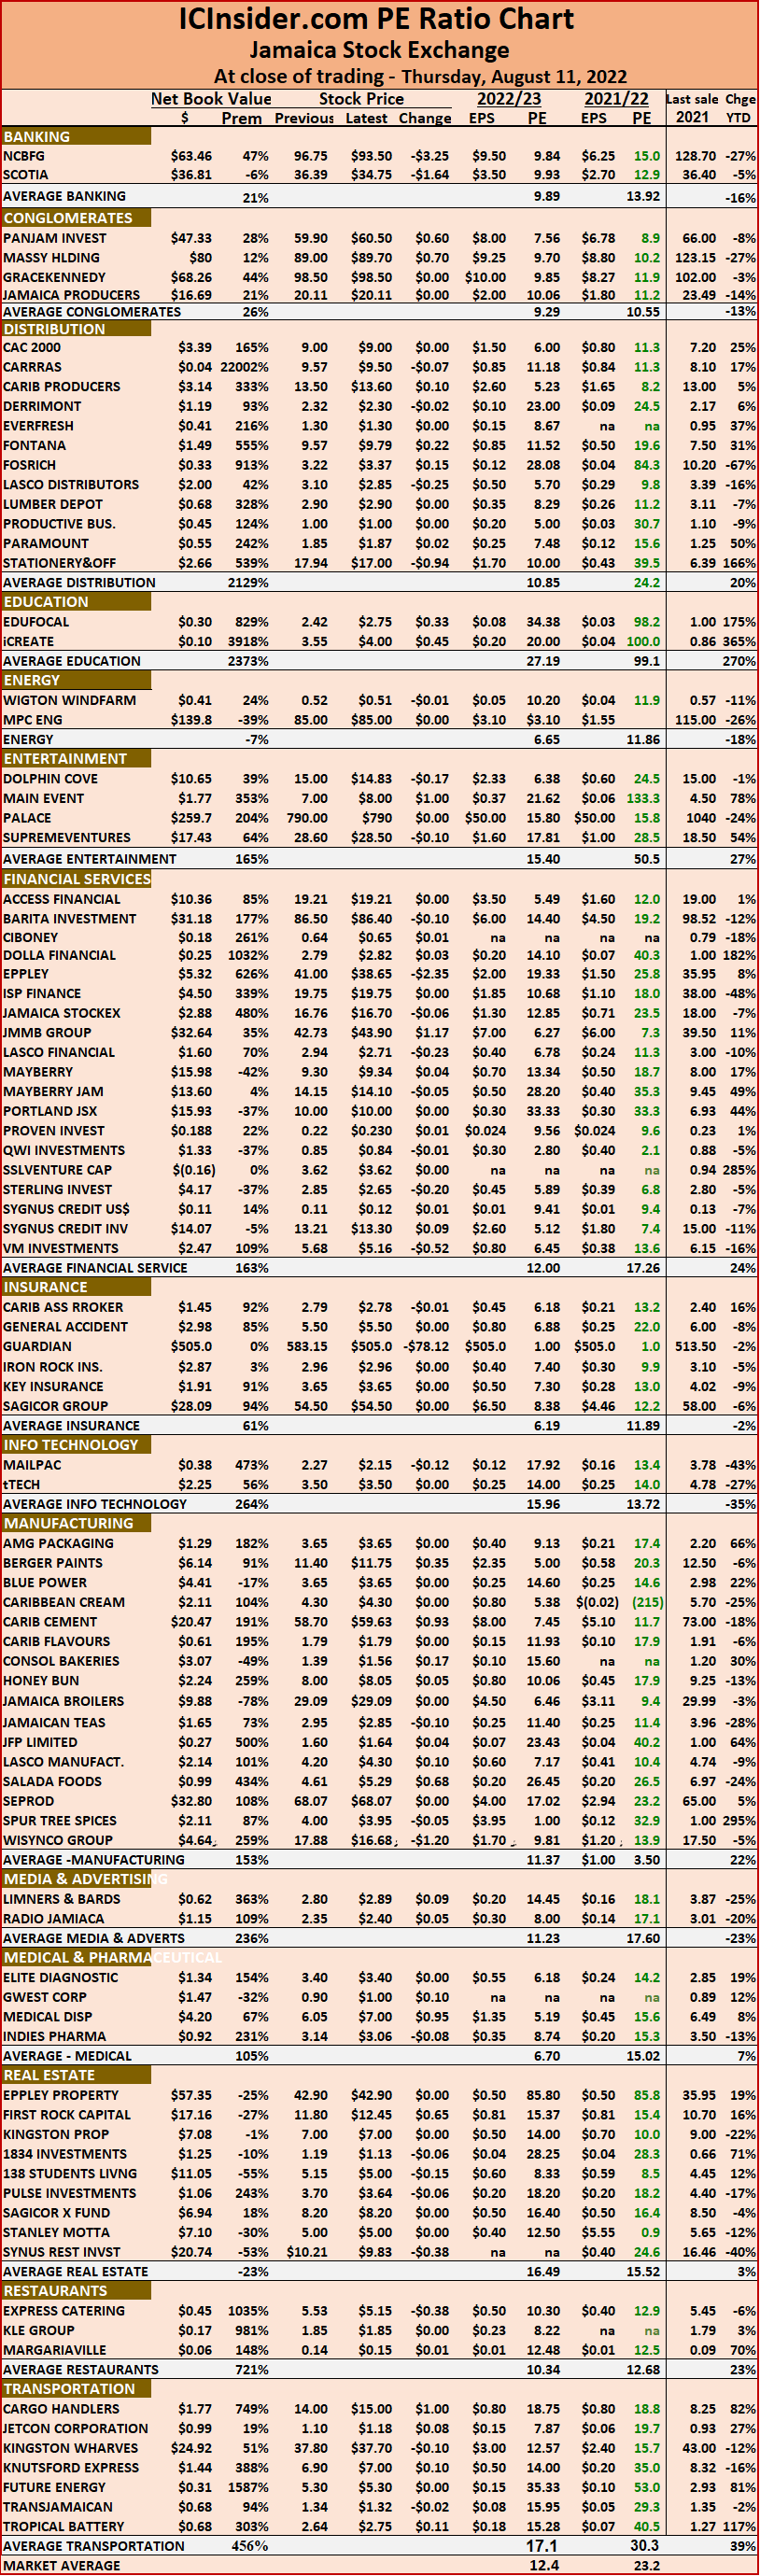 The ICInsider.com PE Ratio chart covers all ordinary shares on the Jamaica Stock Exchange. It shows companies grouped on an industry basis, allowing easy comparisons between the same sector companies and the overall market.
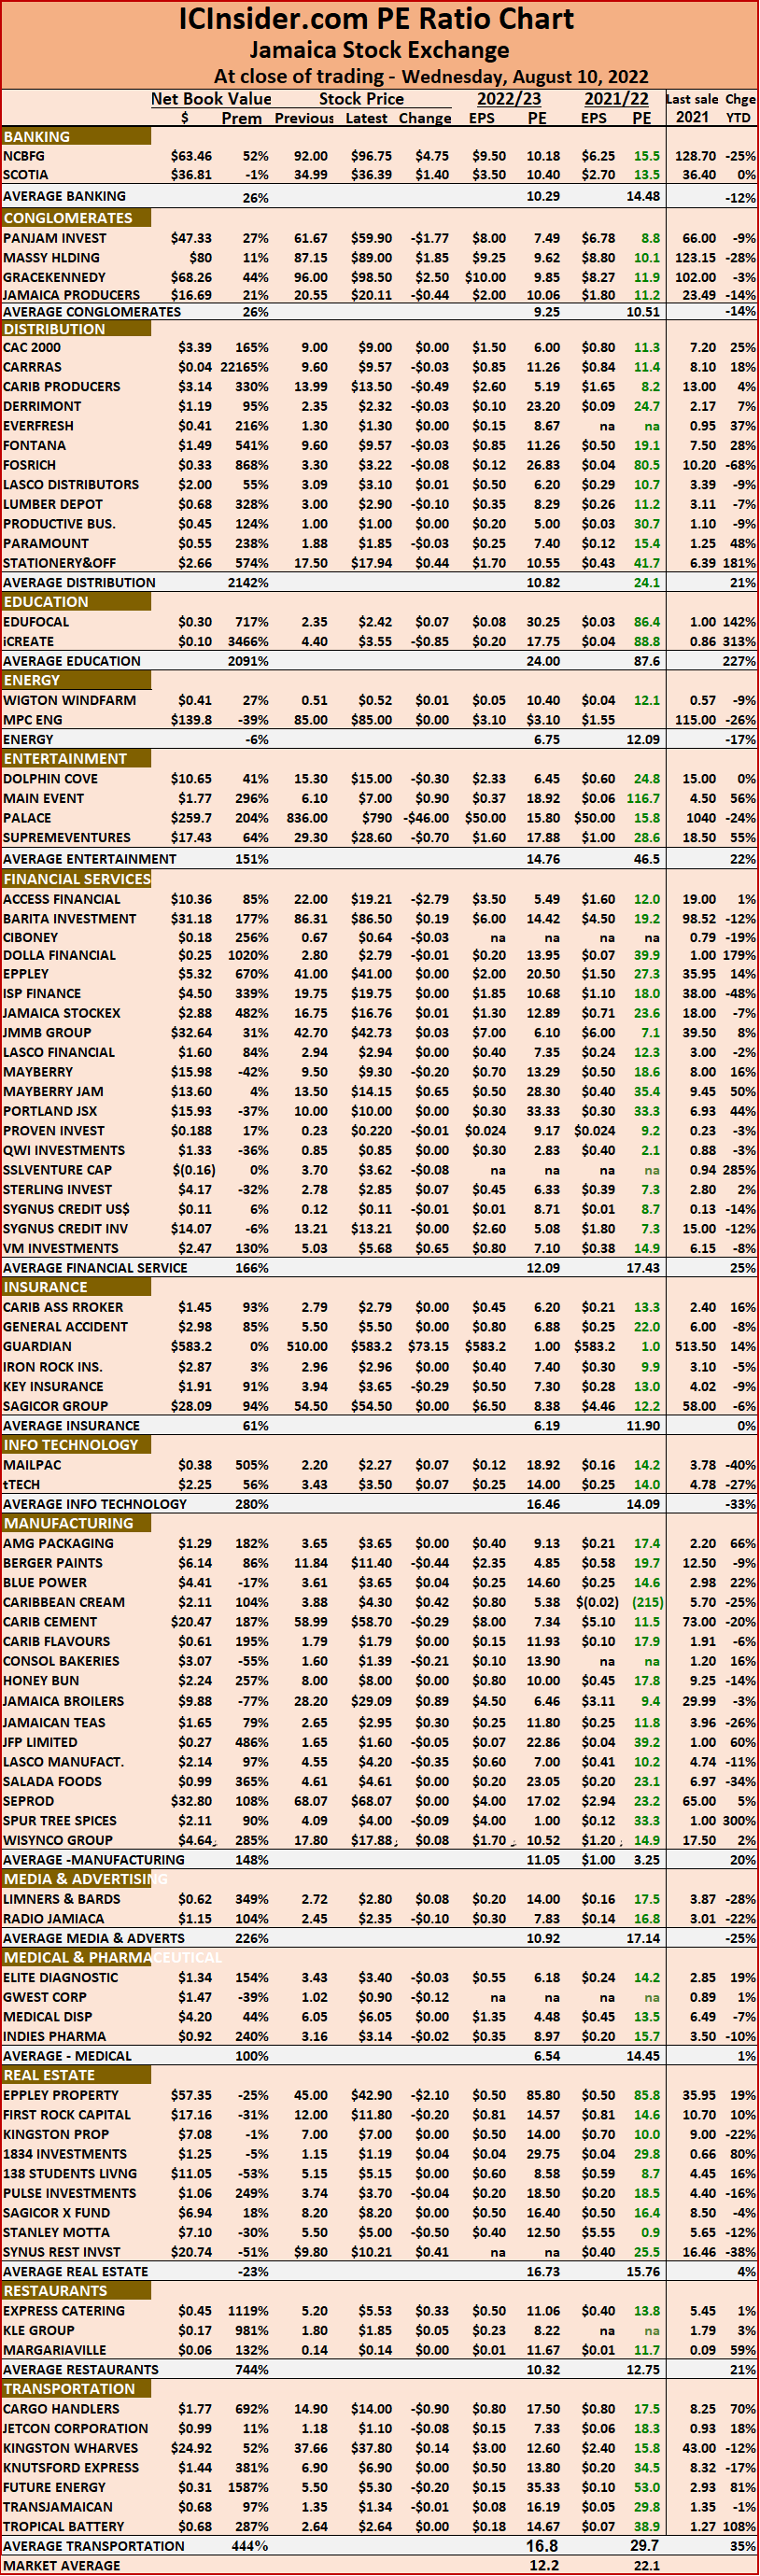 The ICInsider.com PE Ratio chart covers all ordinary shares on the Jamaica Stock Exchange. It shows companies grouped on an industry basis, allowing easy comparisons between the same sector companies and the overall market.


