Trading took a breather from mildly greater robustness on Wednesday, with action in OneonOne moderating with trading in 11.35 million shares, down from 35.5 million on Wednesday, with price coming from the record high of $2.50 on Tuesday to $1.90 as the Junior Market dropped 75.97 points to 4,229.98 after just eight Junior Market stocks rose and 24 declined.
 The JSE Combined Index a measure of the overall market, rallied 354.57 points to 375,064.09.
The All Jamaican Composite Index advanced 2,591.81 points to 410,394.66, the JSE Main Index declined 1,117.23 points to 360,448.00 and the JSE USD market Index slipped 0.35 points to 207.18.
Trading ended, with 41,790,814 shares changing hands with a value of $181 million, down from $287 million, with 62,385,335 shares traded in the overall market on the prior trading day. The JSE USD market ended with the value of stocks traded at US$8,146 from US$17,613 on Wednesday.
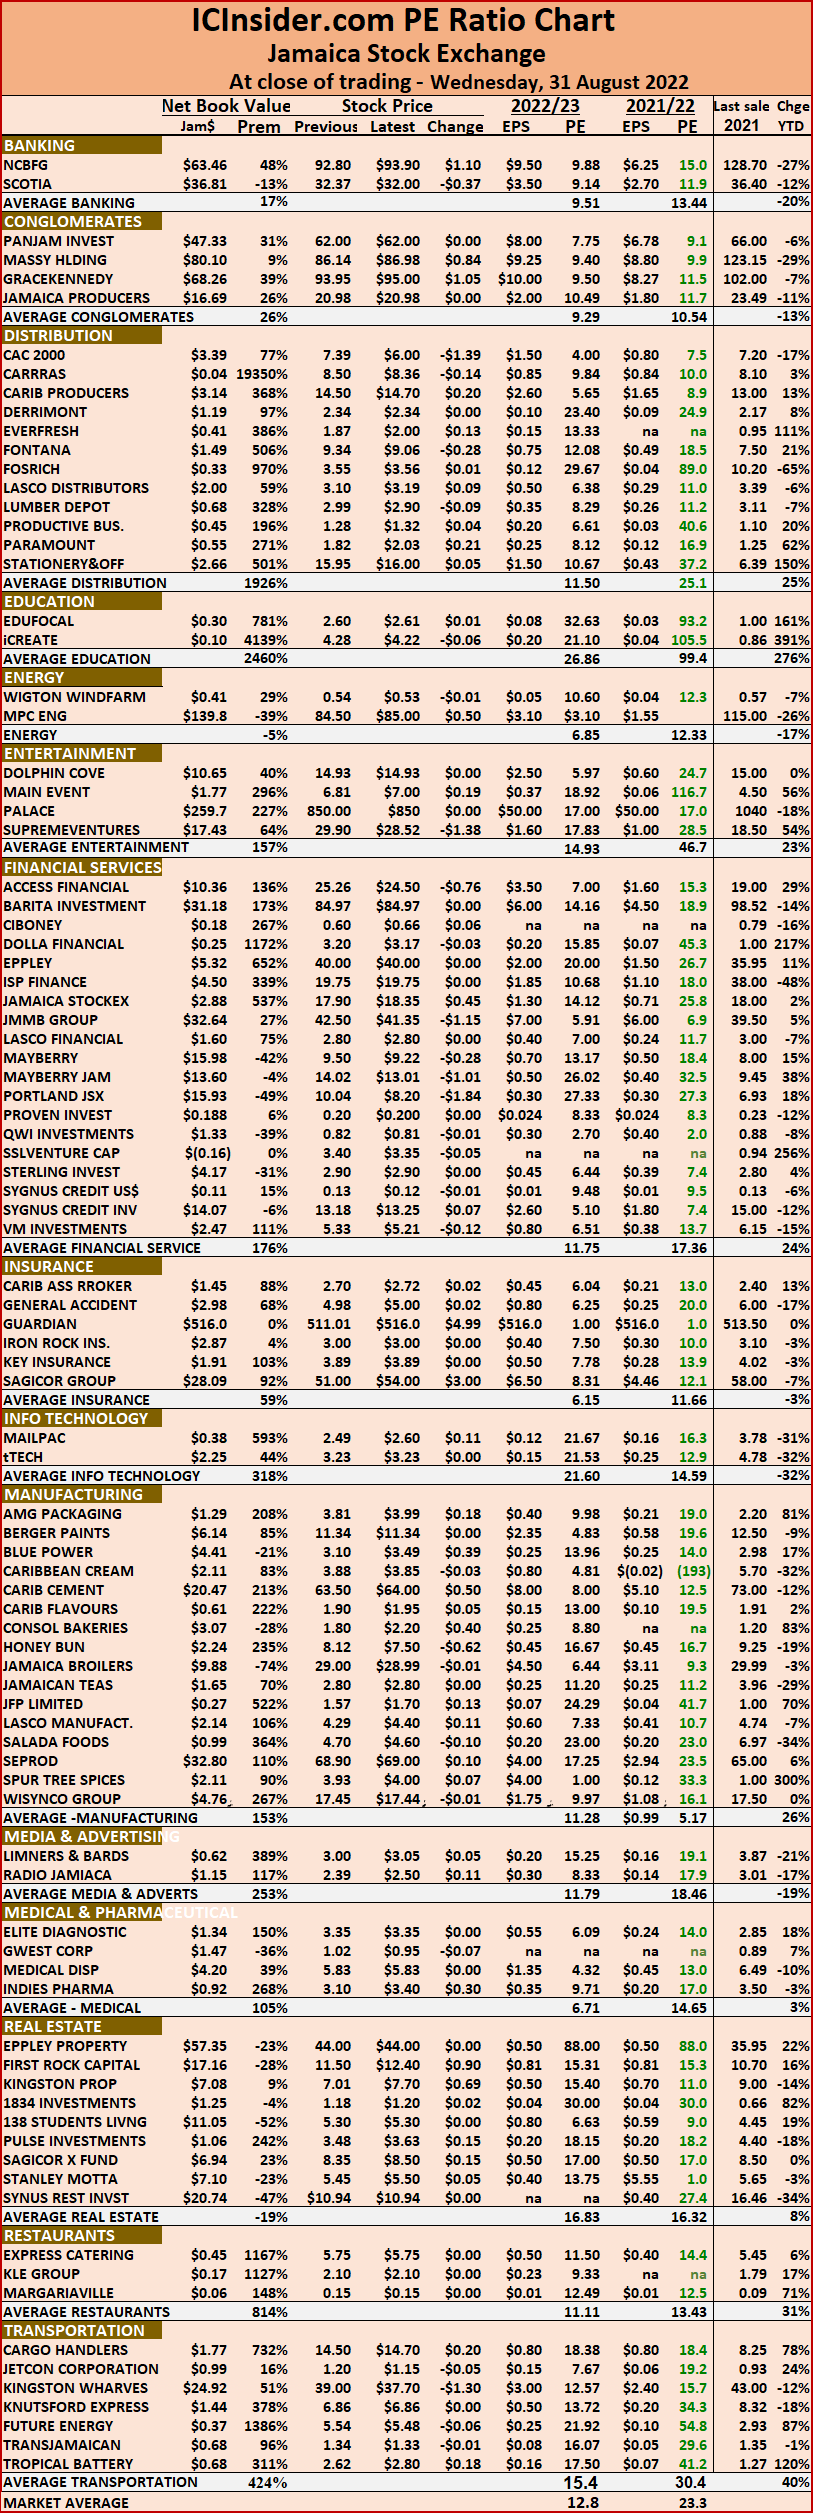
The market’s PE ratio ended at 22.7 based on 2021-22 earnings and 12.5 times those for 2022-23 at the close of trading.
Investors need pertinent information to successfully navigate many investment options in the local stock market. The ICInsider.com PE ratio chart and the more detailed daily report charts provide investors with regularly updated information to help decision-making.
Investors should use the chart to help make rational investment decisions by investing in stocks close to the average for the sector and not going too far from it unless there are compelling reasons to do so. This approach helps to remove emotions from investment decisions and put in on fundamentals while at the same time not being too far from the majority of investors. Investors who buy when the price of a stock is close to the average will find that they are not inclined to overpay for a stock.
The ICInsider.com PE Ratio chart covers all ordinary shares on the Jamaica Stock Exchange. It shows companies grouped on an industry basis, allowing easy comparisons between the same sector companies and the overall market.
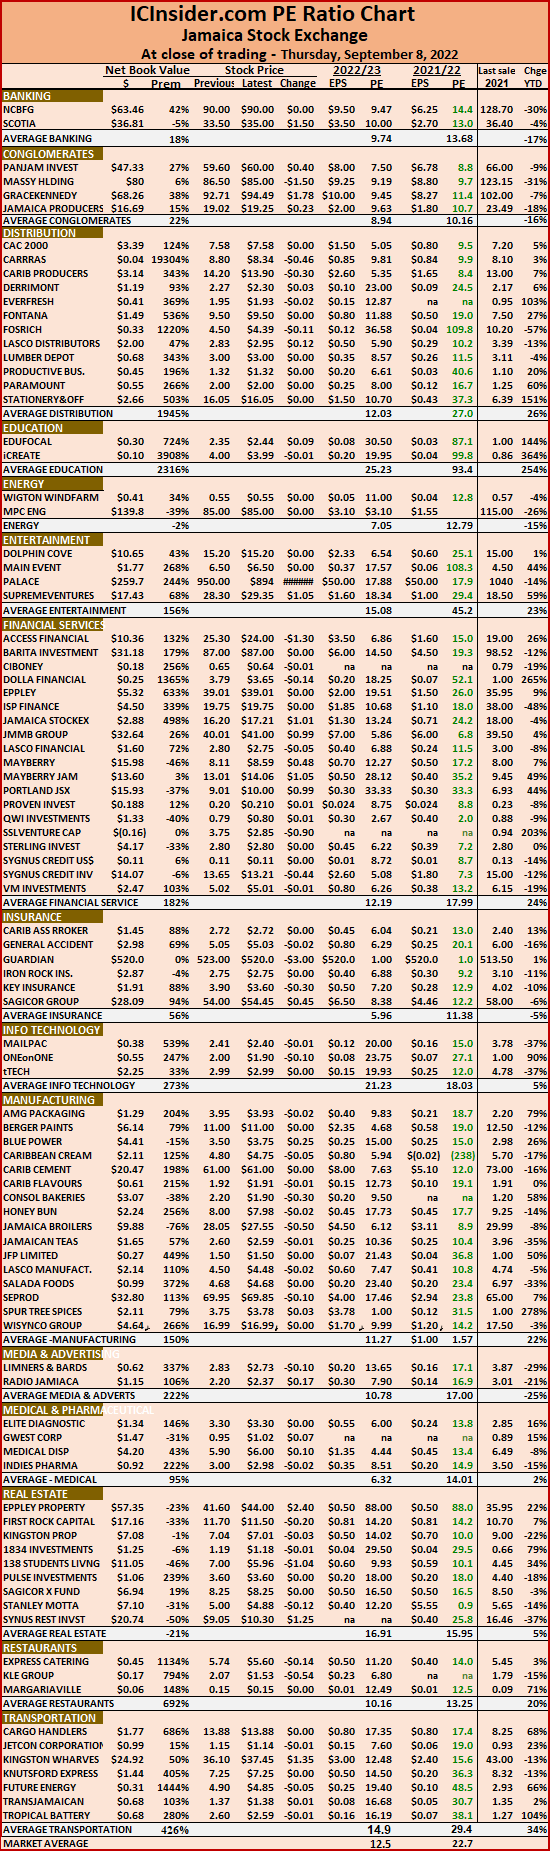 The net asset value of each company is reported as a guide to assess the value of stocks based on this measure quickly. The chart also shows daily changes in stock prices and the percentage year to date price movement based on the last traded prices. Dividends payable and yields for each company are shown in the Main and Junior Markets’ daily report charts that show the closing volume for the bids and offers.
The EPS & PE ratios are based on 2021 and 2022 actual or projected earnings, excluding major one off items. The PE Ratio is the most popular measure used to determine the value of stocks.
Action slows in OneonOne
OneonOne tops at $2.50 on Tuesday
OneonOne traded 33 million shares on Tuesday up to a record high of $2.50 and closed just below $2.40, to record a gain of 140 percent since listing last week as the Junior Market rallied a mere 4.95 to close at 4,303.70. The JSE Combined Index a measure of the overall market, declined by 848.85 points to 373,587.47.
 The All Jamaican Composite Index advanced 262.34 points to 406,712.92, the JSE Main Index declined 956.79 points to 358,151.39 and the JSE USD Market Index rose 2.48 points to 208.88.
Trading ended, with 50,676,469 shares changing hands with a value of $167.9 million, up from just $147.88 million, with 32,345,299 shares traded in the overall market on the prior trading day. The JSE USD market ended with the value of stocks traded at US$100,540 from US$31,910 on Monday.
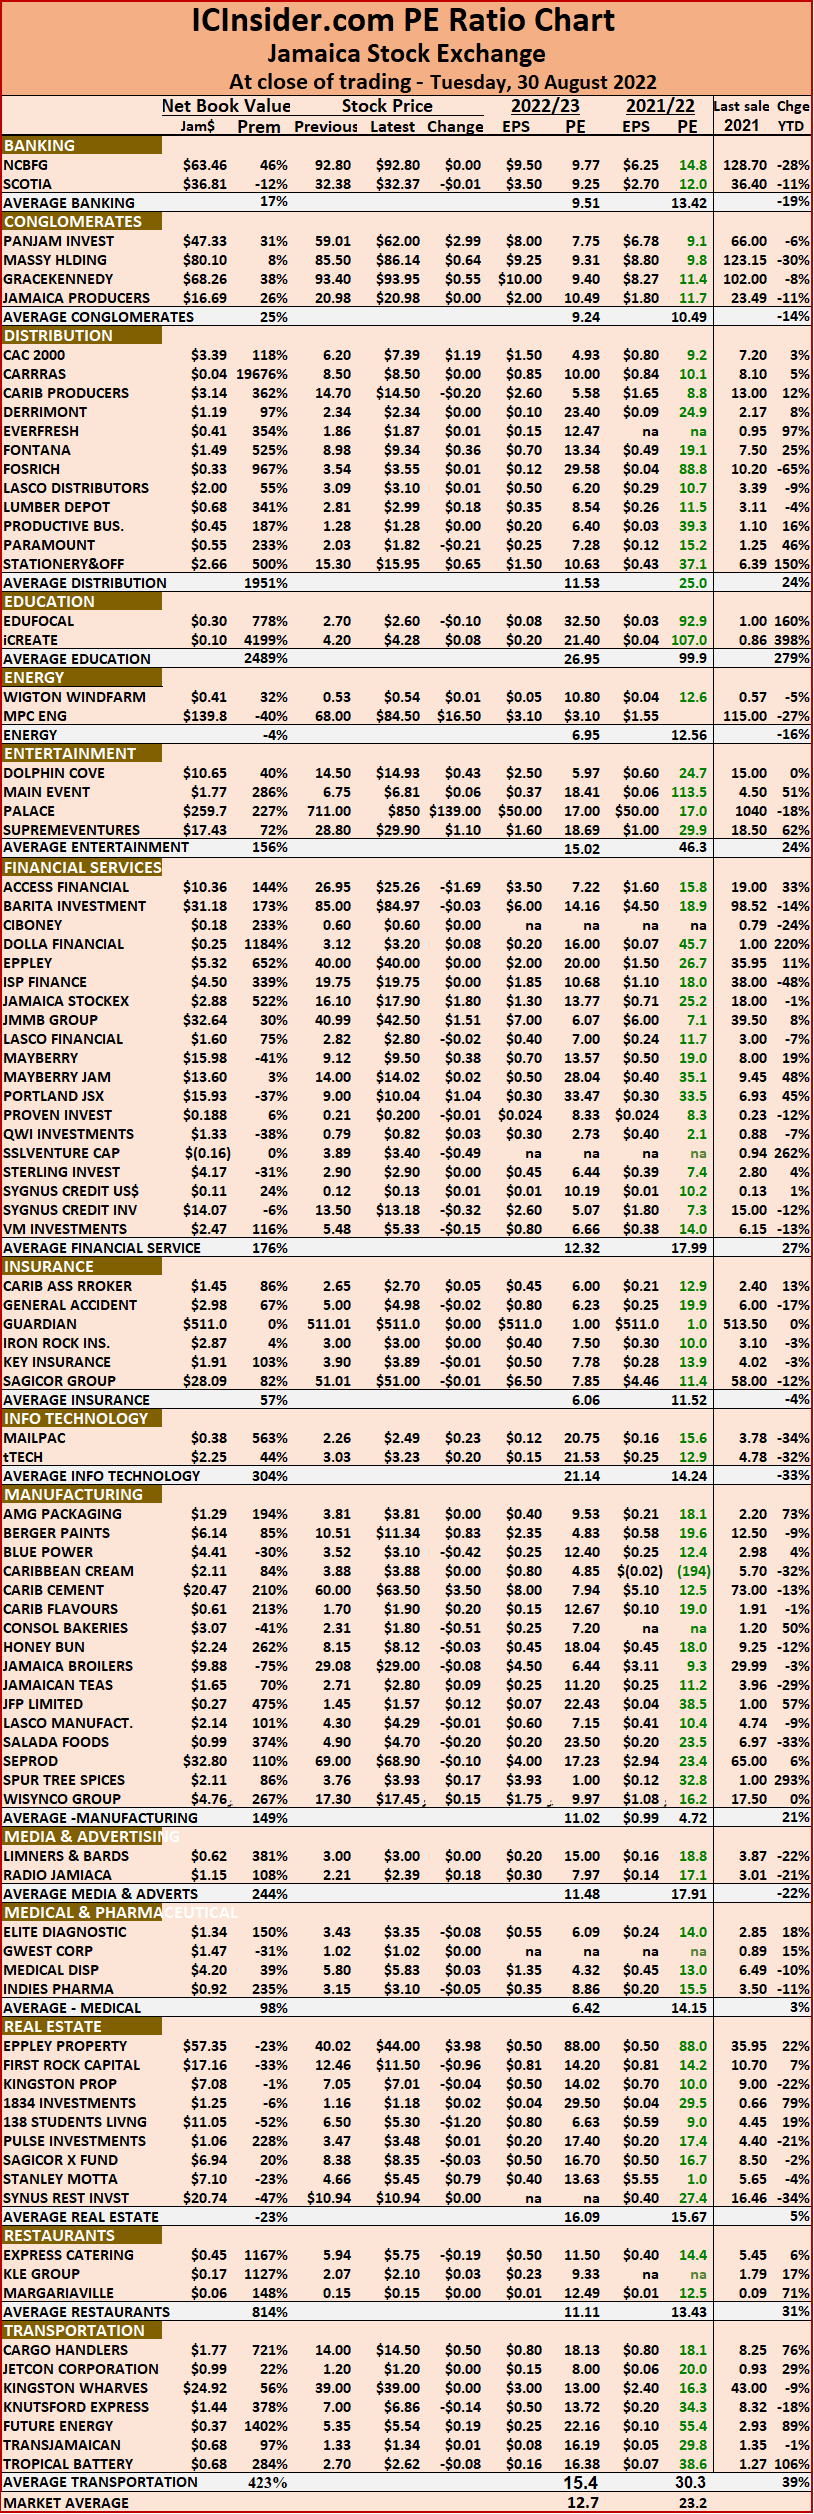
The market’s PE ratio ended at 23.1 based on 2021-22 earnings and 12.6 times those for 2022-23 at the close of trading.
Investors need pertinent information to successfully navigate many investment options in the local stock market. The ICInsider.com PE ratio chart and the more detailed daily report charts provide investors with regularly updated information to help decision-making.
Investors should use the chart to help make rational investment decisions by investing in stocks close to the average for the sector and not going too far from it unless there are compelling reasons to do so. This approach helps to remove emotions from investment decisions and put in on fundamentals while at the same time not being too far from the majority of investors. Investors who buy when the price of a stock is close to the average will find that they are not inclined to overpay for a stock.
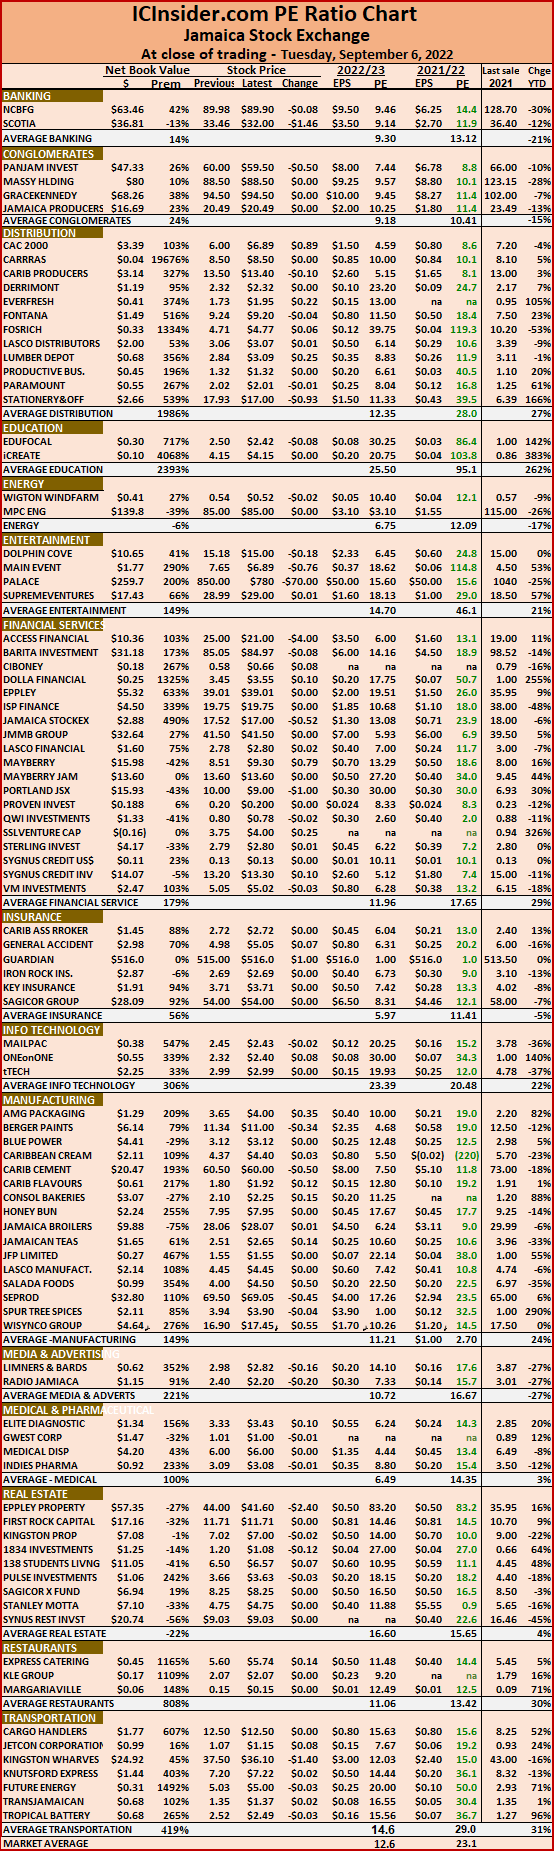 The ICInsider.com PE Ratio chart covers all ordinary shares on the Jamaica Stock Exchange. It shows companies grouped on an industry basis, allowing easy comparisons between the same sector companies and the overall market.
The net asset value of each company is reported as a guide to assess the value of stocks based on this measure quickly. The chart also shows daily changes in stock prices and the percentage year to date price movement based on the last traded prices. Dividends payable and yields for each company are shown in the Main and Junior Markets’ daily report charts that show the closing volume for the bids and offers.
The EPS & PE ratios are based on 2021 and 2022 actual or projected earnings, excluding major one off items. The PE Ratio is the most popular measure used to determine the value of stocks.
OneonOne jumps 132% in 3 trading days
Newly listed OneonOne jumps 57 cents on Monday to gain 132 percent since listing last and was one of the major contributors to the Junior Market strong rally of 82.22 n on top of the 72.17 points picked on Friday to close at 4,298.75.
Other than the Junior Market the Jamaican Stock Exchange slipped at the close of trading on Monday with the JSE Combined Index a measure of the overall market, declining by 123.56 points to 374,436.32. The All Jamaican Composite Index dipped 2,145.65 points to 406,450.58, the JSE Main Index declined 930.64 points to 359,108.18 and the JSE USD market Index dipped 0.51 points to 206.50
Trading ended, with 32,345,299 shares changing hands with a value of $147.88 million, up from just $140 million, with 29,436,283 shares traded in the overall market on the prior trading day. The JSE USD market ended with the value of stocks traded at US$31,910 from US$16,693 on Friday.
The market’s PE ratio ended at 22.8 based on 2021-22 earnings and 12.2 times those for 2022-23 at the close of trading.
Investors need pertinent information to successfully navigate many investment options in the stock market. The ICInsider.com PE ratio chart and the more detailed daily report charts provide investors with regularly updated information to help decision-making.
Investors should use the chart to help make rational investment decisions by investing in stocks close to the average for the sector and not going too far from it unless there are compelling reasons to do so. This approach helps to remove emotions from investment decisions and put in on fundamentals while at the same time not being too far from the majority of investors. Investors who buy when the price of a stock is close to the average will find that they are not inclined to overpay for a stock.
 The ICInsider.com PE Ratio chart covers all ordinary shares on the Jamaica Stock Exchange. It shows companies grouped on an industry basis, allowing easy comparisons between the same sector companies and the overall market.
The net asset value of each company is reported as a guide to assess the value of stocks based on this measure quickly. The chart also shows daily changes in stock prices and the percentage year to date price movement based on the last traded prices. Dividends payable and yields for each company are shown in the Main and Junior Markets’ daily report charts that show the closing volume for the bids and offers.
The EPS & PE ratios are based on 2021 and 2022 actual or projected earnings, excluding major one off items. The PE Ratio is the most popular measure used to determine the value of stocks.
ONEonONE up 32% on debut
The Jamaica Stock exchange welcomed its 100 company listing on Thursday, with OneOnOne Educational listed on the Junior Market with the price rising 32 percent on its opening day to close at $1.32 the maximum permitted for the day but the stock closed with strong demand at the closing price and little selling under $2.

Ricardo Allen CEO of One to One
At the close of trading, the JSE Combined Index, a measure of the overall market, rose 1,153.03 points to 374,578.03. The All Jamaican Composite Index popped 561.84 points to 408,944.09, the JSE Main Index rallied 1,464.43 points to 360,759.12, the Junior Market Index slipped 23.69 points to 4,144.36 and the JSE USD Market Index rose 8.22 points to 213.78.
Trading ended with 50,351,650 shares changing hands with a value of $504.95 million, versus $1.1 billion, with 96,932,851 shares traded in the overall market on Wednesday. The JSE USD market ended with the value of stocks traded at US$24,695 and US$6,401 on the previous trading day.
The market’s PE ratio ended at 23.2 based on 2021-22 earnings and 12.4 times those for 2022-23 at the close of trading.
Investors need pertinent information to successfully navigate many investment options in the local stock market. The ICInsider.com PE ratio chart and the more detailed daily report charts provide investors with regularly updated information to help decision-making.
Investors should use the chart to help make rational investment decisions by investing in stocks close to the average for the sector and not going too far from it unless there are compelling reasons to do so. This approach helps to remove emotions from investment decisions and put in on fundamentals while at the same time not being too far from the majority of investors. Investors who buy when the price of a stock is close to the average will find that they are not inclined to overpay for a stock.
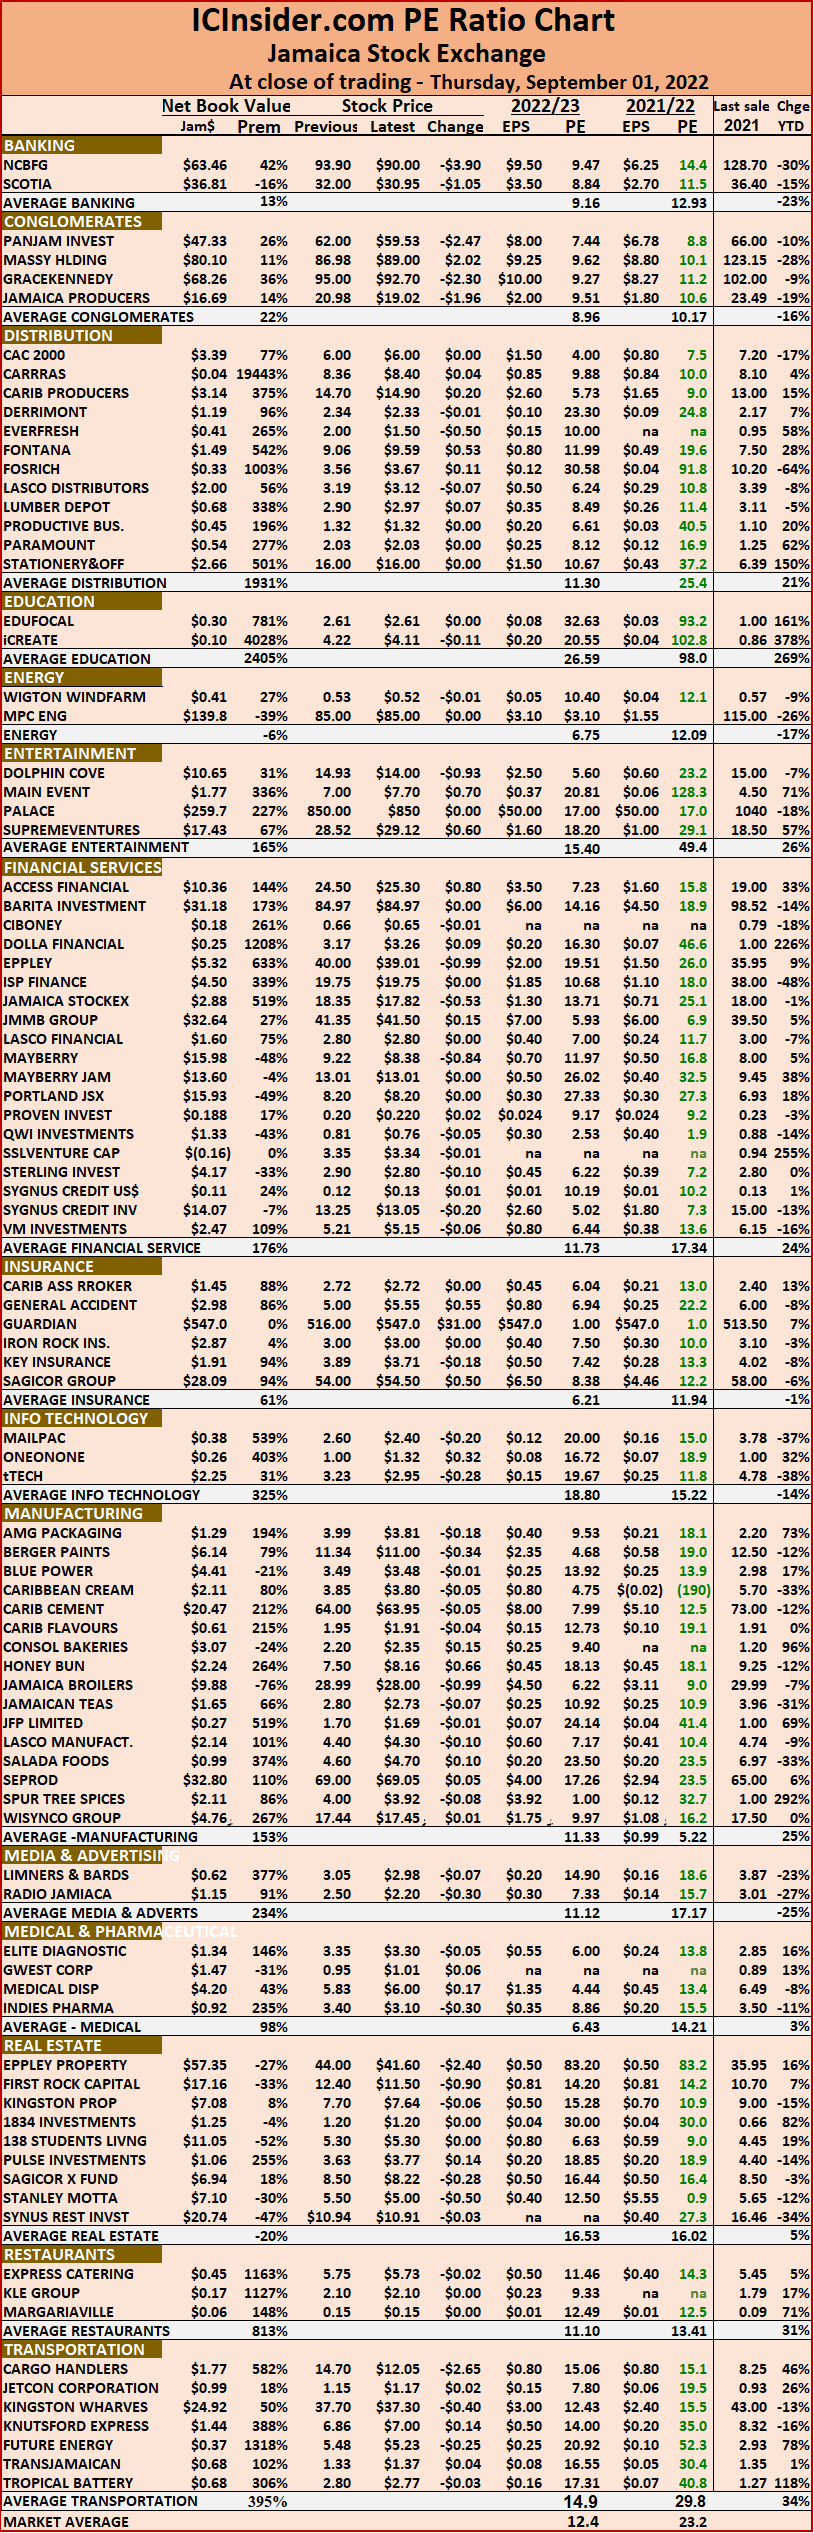 The ICInsider.com PE Ratio chart covers all ordinary shares on the Jamaica Stock Exchange. It shows companies grouped on an industry basis, allowing easy comparisons between the same sector companies and the overall market.
The net asset value of each company is reported as a guide to assess the value of stocks based on this measure quickly. The chart also shows daily changes in stock prices and the percentage year to date price movement based on the last traded prices. Dividends payable and yields for each company are shown in the Main and Junior Markets’ daily report charts that show the closing volume for the bids and offers.
The EPS & PE ratios are based on 2021 and 2022 actual or projected earnings, excluding major one off items. The PE Ratio is the most popular measure used to determine the value of stocks.
Mixed JSE trading on Wednesday
The Main and Junior Market slipped at the close of trading but the JSE USD market inched higher on Wednesday on the Jamaica Stock Exchange to close out August, with losses to the market indices, with the markets closing lower for the month after trading ended with a bump in the volume of stocks trading that more than doubled Tuesday’s trades, with the value rising to more than $1 billion dollars.
 At the close of the market, the JSE Combined Index, a measure of the overall market, declined 462.81 points to 373,425.00, the All Jamaican Composite Index popped 146.95 points to 408,382.25, the JSE Main Index dipped 474.78 points to 359,294.69, the Junior Market Index slipped 2.10 points to 4,168.05 and the JSE USD Market Index rose 1.80 points to 205.56.
Trading ended with 96,932,851 shares changing hands with the value at $1.11 billion, compared to $192.76 million, with 41,625,695 shares traded in the overall market on Tuesday. The JSE USD market ended with the value of stocks traded at US$6,401 and US$41,599 on the previous trading day.
The market’s PE ratio ended at 23.3 based on 2021-22 earnings and 12.8 times those for 2022-23 at the close of trading.
Investors need pertinent information to successfully navigate many investment options in the local stock market. The ICInsider.com PE ratio chart and the more detailed daily report charts provide investors with regularly updated information to help decision-making.
Investors should use the chart to help make rational investment decisions by investing in stocks close to the average for the sector and not going too far from it unless there are compelling reasons to do so. This approach helps to remove emotions from investment decisions and put in on fundamentals while at the same time not being too far from the majority of investors. Investors who buy when the price of a stock is close to the average will find that they are not inclined to overpay for a stock.
The ICInsider.com PE Ratio chart covers all ordinary shares on the Jamaica Stock Exchange. It shows companies grouped on an industry basis, allowing easy comparisons between the same sector companies and the overall market.
 The net asset value of each company is reported as a guide to assess the value of stocks based on this measure quickly. The chart also shows daily changes in stock prices and the percentage year to date price movement based on the last traded prices. Dividends payable and yields for each company are shown in the Main and Junior Markets’ daily report charts that show the closing volume for the bids and offers.
The EPS & PE ratios are based on 2021 and 2022 actual or projected earnings, excluding major one off items. The PE Ratio is the most popular measure used to determine the value of stocks.
JSE Markets inch higher Tuesday
Main Market and Junior Market stocks squeezed out modest gains in trading chilled on Tuesday on the Jamaica Stock Exchange but the JSE USD market fell at the close of the market and ended with the volume traded rising over that on Monday but a much lower value and resulted in the JSE Combined Index a measure of the overall market, rising 663.44 points to 373,887.81.
 The All Jamaican Composite Index rose 528.75 points to 408,235.30, the JSE Main Index rallied 622.71 points to 359,769.47, the Junior Market Index popped 9.03 points to 4,170.15 and the JSE USD market Index slipped 10.38 points to 203.76.
Trading ended with 41,625,695 shares changing hands with the value at $192.76 million, compared to $1.126 billion, with 33,811,840 shares traded in the overall market on Monday. The JSE USD market ended with the value of stocks traded at US$41,599 up from US$9,558 on the previous day. The market’s PE ratio ended at 23.2 based on 2021-22 earnings and 12.7 times those for 2022-23 at the close of trading.
Investors need pertinent information to successfully navigate many investment options in the local stock market. The ICInsider.com PE ratio chart and the more detailed daily report charts provide investors with regularly updated information to help decision-making.
Investors should use the chart to help make rational investment decisions by investing in stocks close to the average for the sector and not going too far from it unless there are compelling reasons to do so. This approach helps to remove emotions from investment decisions and put in on fundamentals while at the same time not being too far from the majority of investors. Investors who buy when the price of a stock is close to the average will find that they are not inclined to overpay for a stock.
 The ICInsider.com PE Ratio chart covers all ordinary shares on the Jamaica Stock Exchange. It shows companies grouped on an industry basis, allowing easy comparisons between the same sector companies and the overall market.
The net asset value of each company is reported as a guide to assess the value of stocks based on this measure quickly. The chart also shows daily changes in stock prices and the percentage year to date price movement based on the last traded prices. Dividends payable and yields for each company are shown in the Main and Junior Markets’ daily report charts that show the closing volume for the bids and offers.
The EPS & PE ratios are based on 2021 and 2022 actual or projected earnings, excluding major one off items. The PE Ratio is the most popular measure used to determine the value of stocks.
Pull back for JSE on Monday
Trading chilled on Monday on the Jamaica Stock Exchange and ended with the volume and value of stocks traded rising over that on Friday but with slippage in the main and Junior markets, resulting in the JSE Combined Index a measure of the overall market, dropping 3,242.85 points to 373,224.37.
 The All Jamaican Composite Index fell 4,970.96 points to 407,706.55, the JSE Main Index dropped 3,398.45 points to 359,146.76, the Junior Market Index slipped 7.26 points to 4,161.12 and the JSE USD market Index rallied 0.61 points to 214.14.
Trading ended with 33,811,840 shares changing hands with the value at $1.126 billion, compared to $213 million from 28,384,275 shares traded in the overall market on Friday. The JSE USD market ended with the value of stocks traded at US$9,558 versus US$13,332 on the previous day of trading. The market’s PE ratio ended at 23 based on 2021-22 earnings and 12.5 times those for 2022-23 at the close of trading.
Investors need pertinent information to successfully navigate many investment options in the local stock market. The ICInsider.com PE ratio chart and the more detailed daily report charts provide investors with regularly updated information to help decision-making.
Investors should use the chart to help make rational investment decisions by investing in stocks close to the average for the sector and not going too far from it unless there are compelling reasons to do so. This approach helps to remove emotions from investment decisions and put in on fundamentals while at the same time not being too far from the majority of investors. Investors who buy when the price of a stock is close to the average will find that they are not inclined to overpay for a stock.
The ICInsider.com PE Ratio chart covers all ordinary shares on the Jamaica Stock Exchange. It shows companies grouped on an industry basis, allowing easy comparisons between the same sector companies and the overall market.
 The net asset value of each company is reported as a guide to assess the value of stocks based on this measure quickly. The chart also shows daily changes in stock prices and the percentage year to date price movement based on the last traded prices. Dividends payable and yields for each company are shown in the Main and Junior Markets’ daily report charts that show the closing volume for the bids and offers.
The EPS & PE ratios are based on 2021 and 2022 actual or projected earnings, excluding major one off items. The PE Ratio is the most popular measure used to determine the value of stocks.
Solid performance for JSE market on Friday
The Jamaica Stock Exchange enjoyed another day of solid gains at the close of trading on Friday with reports indicating the refunds for the recent ONEonONE IPO have started leading to increased trading with all markets recording sizable gains, resulting in the JSE Combined Index a measure of the overall market, jumping 2,335.46 points to 376,467.22.
 The All Jamaican Composite Index rose 2,977.43 points to 412,677.51, the JSE Main Index climbed 1,783.83 points to 362,545.21, the Junior Market Index jumped 74.23 points to 4,168.38 and the JSE USD market Index rallied 7.51 points to 213.53.
Trading ended with 28,384,275 shares changing hands with the value at $213 million, compared to $108.5 million, with 20,473,076 shares traded in the overall market on the prior trading day. The JSE USD market ended with the value of stocks traded at US$13,332 versus US$59,481 on the previous day of trading.
The market’s PE ratio ended at 23 based on 2021-22 earnings and 12.5 times those for 2022-23 at the close of trading.
Investors need pertinent information to successfully navigate many investment options in the local stock market. The ICInsider.com PE ratio chart and the more detailed daily report charts provide investors with regularly updated information to help decision-making.
Investors should use the chart to help make rational investment decisions by investing in stocks close to the average for the sector and not going too far from it unless there are compelling reasons to do so. This approach helps to remove emotions from investment decisions and put in on fundamentals while at the same time not being too far from the majority of investors. Investors who buy when the price of a stock is close to the average will find that they are not inclined to overpay for a stock.
The ICInsider.com PE Ratio chart covers all ordinary shares on the Jamaica Stock Exchange. It shows companies grouped on an industry basis, allowing easy comparisons between the same sector companies and the overall market.
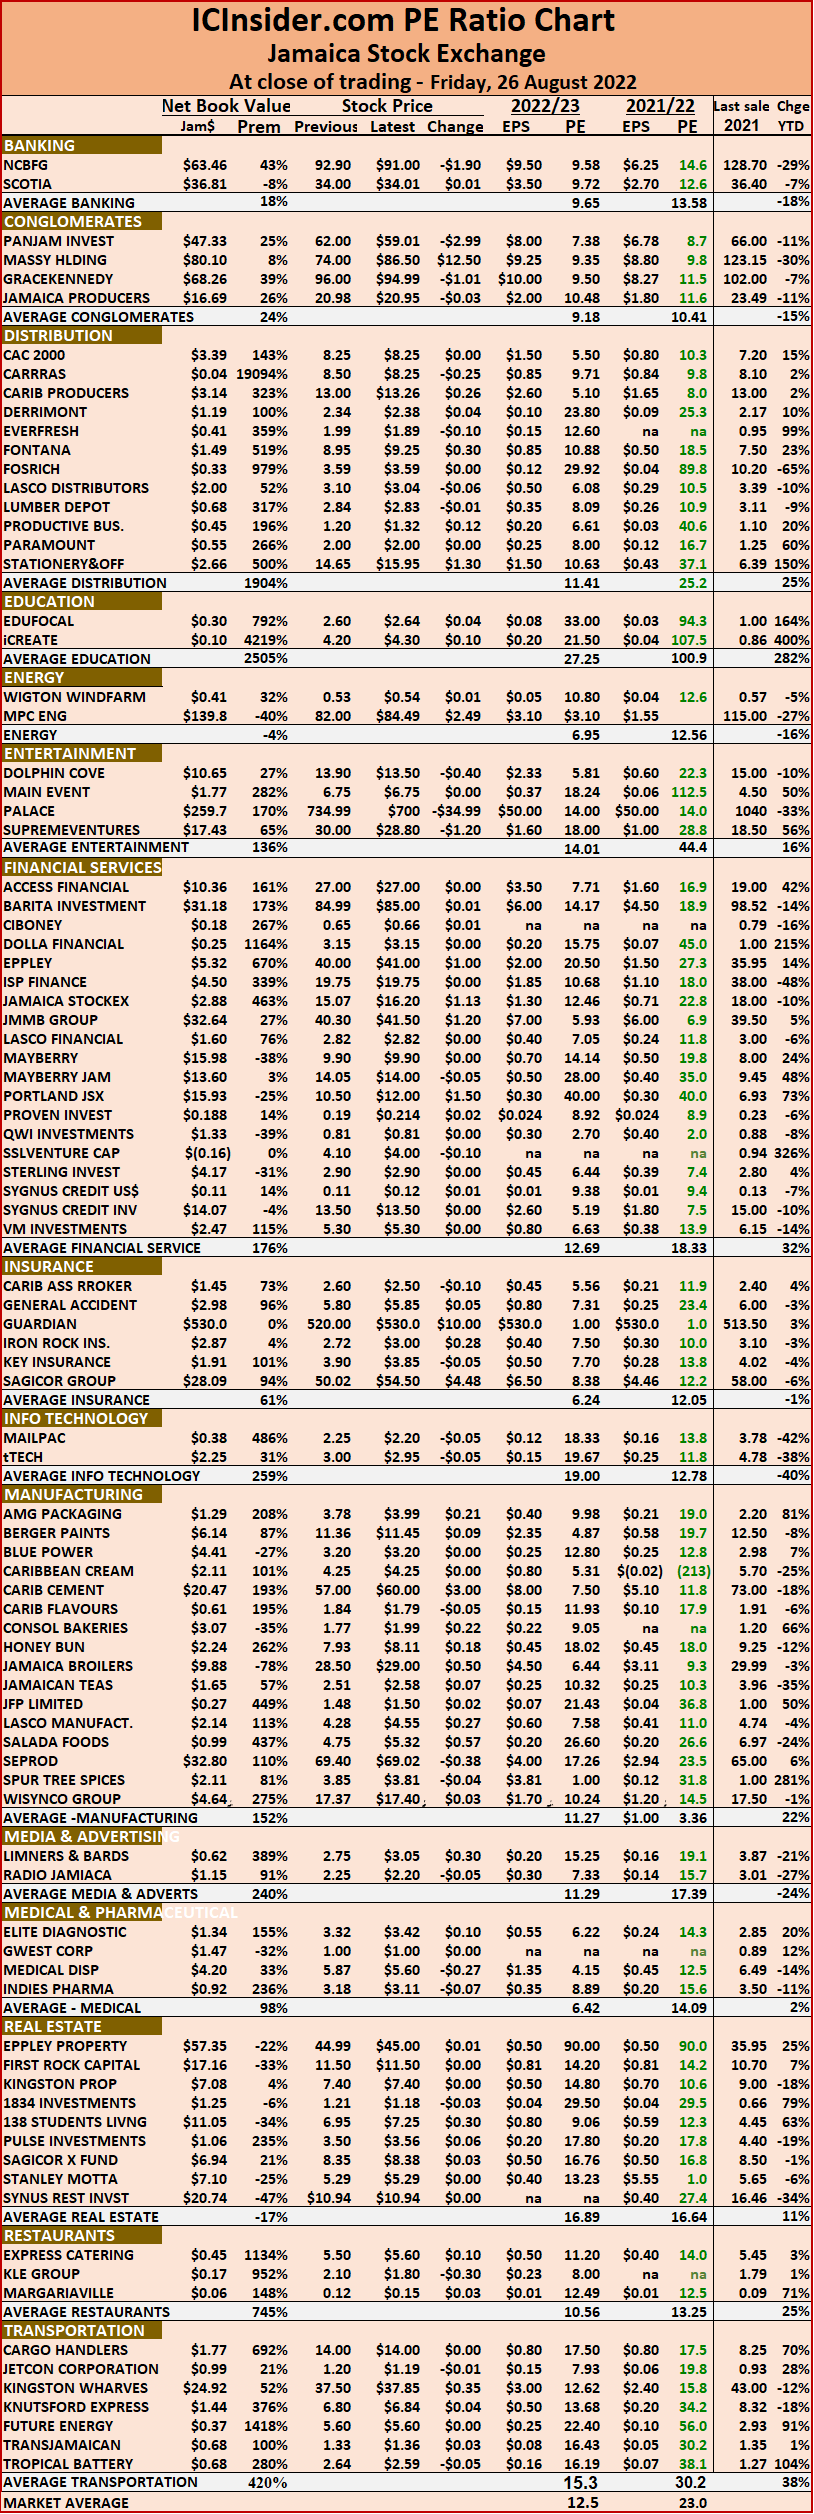 The net asset value of each company is reported as a guide to assess the value of stocks based on this measure quickly. The chart also shows daily changes in stock prices and the percentage year to date price movement based on the last traded prices. Dividends payable and yields for each company are shown in the Main and Junior Markets’ daily report charts that show the closing volume for the bids and offers.
The EPS & PE ratios are based on 2021 and 2022 actual or projected earnings, excluding major one off items. The PE Ratio is the most popular measure used to determine the value of stocks.
All JSE markets reverse declines
Investors were less bearish in trading on the Jamaica Stock Exchange on Thursday with all markets recording gains at the close, with a moderate rise in the volume and value of trading, resulting in the JSE Combined Index a measure of the overall market, jumping 7,085.72 points to 374,131.76.
 The All Jamaican Composite Index rose 5,021.15 points to 409,700.08, the JSE Main Index surged 7,542.39 points to 360,761.38, the Junior Market Index popped 3.73points to 4,094.15 and the JSE USD market Index rallied 9.00 points to 206.02.
Trading ended with 20,473,076 shares changing hands with the value at $108.5 million, from $98.7 million, with 22,376,199 shares traded in the overall market on the prior trading day. The JSE USD market ended with the value of stocks traded at US$59,481 versus US$242,568 on the previous day of trading.
The market’s PE ratio ended at 22.6 based on 2021-22 earnings and 12.4 times those for 2022-23 at the close of trading.
Investors need pertinent information to successfully navigate many investment options in the local stock market. The ICInsider.com PE ratio chart and the more detailed daily report charts provide investors with regularly updated information to help decision-making.
Investors should use the chart to help make rational investment decisions by investing in stocks close to the average for the sector and not going too far from it unless there are compelling reasons to do so. This approach helps to remove emotions from investment decisions and put in on fundamentals while at the same time not being too far from the majority of investors. Investors who buy when the price of a stock is close to the average will find that they are not inclined to overpay for a stock.
 The ICInsider.com PE Ratio chart covers all ordinary shares on the Jamaica Stock Exchange. It shows companies grouped on an industry basis, allowing easy comparisons between the same sector companies and the overall market.
The net asset value of each company is reported as a guide to assess the value of stocks based on this measure quickly. The chart also shows daily changes in stock prices and the percentage year to date price movement based on the last traded prices. Dividends payable and yields for each company are shown in the Main and Junior Markets’ daily report charts that show the closing volume for the bids and offers.
The EPS & PE ratios are based on 2021 and 2022 actual or projected earnings, excluding major one off items. The PE Ratio is the most popular measure used to determine the value of stocks.
More decline for JSE stocks
There were more declines for Jamaica Stock Exchange stocks on Wednesday with all markets recording slippage in the indices, following a reduction in the volume and value of stocks traded, resulting in the JSE Combined Index a measure of the overall market, diving 4,559.73 points to close at 371,605.77.
 The All Jamaican Composite Index dropped 2,743.15 points to 404,678.93, the JSE Main Index climbed 4,595.49 points to 353,218.99, the Junior Market Index dipped 29.23 points to 4,090.42 and the JSE USD market Index slipped 5.30 points to 197.02.
Trading ended with 22,376,199 shares with the value jumping to $98.7 million, from $158.2 million, with 18,943,371 shares traded in the overall market on the prior trading day. The JSE USD market ended with the value of stocks traded at US$242,568 versus US$98,429 on the previous day of trading.
The market’s PE ratio ended at 22.3 based on 2021-22 earnings and 12.2 times those for 2022-23 at the close of trading.
Investors need pertinent information to successfully navigate many investment options in the local stock market. The ICInsider.com PE ratio chart and the more detailed daily report charts provide investors with regularly updated information to help decision-making.
Investors should use the chart to help make rational investment decisions by investing in stocks close to the average for the sector and not going too far from it unless there are compelling reasons to do so. This approach helps to remove emotions from investment decisions and put in on fundamentals while at the same time not being too far from the majority of investors. Investors who buy when the price of a stock is close to the average will find that they are not inclined to overpay for a stock.
 The ICInsider.com PE Ratio chart covers all ordinary shares on the Jamaica Stock Exchange. It shows companies grouped on an industry basis, allowing easy comparisons between the same sector companies and the overall market.
The net asset value of each company is reported as a guide to assess the value of stocks based on this measure quickly. The chart also shows daily changes in stock prices and the percentage year to date price movement based on the last traded prices. Dividends payable and yields for each company are shown in the Main and Junior Markets’ daily report charts that show the closing volume for the bids and offers.
The EPS & PE ratios are based on 2021 and 2022 actual or projected earnings, excluding major one off items. The PE Ratio is the most popular measure used to determine the value of stocks.


