Trading closed on the Jamaica Stock Exchange with a rise in the volume of stocks exchanged on Wednesday, with a lower value than on Tuesday, resulting in a rise in the major indices of the Main Market and the Junior Market index and a mild slippage in the JSE USD Market index. At the end of trading the prices of 38 shares rose, 39 declined and 19 remained firm.
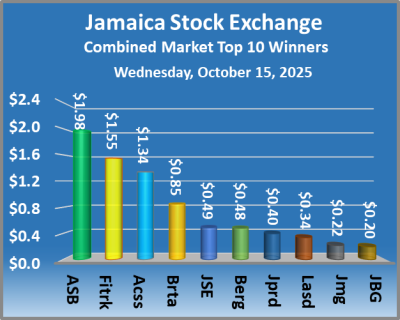 At the close of the market, the JSE Combined Market Index gained 282.39 points to 332,509.13, the All Jamaican Composite Index rallied 709.26 points to wrap up trading at 367,297.53, the JSE Main Index rallied 243.47 points to end at 322,529.59, the Junior Market Index increased a mere 6.96 points to finish at 3,361.97 and the JSE USD Market Index lost just 0.29 points to 193.28.
At the close of trading, 14,104,718 shares were exchanged in all three markets, up from 9,235,540 units on Tuesday, with the value of stocks traded on the Junior and Main markets amounted to $34.38 million, down from $58.93 million on the previous day and the JSE USD market closed with an exchange of 127,822 shares for US$14,251 compared to 16,150 units at US$433 on Tuesday.
In Main Market activity, Wigton Energy led trading with 1.68 million shares followed by Transjamaican Highway with 1.40 million stocks and Radio Jamaica with 437,785 units.
In Junior Market trading, JFP led with 5.01 million shares followed by Kintyre Holdings with 1.71 million stocks and Paramount Trading with 965,513 units.
In the preference segment, Productive Business Solutions 10.5% fell $7.48 to end at $1,153 and Sygnus Credit Investments C10.5% rallied $1.09 in closing at $105.
The market’s PE ratio, the most popular measure used to value stocks, ended at 13.6 based on 2025-26 earnings and 14.9 based on 2024 historical earnings. The ICInsider.com PE ratio chart and the other more detailed daily charts provide investors with regularly updated information to help decision-making. 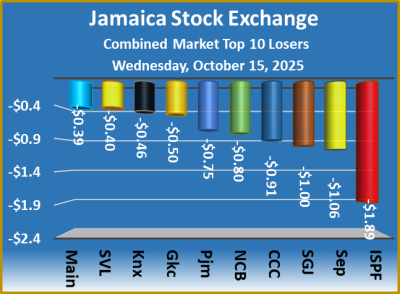 The PE ratio chart covers all ordinary shares listed on the Jamaica Stock Exchange, grouped by industry, allowing for easy comparisons within sectors and the overall market. The earnings per share (EPS) and PE ratios are based on 2024 and 2025 actual or projected earnings, excluding any major one time income or expense.
Pertinent information is needed to navigate numerous options successfully in stock markets. The chart should be used in making rational decisions when investing in stocks close to the sector average, not going too far from it, unless there are compelling reasons to do so. This approach helps to remove emotions from investment decisions and place them on fundamentals while at the same time not being too far from the majority of investors. Investors who buy when the price of a stock is close to the average will find that they are not inclined to overpay for a stock. The net asset value of each company is incorporated into the chart. Investors can use this measure in assessing stock values.  The chart also shows daily changes in stock prices and the percentage year to date price movement based on the last traded prices. Dividends that are paid or are due to be paid and yields for each company are shown in the Main and Junior Markets’ daily report charts, along with the closing volume of the highest bid and the lowest offer for each company.
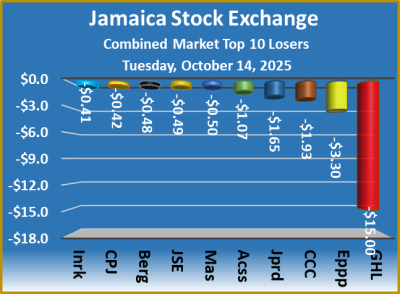
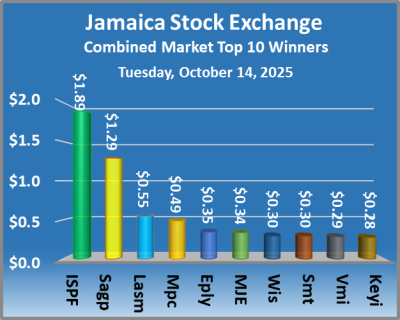 At the close of the market, the JSE Combined Market Index increased 543.37 points to 332,226.74, the All Jamaican Composite Index fell 809.11 points to 366,588.27, the JSE Main Index climbed 411.21 points to 322,286.12, the Junior Market Index popped 21.11 points to finish at 3,355.01 and the JSE USD Market Index gained 2.10 points to 193.57.
 The PE ratio chart covers all ordinary shares listed on the Jamaica Stock Exchange, that are grouped by industry, allowing for easy comparisons within a sector and the overall market. The earnings per share (EPS) and PE ratios are based on 2024 and 2025 actual or projected earnings, excluding any major one time income or expense.
 The chart also shows daily changes in stock prices and the percentage year to date price movement based on the last traded prices. Dividends that are paid or are due to be paid and yields for each company are shown in the Main and Junior Markets’ daily report charts, along with the closing volume of the highest bid and the lowest offer for each company.
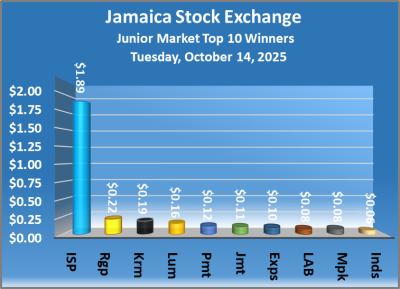 Trading activity was lackluster on Tuesday, with 6,126,623 shares for $6,907,098 changing hands, from 4,643,832 units at $8,363,353 on Monday.
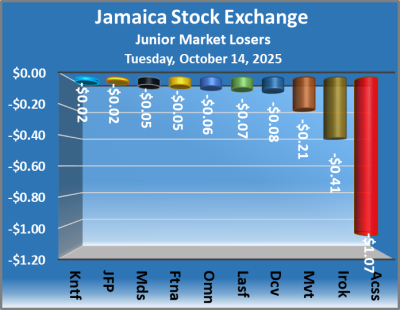 At the close of the market, Access Financial dropped $1.35 to end at $17.93 in swapping 102 shares, AMG Packaging sank 21 cents to end at $2.23 after trading of 175,261 stocks, Cargo Handlers increased $1.85 to end at $12.98, after 33 units passed through the market. Caribbean Cream popped 19 cents in closing at $2.19 in an exchange of 101 shares, Consolidated Bakeries rallied 16 cents to finish at $1.61 with investors trading 85,335 stock units, Derrimon Trading rose 13 cents and ended at $1.84 in an exchange of 4,245 shares. Dolla Financial declined 5 cents to $2.45 and closed with an exchange of 283,236 stock units, Dolphin Cove sank 6 cents to end at $13.80 after a transfer of 4,072 stocks, Express Catering gained 10 cents in closing at $2.80 with investors dealing in 64,311 units. Image Plus advanced 6 cents and ended at 98 cents after an exchange of 25,983 stocks, Indies Pharma climbed 5 cents to finish at $3.05 with a transfer of 2,052 units, Iron Rock Insurance slipped 41 cents to close at $3.50 after an exchange of a mere one share.
 Jamaican Teas popped 10 cents to $2.33 with investors swapping 10,119 stock units, Lasco Financial lost 11 cents to close at $1.88 in switching ownership of 4,401 shares, Limners and Bards shed 6 cents and ended at $1.10 as investors exchanged 3,336,347 stock units. Lumber Depot climbed 17 cents to end at $2.70 in trading 2,301 stocks, Main Event climbed 73 cents to $7.39, with 1,230 units clearing the market, Paramount Trading gained 10 cents to finish at 87 cents after trading of 203,900 stocks. Regency Petroleum rose 14 cents to $4.64, with 12,501 shares crossing the market, Spur Tree Spices rallied 6 cents in closing at $1.14, with traders dealing in 18,501 units and Stationery and Office Supplies advanced 9 cents to end at $1.78, with 2,822 stock units changing hands.
 Prices of securities trading are those for the last transaction of each stock unless otherwise stated.
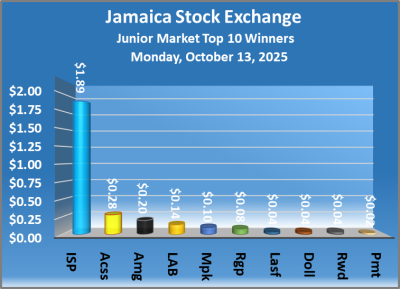 The market closed after an exchange of 4,643,832 shares for $8,363,353, rising from just 3,276,430 units at $5,319,300 on Friday.
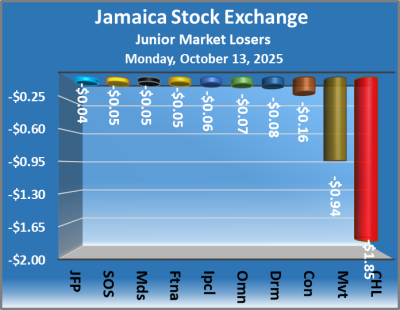 The Junior Market ended trading with an average PE Ratio of 12.5, based on last traded prices in conjunction with earnings projected by ICInsider.com for financial years ending around August 2026.
 Mailpac Group climbed 10 cents in closing at $2.50 as investors exchanged 43,896 shares, Main Event sank 94 cents to close at $6.66 in trading 1,010 stock units, Medical Disposables skidded 5 cents to finish at $1.70 after traders exchanged 702 units. Omni Industries shed 7 cents and ended at 77 cents with a transfer of 22,222 stocks, Regency Petroleum gained 8 cents to close at $4.50 with investors dealing in 38,874 shares and Stationery and Office Supplies dipped 5 cents in closing at $1.69 after the trading of 2,371,742 stocks.
 Prices of securities trading are those for the last transaction of each stock unless otherwise stated.
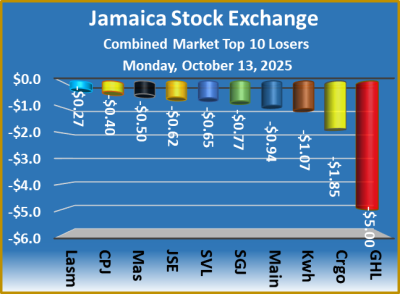
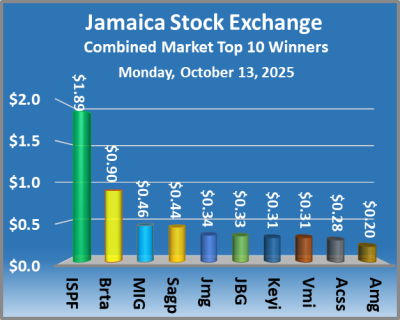 At the close of the market, the JSE Combined Market Index skidded 543.37 points to close at 31,683.37, the All Jamaican Composite Index rose 809.11 points to finish at 367,397.38, the JSE Main Index skidded 411.21 points to 321,874.91, the Junior Market Index dropped 21.11 points to 3,333.90 and the JSE USD Market Index slipped 2.10 points to settle at 191.47.
 The market’s PE ratio, the most popular measure used to value stocks, ended at 13.3 based on 2025-26 earnings and 15 based on 2024 historical earnings. The ICInsider.com PE ratio chart and the other more detailed daily charts provide regularly updated information to help in investment decision-making. The PE ratio chart covers all ordinary shares that are listed on the Jamaica Stock Exchange, grouped by industry, allowing for easy comparisons within a sector and the overall market. The earnings per share (EPS) and PE ratios are based on 2024 and 2025 actual or projected earnings, excluding any major one time income or expense.
 The net asset value of each company is incorporated into the chart. Investors can use this measure in assessing stock values. The chart also shows daily changes in stock prices and the percentage year to date price movement based on the last traded prices. Dividends that are paid or are due to be paid and yields for each company are shown in the Main and Junior Markets’ daily report charts, along with the closing volume of the highest bid and the lowest offer for each company.
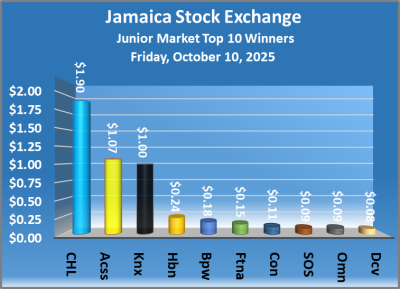 The market closed with trading of 3,276,430 shares for $5,319,300, with a rise from 2,316,817 units at $3,978,189 on Thursday.
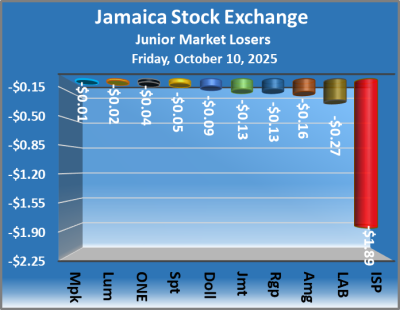 At the close of the market, Access Financial rose $1.07 to end at $19 in an exchange of 11,182 shares, AMG Packaging skidded 16 cents to $2.24 with 10,000 units crossing the market, Blue Power climbed 18 cents to finish at $3.78 with investors dealing in 3,784 stocks. Cargo Handlers popped $1.90 to close at $12.98 with an exchange of 10 shares, Consolidated Bakeries rallied 11 cents to end at $1.61 with investors swapping 200 stock units, Dolla Financial sank 9 cents in closing at $2.46 with 158,132 shares changing hands. Dolphin Cove increased 8 cents to $13.88 as investors exchanged 141 stock units, Fontana gained 15 cents to finish at $9.05 with 67,149 stocks passing through the market, Fosrich advanced 5 cents and ended at $2.25 with traders dealing in 73,475 units. Honey Bun rose 24 cents to end at $7.74, with 10,062 stocks clearing the market, ISP Finance slipped $1.89 in closing at $11.30, with brokers transferring 4,663 units, Jamaican Teas fell 13 cents to close at $2.22 after 40,500 shares were traded.
 KLE Group rallied 5 cents to 92 cents, with 15,455 stock units being traded, Knutsford Express increased by $1 in closing at $13, with 18 shares crossing the exchange, Lasco Financial climbed 7 cents to close at $1.95 with investors trading 5,882 units. Limners and Bards dipped 27 cents to end at $1.02 after a transfer of 310,000 stocks, Omni Industries popped 9 cents and ended at 84 cents with investors trading 47,234 units, Regency Petroleum sank 13 cents to finish at $4.42 after brokers exchanged 2,905 shares. Spur Tree Spices lost 5 cents to $1.09 with 95,176 stocks crossing the market and Stationery and Office Supplies advanced 9 cents to close at $1.74 in switching ownership of 20,025 units.
 Prices of securities trading are those for the last transaction of each stock unless otherwise stated.
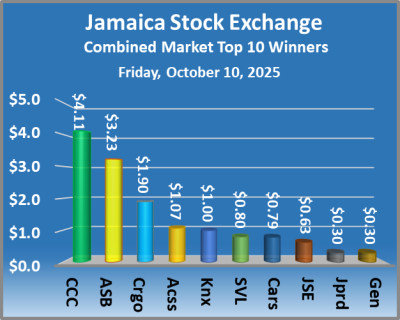 At the close of the market, the JSE Combined Market Index rose 293.56 points to 332,226.74, the All Jamaican Composite Index declined 878.07 points to wrap up trading at 366,588.27, the JSE Main Index gained 289.97 points to end at 322,286.12, the Junior Market Index popped 2.27 points to finish at 3,355.01 and the JSE USD Market Index rallied 4.77 points to finish at 193.57.
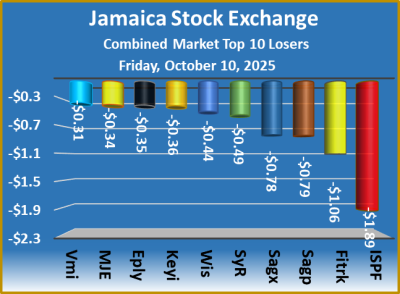 The market’s PE ratio, the most popular measure used to value stocks, ended at 13.2 based on 2025-26 earnings and .15 based on 2024-25 historical earnings. The ICInsider.com PE ratio chart and the other detailed daily charts provide on going updated information to help in decision-making. The PE ratio chart covers all of the ordinary shares listed on the Jamaica Stock Exchange, grouped by industry, allowing for easy comparisons within a sector and the overall market. The earnings per share (EPS) and PE ratios are based on 2024 and 2025 actual or projected earnings, excluding any major one time income or expense.
 The net asset value of each company is incorporated into the chart. Investors can use this measure in assessing stock values. The chart also shows daily changes in stock prices and the percentage year to date price movement based on the last traded prices. Dividends that are paid or are due to be paid and yields for each company are shown in the Main and Junior Markets’ daily report charts, along with the closing volume of the highest bid and the lowest offer for each company.
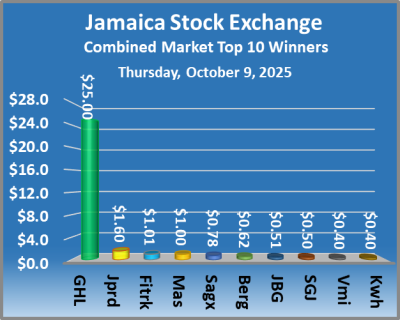 At the close of the market, the JSE Combined Market Index dropped 971.23 points to 331,933.18, the All Jamaican Composite Index dropped 2,152.82 points to end at 367,466.34, the JSE Main Index slipped 985.10 points to wrap up trading at 321,996.15, the Junior Market Index declined 4.03 points to finish at 3,352.74 and the JSE USD Market Index sank 3.01 points to end at 188.80.
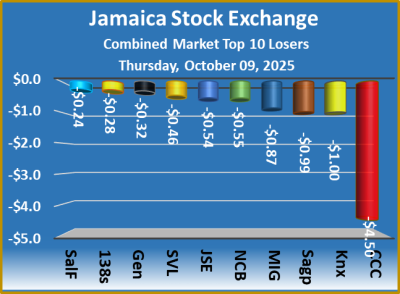
 The net asset value of each company is incorporated into the chart. Investors can use this measure in assessing stock values. The chart also shows daily changes in stock prices and the percentage year to date price movement based on the last traded prices. Dividends that are paid or are due to be paid and yields for each company are shown in the Main and Junior Markets’ daily report charts, along with the closing volume of the highest bid and the lowest offer for each company.
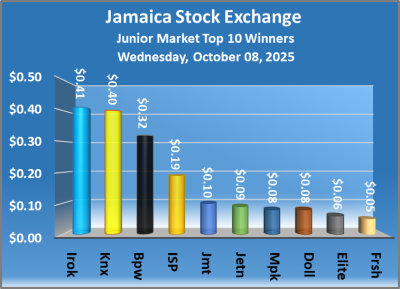 The market closed with trading of 1,716,240 shares for $3,159,246, down from 3,676,746 stock units at $4,840,071 on Tuesday.
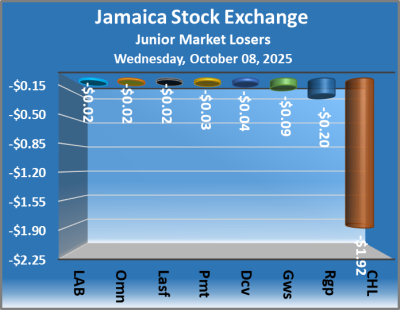 The Junior Market ended trading with an average PE Ratio of 12.3, based on last traded prices in conjunction with earnings projected by ICInsider.com for financial years ending around August 2026.
 Iron Rock Insurance advanced 41 cents to finish at $3.91 after a transfer of 164 stocks, ISP Finance rallied 19 cents and ended at $13.19 as investors exchanged 129 stock units. Jamaican Teas increased 10 cents in closing at $2.30 with 4,305 shares clearing the market, Jetcon Corporation climbed 9 cents to end at $1.77 in an exchange of 703,132 stocks, Knutsford Express rose 40 cents to close at $13 with traders dealing in 27,628 units. Mailpac Group advanced 8 cents to $2.50 after an exchange of 2,525 stock units and Regency Petroleum lost 20 cents and ended at $4.35 with investors dealing in 1,793 shares.
 Prices of securities trading are those for the last transaction of each stock unless otherwise stated.
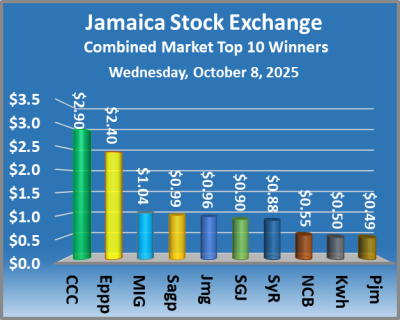 At the close of the market, the JSE Combined Market Index rallied 404.12 points to close trading at 332,904.41, the All Jamaican Composite Index increased 1,770.33 points to conclude trading at 369,619.16, the JSE Main Index climbed 511.90 points to 322,981.25, the Junior Market Index sank 12.07 points to conclude trading at 3,356.77 and the JSE USD Market Index dropped 1.30 points to end at 191.81.
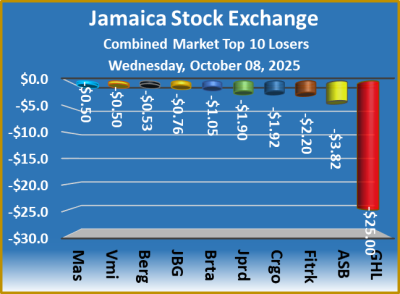 The market’s PE ratio, the most popular measure used to value stocks, ended at 13.4 based on the 2025-26 earnings and 15.3 based on 2024 historical earnings. ICInsider.com’s PE ratio chart and the other, more detailed daily charts provide regularly updated data to help with decision-making. The PE ratio chart covers all of the ordinary shares that are listed on the Jamaica Stock Exchange, grouped by industry, allowing for easy comparisons within a sector and the overall market. The earnings per share (EPS) and PE ratios are based on 2024 and 2025 actual or projected earnings, excluding any major one time income or expense.
 The net asset value of each company is incorporated into the chart. Investors can use this measure in assessing stock values. The chart also shows daily changes in stock prices and the percentage year to date price movement based on the last traded prices. Dividends that are paid or are due to be paid and yields for each company are shown in the Main and Junior Markets’ daily report charts, along with the closing volume of the highest bid and the lowest offer for each company.