Stocks struggled in trading on the Jamaica Stock Exchange on Thursday, with prices of 32 shares rising, 53 declining and 28 remaining firm, following a rise in the volume of stocks changing hands, with a greater value than on Wednesday and resulted in Main Market major indices declining, the Junior Market index falling and the JSE USD Market just inching higher.
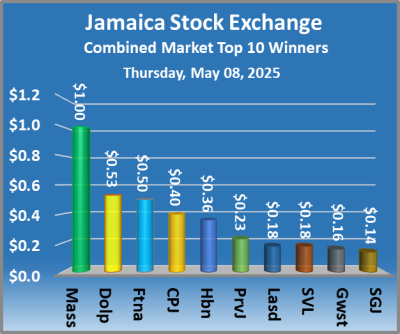 At the close of the market, the JSE Combined Market Index fell 2,080.68 points to wrap up trading at 332,838.38, while the All Jamaican Composite Index dropped 2,211.66 points to end at 370,532.49, the JSE Main Index skidded 2,055.72 points to settle at 322,360.49, the Junior Market Index shed 16.34 points to 3,432.94 and the JSE USD Market Index rose 0.27 points higher to end at 248.20.
At the close of the market, 28,146,064 shares were traded in all three markets, up sharply from 10,415,345 units on Wednesday. The value of stocks traded on the Main and the Junior markets amounted to $169.12 million, up from $34.32 million on the previous day and the JSE USD market closed with an exchange of 217,386 shares for US$11,618 compared to 264,864 units at US$21,126 on Wednesday.
In Main Market activity, Wigton Energy led with 12.43 million shares, followed by Transjamaican Highway with 2.88 million stocks and Sagicor Select Financial Fund with 1.16 million units.
In Junior Market trading, Kintyre Holdings led with 1.63 million shares, followed by Jamaican Teas with 678,649 stocks and Dolla Financial with 394,523 units.
In the preference segment, Jamaica Public Service 9.5% advanced $2 to close at $2,690, 138 Student Living preference share dipped $4.95 to $201, Productive Business Solutions 10.5% preference share popped $5 in closing at $1,050, Sygnus Credit Investments 10% climbed $3 and ended at $104 and Sygnus Credit Investments C10.5% sank $5 to finish at $95.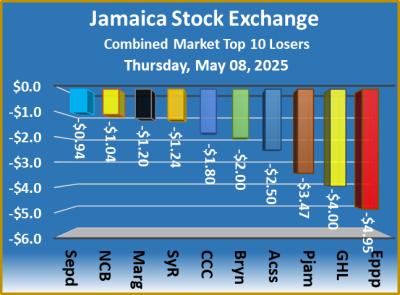 The market’s PE ratio, the most popular measure used to value stocks, ended at 12.7 based on 2024-25 earnings and 18.8 based on 2024 earnings.
The ICInsider.com PE ratio chart and the more detailed daily charts provide investors with regularly updated information to help in decision-making. The PE ratio chart covers all the ordinary shares listed on the Jamaica Stock Exchange, grouped by industry, allowing for easy comparisons within a sector and the overall market. The earnings per share (EPS) and PE ratios are based on 2024 and 2025 actual or projected earnings, excluding any major one time income or expense.
Pertinent information is required to navigate numerous investment options successfully in the stock market. The chart should be used in making rational decisions when investing in stocks close to the sector average, not going too far from it unless there are compelling reasons to do so. This approach helps to remove emotions from investment decisions and place them on fundamentals while at the same time not being too far from the majority of investors. Investors who buy when the price of a stock is close to the average will find that they are not inclined to overpay for a stock.  The net asset value of each company is incorporated into the chart. Investors can use this measure in assessing stock values. The chart also shows daily changes in stock prices and the percentage year to date price movement based on the last traded prices. Dividends that are paid or are due to be paid and yields for each company are shown in the Main and Junior Markets’ daily report charts, along with the closing volume of the highest bid and the lowest offer for each company.
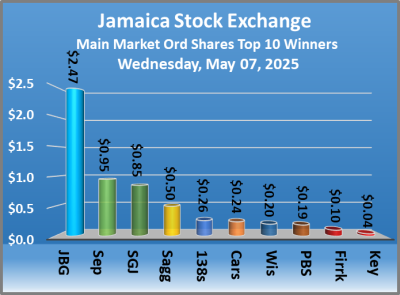 The market closed with 5,328,869 shares traded for $25,786,180, well below 10,672,736 stock units at $117,194,035 on Tuesday.
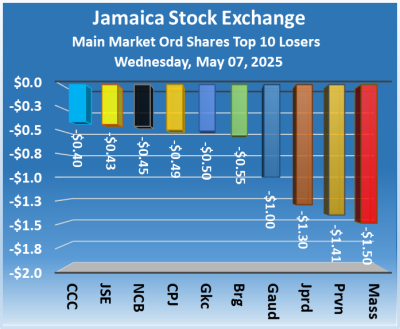 The JSE Main Market ended trading with an average PE Ratio of 13.5. The JSE Main and the USD Market PE ratios are based on last traded prices and earnings forecasts by ICInsider.com for companies with the financial year ending around August 2025.
 Jamaica Producers dropped $1.30 to $22.70 with traders dealing in 15,176 stocks, Jamaica Stock Exchange lost 43 cents to $12.50 in an exchange of 2,819 shares, Massy Holdings declined $1.50 to close at $78 with 260 stocks clearing the market. NCB Financial skidded 45 cents and ended at $46.55 with investors trading 20,010 shares, Sagicor Group climbed 50 cents to end at $44 with 12,148 stocks crossing the exchange, Scotia Group increased 85 cents to finish at $54.85 with investors trading 74,168 units and Seprod popped 95 cents to $82 with 1,016 stock units switching owners.
 Prices of securities trading are those for the last transaction of each stock unless otherwise stated.
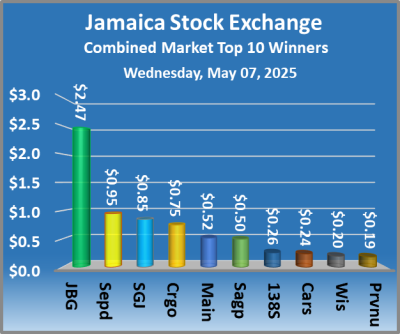 At the close of the market, the JSE Combined Market Index dipped 683.98 points to end at 334,919.06, the All Jamaican Composite Index declined by 148.80 points to wrap up trading at 372,744.15, the JSE Main Index sank 634.02 points to finish at 324,416.21, the Junior Market Index fell 10.65 points to settle at 3,449.28 and the JSE USD Market Index advanced 8.84 points to 247.93.
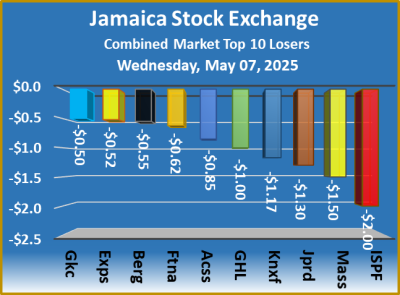 The market’s PE ratio, the most popular measure used to value stocks, ended at 13 based on 2024-25 earnings and 19.2 based on 2024 earnings. The ICInsider.com PE ratio chart and the other, more detailed daily charts provide investors with updated information to help decision-making. The PE ratio chart covers all ordinary shares listed on the Jamaica Stock Exchange, grouped by industry, allowing for easy comparisons within a sector and the overall market. The earnings per share (EPS) and PE ratios are based on 2024 and 2025 actual or projected earnings, excluding any major one time income or expense.
 The net asset value of each company is incorporated into the chart. Investors can use this measure in assessing stock values. The chart also shows daily changes in stock prices and the percentage year to date price movement based on the last traded prices. Dividends that are paid or are due to be paid and yields for each company are shown in the Main and Junior Markets’ daily report charts, along with the closing volume of the highest bid and the lowest offer for each company.
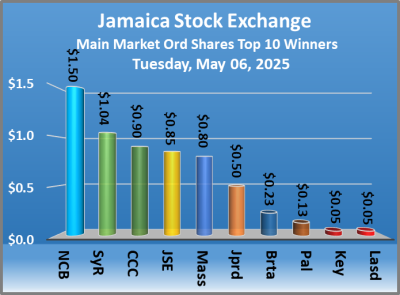 The market closed with 10,672,736 shares trading for $117,194,035, well above the 6,032,256 stocks changing hands at $33,850,972 on Monday.
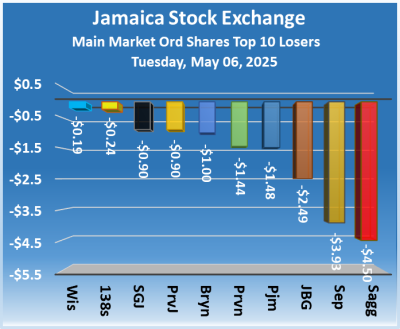 The Main Market ended trading with an average PE Ratio of 13.6. The JSE Main and the USD Market PE ratios are based on last traded prices and earnings forecasts by ICInsider.com for companies with the financial year ending around August 2025.
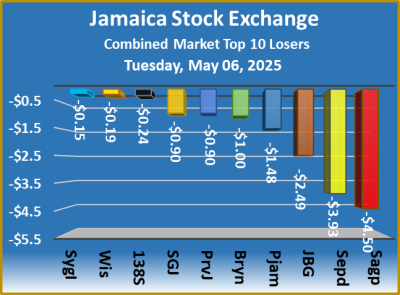
 Proven Investments sank 90 cents in closing at $17 with 746 units changing hands. Sagicor Group skidded $4.50 to close at $43.50 with 7,703 stocks crossing the market, Scotia Group sank 90 cents to finish at $54 with an exchange of 5,589 shares, Seprod shed $3.93 and ended at $81.05 with 2,336 units crossing the market and Sygnus Real Estate Finance gained $1.04 to $9.34 with investors dealing in 717 stock units.
 Prices of securities trading are those for the last transaction of each stock unless otherwise stated.
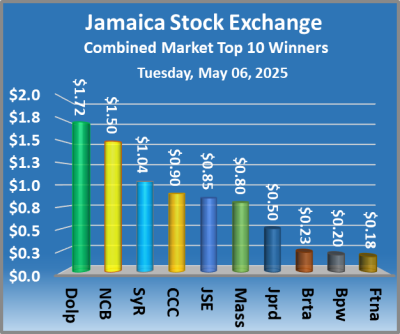 At the close of the market, the JSE Combined Market Index slipped 1,444.01 points to wrap up trading at 335,603.04, the All Jamaican Composite Index sank 1,253.96 points to 372,892.95, the JSE Main Index dropped 1,351.13 points to conclude trading at 325,050.23, the Junior Market Index slipped 20.88 points to end at 3,459.93 and the JSE USD Market Index popped 9.21 points to settle at 239.09.
 The market’s PE ratio, the most popular measure used to value stocks, ended at 13 based on 2024-25 earnings and 19.5 based on 2024 historical earnings. The ICInsider.com PE ratio chart and the other more detailed daily charts provide investors with regularly updated information to help decision-making. The PE ratio chart covers all ordinary shares listed on the Jamaica Stock Exchange, grouped by industry, allowing for easy comparisons within a sector and the overall market. The earnings per share (EPS) and PE ratios are based on 2024 and 2025 actual or projected earnings, excluding any major one time income or expense.
 Investors who buy when the price of a stock is close to the average will find that they are not inclined to overpay for a stock. The net asset value of each company is incorporated into the chart. Investors can use this measure in assessing stock values. The chart also shows daily changes in stock prices and the percentage year to date price movement based on the last traded prices. Dividends that are paid or are due to be paid and yields for each company are shown in the Main and Junior Markets’ daily report charts, along with the closing volume of the highest bid and the lowest offer for each company.
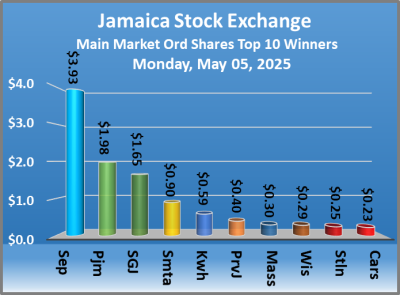 The market closed with 6,032,256 shares exchanged for $33,850,972, lower than the 6,354,185 stock units at $108,084,361 on Friday.
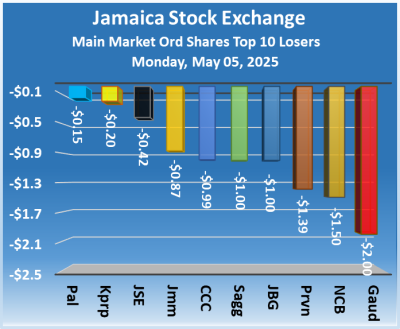 The Main Market ended trading with an average PE Ratio of 13.6. The JSE Main and the USD Market PE ratios are based on last traded prices and earnings forecasts by ICInsider.com for companies with the financial year ending around August 2025.
 Proven Investments climbed 40 cents and ended at $17.90 with 79 stock units crossing the exchange. Sagicor Group fell $1 in closing at $48 with 8,411 changing hands, Scotia Group increased $1.65 to end at $54.90 with investors dealing in 42,489 stocks, Seprod rose $3.93 to close at $84.98 with a transfer of 2,920 units and Stanley Motta gained 90 cents to finish the day at $6.79 with 1,073 stock units clearing the market.
 Prices of securities trading are those for the last transaction of each stock unless otherwise stated.
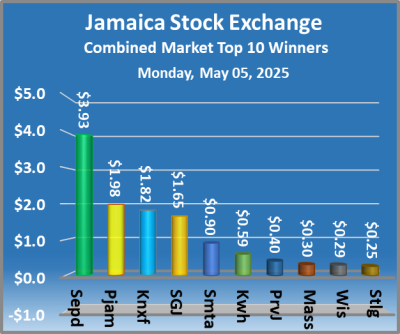 At the close of the market, the JSE Combined Market Index climbed 1,099.04 points to 337,047.05, the All Jamaican Composite Index advanced 1,566.91 points to finish at 374,146.91, the JSE Main Index popped 1,021.38 points to conclude trading at 326,401.36, the Junior Market Index rallied 16.78 points to 3,480.81 and the JSE USD Market Index gained 10.72 points to finish at 229.88.
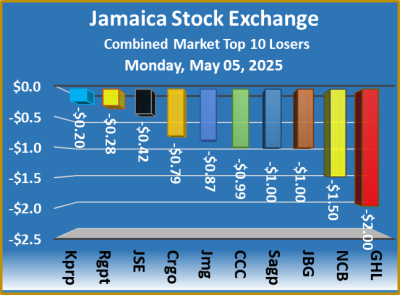 The market’s PE ratio, the most popular tool used to value stocks, ended at 13 based on 2024-25 earnings and 19.4 based on 2024 earnings. The ICInsider.com PE ratio chart and the more detailed daily charts provide investors with regularly updated information to help decision-making.
 Investors who buy when the price of a stock is close to the average will find that they are not inclined to overpay for a stock. The net asset value of each company is incorporated into the chart. Investors can use this measure in assessing stock values. The chart also shows daily changes in stock prices and the percentage year to date price movement based on the last traded prices. Dividends that are paid or are due to be paid and yields for each company are shown in the Main and Junior Markets’ daily report charts, along with the closing volume of the highest bid and the lowest offer for each company.
 Caribbean Assurance fell 9 percent following the belated reporting of the 2024 results, with a major increase in employee costs pushing the operations into a loss and Caribbean Flavours fell 6 percent to $1.16.
 At the end of the week, the Junior Marlet ICTOP10 ended with Caribbean Assurance and Dolphin Cove dropping out of the TOP10 and were replaced by Image Plus and Iron Rock Insurance. There are no changes to the Main Market ICTOP10 list. The All JSE ICTOP10 listings remained unchanged, but the order changed markedly, with Guardian Holdings dropping to the number 3 position and 138 Student Living climbing to the top.
 The list includes some of the best companies in the market and others that are not blue chip. Sometimes, they include weaker companies that may be oversold and end up on the list. ICInsider.com ranks stocks based on projected earnings, allowing investors to focus on the most undervalued stocks and remove emotions when selecting stocks for investments.
 The market closed with 6,354,185 shares trading for $108,084,361 compared with 14,473,698 stock units at $72,415,760 on Thursday.
Trading averaged 109,555 shares for $1,863,523 in comparison with 263,158 stocks at $1,316,650 on Thursday and month to date, an average of 184,318 stock units at $1,597,346 compared with April that ended with an average of 1,417,136 stocks at $6,010,754.
Transjamaican Highway was the leading traded stock with 2.81 million shares for 44.2 percent of total volume, followed by Massy Holdings which ended with 991,704 units for 15.6 percent of the day’s trade and Sygnus Credit Investments with 423,982 stocks for 6.7 percent of the volume traded.
At the close, the Investor’s Choice bid-offer indicator shows four stocks ending with bids higher than their last selling prices and four with lower offers.
The Main Market ended trading with an average PE Ratio of 13.6. The JSE Main and the USD Market PE ratios are based on last traded prices and earnings forecasts by ICInsider.com for companies with the financial year ending around August 2025.
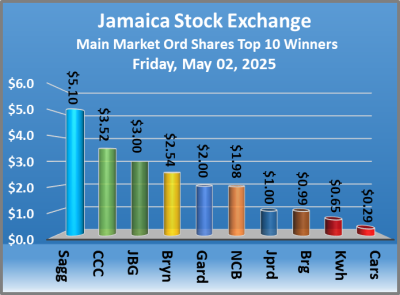
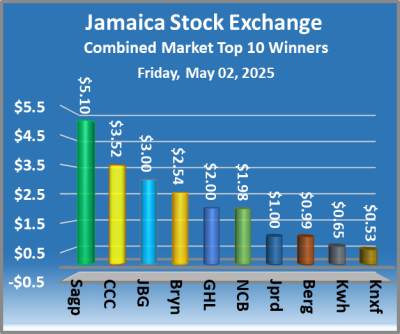
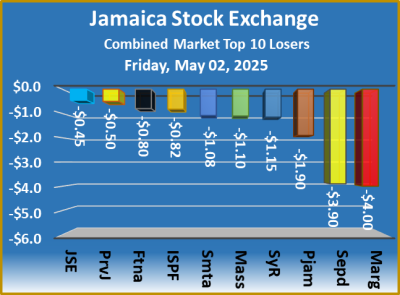
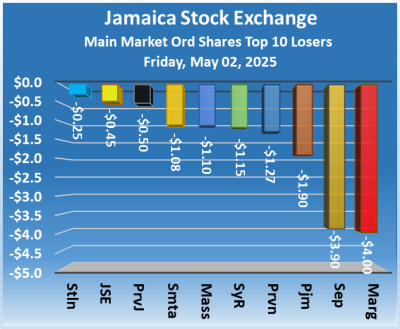 At the close of the market AS Bryden increased $2.54 to close at $33 in an exchange of 1,025 shares, Berger Paints climbed 99 cents to $7.85 with trading in 100 stocks, Caribbean Cement rose $3.52 and ended at $86.49 in swapping ownership of 2,834 units. Guardian Holdings rose $2 to finish at $347 with 1,157 stocks being traded, Jamaica Broilers popped $3 to end at $31 with an exchange of 70,802 stock units, Jamaica Producers rallied $1 in closing at $23.50 after trading of 1,004 shares. Jamaica Stock Exchange sank 45 cents to $12.50 and closed with an exchange of 4,072 stock units, Kingston Wharves advanced 65 cents to close at $28.40 with investors trading 150 units, Margaritaville lost $4 to finish at $11 after 1,196 stocks passed through the market. Massy Holdings dropped $1.10 and ended at $78.40 with investors trading 991,704 shares, NCB Financial rose $1.98 in closing at $47 with 7,685 stock units crossing the market, Pan Jamaica fell $1.90 to end at $53 with investors swapping 10,087 stocks.
 Proven Investments dipped 50 cents to $17.50 with 46,309 units clearing the market, Sagicor Group advanced $5.10 and ended at $49 in trading 10,214 stocks, Seprod sank $3.90 to finish at $81.05 with 5,306 units crossing the exchange, before the company release notice to acquire additional shares in AS Bryan that will take their holding up to 80 percent. Stanley Motta slipped $1.08 in closing at $5.89 with investors dealing in 5,102 shares and Sygnus Real Estate Finance skidded $1.15 to end at $8.14 after an exchange of 14,000 stock units.
In the preference segment, Sygnus Credit Investments C10.5% declined $6.50 to close at $95 with 931 shares changing hands.
 Prices of securities trading are those for the last transaction of each stock unless otherwise stated.
 At the close of the market, the JSE Combined Market Index climbed 413.66 points to 335,948.01, the All Jamaican Composite Index fell 377.21 points to 372,580.00, the JSE Main Index rallied 518.99 points to wrap up trading at 325,379.98, the Junior Market Index slipped 10.68 points to end at 3,464.03 and the JSE USD Market Index declined 2.29 points to 219.16.
 The market’s PE ratio, the most popular measure used to value stocks, ended at 13 based on 2024-25 earnings and 19.4 based on 2024 historical earnings. The ICInsider.com PE ratio chart and the other daily charts that provide investors with regularly updated information to help in decision-making. The PE chart covers all ordinary shares that are listed on the Jamaica Stock Exchange, grouped by industry, allowing for easy comparisons within a sector and the overall market. The earnings per share (EPS) and PE ratios are based on 2024 and 2025 actual or projected earnings, excluding any major one time income or expense.
 Investors who buy when the price of a stock is close to the average will find that they are not inclined to overpay for a stock. The net asset value of each company is incorporated into the chart. Investors can use this measure in assessing stock values. The chart also shows daily changes in stock prices and the percentage year to date price movement based on the last traded prices. Dividends that are paid or are due to be paid and yields for each company are shown in the Main and Junior Markets’ daily report charts, along with the closing volume of the highest bid and the lowest offer for each company.