The Main and the Junior Market bounced at the close of the Jamaica Stock Exchange on Thursday following a rise in the number of stocks that were exchanged, but with a slightly lower value than on Wednesday, resulting in the prices of 34 shares rising, 39 declining and 38 remaining firm and ending with the Main Market major indices rising, the Junior Market index rallying and the JSE USD Market falling.
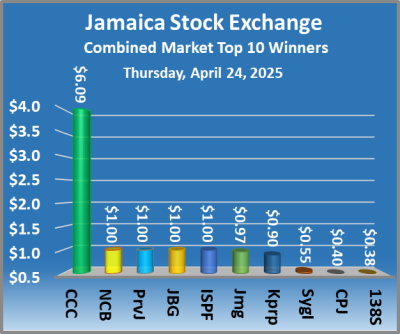 At the close of the market, the JSE Combined Market Index popped 1,157.07 points to 326,964.66, the All Jamaican Composite Index gained 1,669.61 points to wrap up trading at 364,075.81, the JSE Main Index increased by 1,068.01 points to end at 316,258.81, the Junior Market Index rose 18.58 points to finish at 3,424.50 and the JSE USD Market Index declined 0.53 points to 223.44.
At the close of trading, 16,691,154 shares were exchanged in all three markets, up from 15,258,252 units on Wednesday, with the value of stocks traded on the Junior and Main markets amounted to $66.39 million, down from $85.37 million on the previous day and the JSE USD market closed with an exchange of 870,827 shares for US$59,277 down from 3,246,465 units at US$123,728 on Wednesday.
In Main Market activity, Sagicor Select Financial Fund led trading with 2.85 million shares, followed by Transjamaican Highway with 2.83 million stocks and Wigton Energy with 1.69 million units.
In Junior Market trading, ONE on ONE Educational led with 2.30 million shares, followed by Derrimon Trading with 2.12 million stocks and Stationery and Office Supplies with 545,315 units.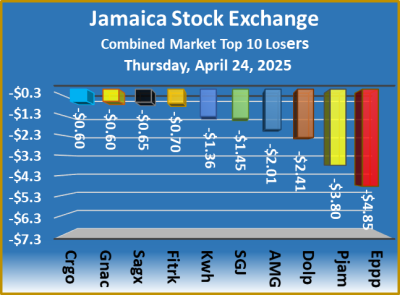 In the preference share segment, Jamaica Public Service 7% rose $8.50 to end at $45, Productive Business 10.5% preference share shed $5.97 to $1,035 and Sygnus Credit Investments 10% climbed $9.99 to finish at $100.
The market’s PE ratio, the most popular measure used to value stocks, ended at 12.2 based on 2024-25 earnings and 19 based on 2024 historical earnings. The ICInsider.com PE ratio chart and the other more detailed daily charts provide investors with regularly updated information to help decision-making. The PE ratio chart covers all ordinary shares listed on the Jamaica Stock Exchange, grouped by industry, allowing for easy comparisons within a sector and the overall market. The earnings per share (EPS) and PE ratios are based on 2024 and 2025 actual or projected earnings, excluding any major one time income or expense.
Pertinent information is required to navigate numerous investment options successfully in the stock market. The chart should be used in making rational decisions when investing in stocks close to the sector average, not going too far from it unless there are compelling reasons to do so. This approach helps to remove emotions from investment decisions and place them on fundamentals while at the same time not being too far from the majority of investors.  Investors who buy when the price of a stock is close to the average will find that they are not inclined to overpay for a stock. The net asset value of each company is incorporated into the chart. Investors can use this measure in assessing stock values. The chart also shows daily changes in stock prices and the percentage year to date price movement based on the last traded prices. Dividends that are paid or are due to be paid and yields for each company are shown in the Main and Junior Markets’ daily report charts, along with the closing volume of the highest bid and the lowest offer for each company.
 The market closed with 11,711,045 shares trading worth $73,006,878 compared to 14,003,097 stock units at $56,426,679 on Thursday.
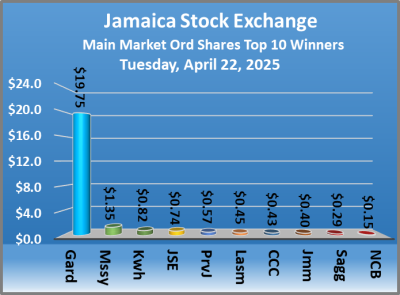
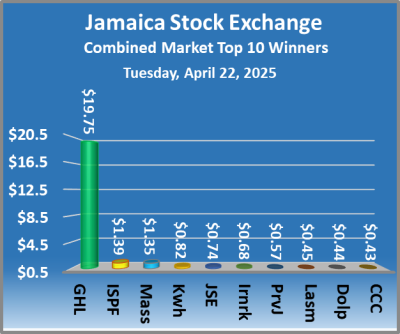
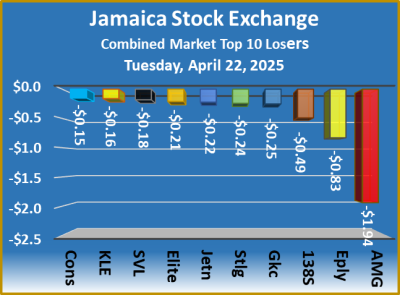
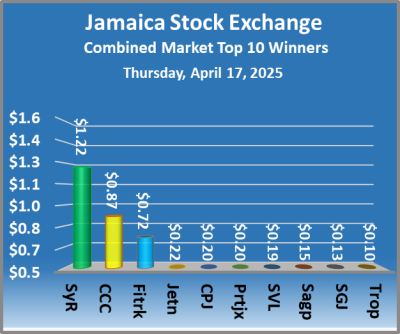
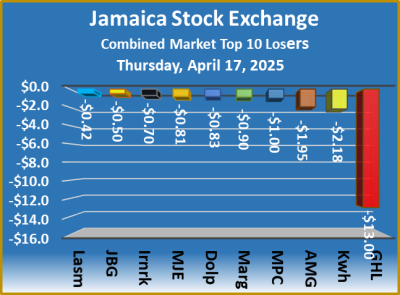
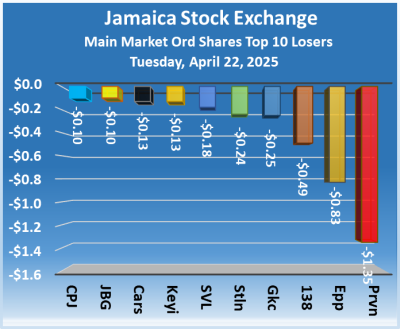 At the close of market activities, Caribbean Cement rallied 43 cents to end at $84.30 while trading 2,130 shares, Eppley skidded 83 cents to $32.50, with an exchange of 2,473 units, Guardian Holdings climbed $19.75 to close at $309.75 with a transfer of 106,215 shares, the largest trade since November last year when 112,030 shares were traded. Jamaica Stock Exchange gained 74 cents and ended at $12.74 with investors swapping 22,566 stock units, JMMB Group popped 40 cents in closing at $20.50 with an exchange of 5,463 stocks, Kingston Wharves advanced 82 cents to finish at $27.10 with 2,294 units crossing the market. Lasco Manufacturing increased 45 cents and ended at $7.50 with investors trading 22,618 stocks, Massy Holdings climbed $1.35 to $79.90 in an exchange of 618 shares, 138 Student Living lost 49 cents to end at $3.21, with 15,641 stock units clearing the market and Proven Investments rose 57 cents in closing at $17.50 as investors exchanged 80,332 shares.
 In the preference segment, Jamaica Public Service 7% sank $6.68 to close at $37.82 after a transfer of 72 stock units, JMMB Group 7.15% – 2028 declined 36 cents to $2.60 with investors trading 20,136 stocks. Productive Business Solutions 10.5% preference share rallied $43.99 and ended at $1,043.99 after an exchange of 3 units, Sygnus Credit Investments 10% sank $13.99 to $90.01 with the trading of 400 stock units and Sygnus Credit Investments C10.5% popped $2 to close at $100 with traders dealing in 141 shares.
 Prices of securities trading are those for the last transaction of each stock unless otherwise stated.

 Transjamaican Highway dipped 0.05 of one cent and ended at 2.45 US cents with 439,012 stock units crossing the market.
In the preference segment, JMMB Group 7.5% preferred share ended at US$2 after an exchange of 48 stocks, JMMB Group US8.5% preference share remained at US$1.034 after closing with an exchange of 2,648 units. Sygnus Credit Investments US 8% popped 29 cents to US$8.54 in trading 84 stocks and Sygnus Credit Investments US 8% climbed 30 cents and ended at US$10 with 325 shares changing hands.
Prices of securities trading are those for the last transaction of each stock unless otherwise stated.
 At the close of market activity, 16,478,941 shares were exchanged in all three markets, down from 21,602,495 units on Thursday, with the value of stocks traded on the Junior and Main markets climbing to $79.63 million, from $70.31 million on the previous trading day and the JSE USD market closed with an exchange of 488,548 shares for US$21,786 compared to 422,657 units at US$21,798 on Thursday.
 The market’s PE ratio, the most popular measure used to value stocks, ended at 12.3 based on 2025 earnings and 18.9 based on 2024 historical earnings. The ICInsider.com PE ratio chart and the other, more detailed daily charts provide investors with regularly updated information to help decision-making. The PE ratio chart covers all the ordinary shares listed on the Jamaica Stock Exchange, grouped by industry, allowing for easy comparisons within a sector and the overall market. The earnings per share (EPS) and PE ratios are based on 2024 and 2025 actual or projected earnings, excluding any major one time income or expense.
 Investors who buy when the price of a stock is close to the average will find that they are not inclined to overpay for a stock. The net asset value of each company is incorporated into the chart. Investors can use this measure in assessing stock values. The chart also shows daily changes in stock prices and the percentage year to date price movement based on the last traded prices. Dividends that are paid or are due to be paid and yields for each company are shown in the Main and Junior Markets’ daily report charts, along with the closing volume of the highest bid and the lowest offer for each company.
 The market closed with trading of 14,003,097 shares for $56,426,679, down from 26,127,733 stock units at $99,012,198 on Wednesday.
 The Main Market ended trading with an average PE Ratio of 12.9. The JSE Main and USD Market PE ratios are based on the last traded prices and earnings forecasts for companies with financial year ending around August 2025 done by
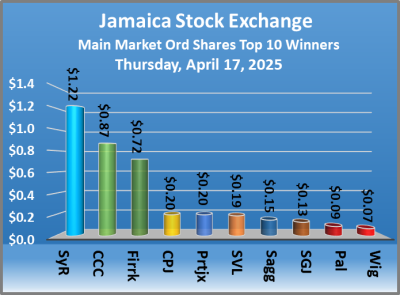
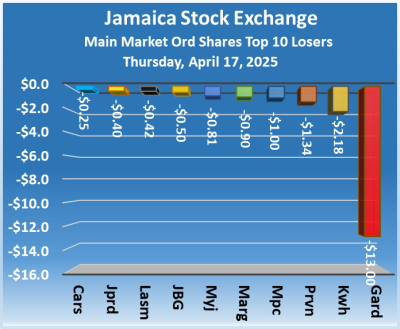
 Margaritaville sank 90 cents and ended at $13 with traders dealing in 950 units, MPC Caribbean Clean Energy slipped $1 in closing at $63 with a mere 2 stocks being traded and Sygnus Real Estate Finance gained $1.22 to finish at $9.36 after the trading of 14 shares.
 Prices of securities trading are those for the last transaction of each stock unless otherwise stated
 Trading ended in an exchange of six securities, compared with nine on Wednesday, with the prices of three stocks rising, one declining and two ending unchanged.
 First Rock Real Estate USD share ended at 1.99 US cents with an exchange of 1,005 shares, Proven Investments remained at 11 US cents and closed with an exchange of 90 stock units, Sygnus Credit Investments advanced 0.9 of a cent to end at 7 US cents in switching ownership of 1,000 shares and Transjamaican Highway dipped 0.01 of a cent in closing at 2.5 US cents with investors swapping 415,112 stocks.
 At the close of the market, the JSE Combined Market Index dipped 1,376.94 points to end at 323,281.37, the All Jamaican Composite Index sank 809.47 points to end trading at 360,488.92, the JSE Main Index shed 1,153.08 points to settle at 312,487.89, while the Junior Market Index dipped 36.99 points to close at 3,412.23, the lowest level in a year and the JSE USD Market Index rallied 0.40 points to settle at 226.29.
 The market’s PE ratio, the most popular measure used to value stocks, ended at 12.2 based on 2024-25 earnings and 19.1 based on 2024 historical earnings. The ICInsider.com PE ratio chart and the other more detailed daily charts provide investors with regularly updated information to help decision-making. The PE ratio chart covers all ordinary shares listed on the Jamaica Stock Exchange, grouped by industry, allowing for easy comparisons within a sector and the overall market. The earnings per share (EPS) and PE ratios are based on 2024 and 2025 actual or projected earnings, excluding any major one time income or expense.
 Investors who buy when the price of a stock is close to the average will find that they are not inclined to overpay for a stock. The net asset value of each company is incorporated into the chart. Investors can use this measure in assessing stock values. The chart also shows daily changes in stock prices and the percentage year to date price movement based on the last traded prices. Dividends that are paid or are due to be paid and yields for each company are shown in the Main and Junior Markets’ daily report charts, along with the closing volume of the highest bid and the lowest offer for each company.
 The market closed with an exchange of 631,514 shares for US$47,545 compared to 2,201,110 stock units at US$192,691 on Tuesday.
 Sterling Investments dipped 0.01 of a cent to end at 1.95 US cents in switching ownership of 9,728 shares, Sygnus Credit Investments slipped 0.9 of a cent and ended at 6.1 US cents after 37,253 stock units passed through the market and Transjamaican Highway remained at 2.51 US cents with 528,962 shares crossing the exchange.
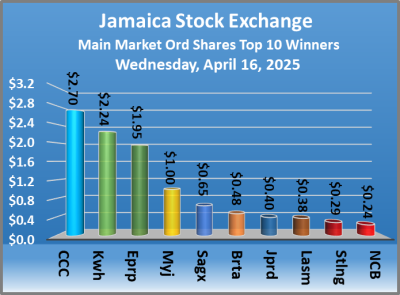 The market closed with 26,127,733 shares trading for $99,012,198, up from just 13,296,040 stock units at $59,268,535 on Tuesday.
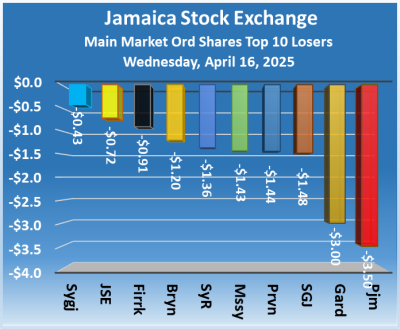 The Main Market ended trading with an average PE Ratio of 13.3. The JSE Main and USD Market PE ratios are based on last traded prices and earnings forecasts by ICInsider.com for companies with the financial year ending around August 2025.
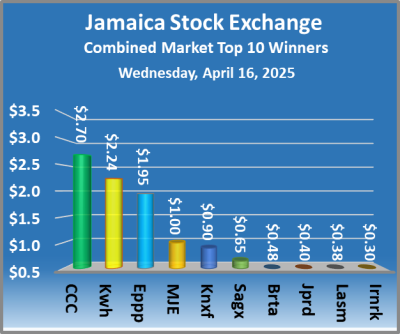
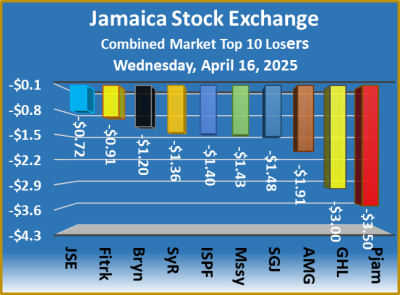
 Lasco Manufacturing advanced 38 cents to end at $7.47 with investors trading 11,471 shares, Massy Holdings sank $1.43 to finish at $78.55 with 132 stock units crossing the market, Pan Jamaica declined $3.50 and ended at $53.50 after an exchange of 6,254 stocks. Sagicor Real Estate Fund gained 65 cents to close at $8.65 with 205 units crossing the market, Scotia Group shed $1.48 to close at $52.52 after an exchange of 8,194 shares, Sygnus Credit Investments shed 43 cents to finish at $11.47 in trading 15,005 units and Sygnus Real Estate Finance lost $1.36 and ended at $8.14 with an exchange of 21 stocks.
 Prices of securities trading are those for the last transaction of each stock unless otherwise stated.
 At the close of the market, the JSE Combined Market Index fell 1,047.70 points to close at 324,658.31, the All Jamaican Composite Index declined by 1,084.28 points to 361,298.39, the JSE Main Index dipped 1,303.18 points to 313,640.97, the Junior Market Index rose 25.62 points to 3,449.22 and the JSE USD Market Index skidded 2.88 points to finish at 225.89.
 The market’s PE ratio, the most popular measure used in valuing stocks, ended at 12.2 based on 2024-25 earnings and 19.1 based on 2024 historical earnings. The ICInsider.com PE ratio chart and the other more detailed daily charts, provide investors with regularly updated information to assist in decision-making. The PE ratio chart covers all ordinary shares listed on the Jamaica Stock Exchange, grouped by industry, allowing for easy comparisons within a sector and the overall market. The earnings per share (EPS) and PE ratios are based on 2024 and 2025 actual or projected earnings, excluding any major one time income or expense.
 Investors who buy when the price of a stock is close to the average will find that they are not inclined to overpay for a stock. The net asset value of each company is incorporated into the chart. Investors can use this measure in assessing stock values. The chart also shows daily changes in stock prices and the percentage year to date price movement based on the last traded prices. Dividends that are paid or are due to be paid and yields for each company are shown in the Main and Junior Markets’ daily report charts, along with the closing volume of the highest bid and the lowest offer for each company.