The ICTOP10 returns after a break since the end of July, with Elite Diagnostic jumping sharply along with Express Catering and Consolidated Bakeries. A lot has happened since, with the Junior Market index slipping 1.3 percent to 3,464 points and the JSE Main Index climbed a B 5 percent over the same period. Six of the Junior Market ICTOP10 stocks posted solid gains ranging from 8 percent to 41 percent, one remained firm and three declined.
 The Junior Market ICTOP10, Elite Diagnostic jumped 41 percent to $1.91, Consolidated Bakeries and Express Catering delivered gains of 36 percent to end at $1.70 and $3,65, respectively. Kintyre Holdings popped 30 percent to 30 cents, and Medical Disposables rallied 15 percent to end at $1.72.
NCB Financial is the leading Main Market ICTOP10, rising stock, up a solid 31 percent as it closed the week at $41.40, up from $31.50 at the end of July. Guardian Holdings follows with a gain of 24 percent to $382, while VM Investments rose 17 percent to $2.31. TransJamaican Highway rose 15 percent to end the week at $4.24.
Dolla Financial lost ground and fell out, making space for Jetcon Corporation to enter the TOP 10. There were no changes to the Main Market ICTOP 10. Indicators of potential gains for the market show, the average PE for the JSE Main Market ICTOP 10 is 5.8, well below the market average of 13.5 and shows 18 stocks, with the highest values accounting for 35 percent of the market, with PE ratios of 15 to 40. The average PE for half of the market with the highest values is 20.
The Junior Market TOP10 stands at 6, well below half the market’s average of 13, with 19 stocks representing 40 percent of the market having PEs ranging from 16 to 38, with an average of 20 and 18 for half of the market, with the highest PEs.
ICTOP10 focuses on likely yearly winners. The list includes some of the best as well as newer companies that have not been tested over time. ICInsider.com ranks companies based on projected earnings for easy assessment in making investment decisions. IC TOP10 stocks that will likely deliver the best returns are ranked in order of potential gains, computed using projected earnings, allowing investors to focus on the most undervalued companies when making investment decisions.
IC TOP10 stocks will likely deliver the best returns on or around May 2026 and are ranked in order of potential gains, computed using projected earnings for the current fiscal year. Expected values will change as stock prices fluctuate, resulting in weekly movements in and out of the lists. Earning revisions are ongoing, based on the receipt of new information.
Persons who compiled this report may have an interest in securities commented on in this report.
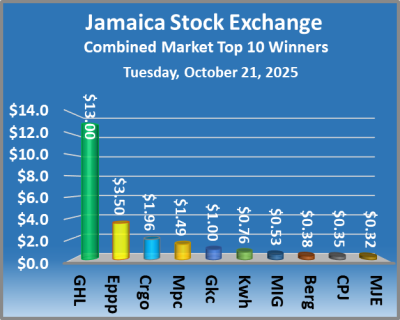
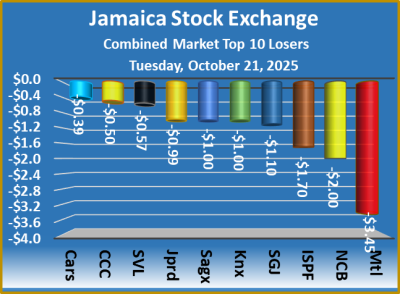
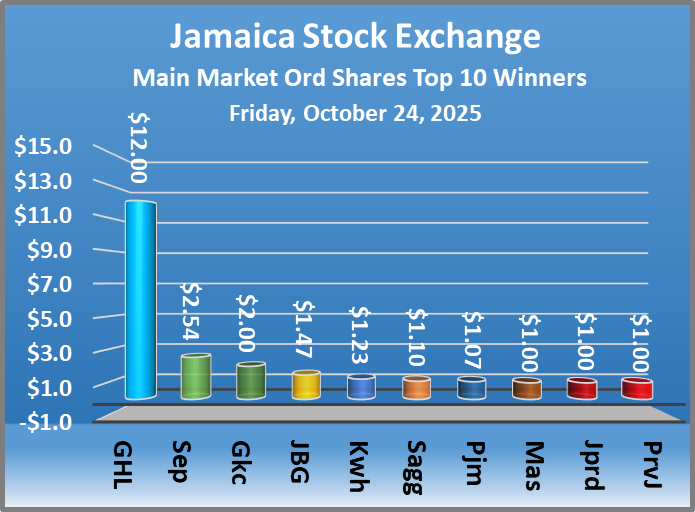 The market closed with 7,520,061 shares trading for $49,523,282, down from 10,363,654 stock units at $145,134,187 on Thursday.
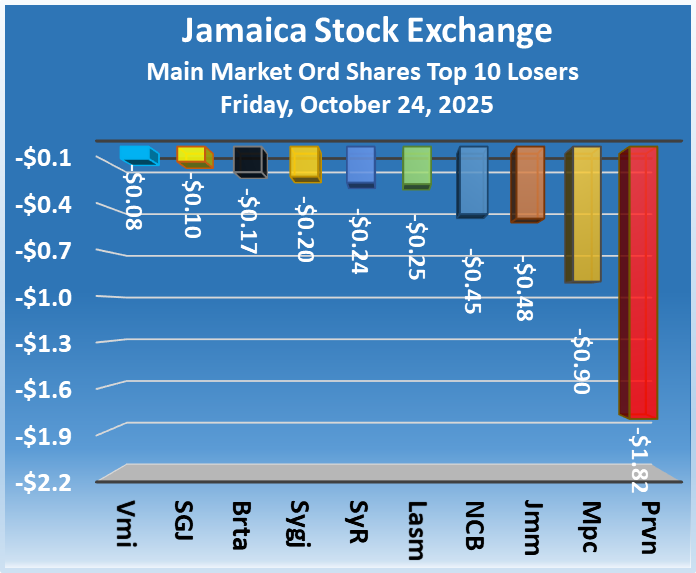 The Main Market ended trading with an average PE Ratio of 13.5. The JSE Main and the USD Market PE ratios are based on last traded prices and earnings forecasts by ICInsider.com for companies with the financial year ending around August 2026.
 Massy Holdings gained $1 in closing at $77.50 in trading 396 shares, MPC Caribbean Clean Energy sank 90 cents to finish at $41.60 after 150 stock units passed through the market, NCB Financial skidded 45 cents to end at $41.40 in switching ownership of 73,277 units. Pan Jamaica popped $1.07 to $49.10 with investors trading 50,201 stocks, Sagicor Group climbed $1.10 to finish at $41.21 in an exchange of 81,825 units, Seprod increased $2.54 and ended at $79.59 with investors swapping 10,971 shares and Wisynco Group rallied $1 to close at $21 with a transfer of 68,841 stocks.
 Investments 10% rallied 90 cents to $104.78 after an exchange of 850 stocks and Sygnus Credit Investments C10.5% rose $4.90 to finish at $104.90 with investors trading 45 units.
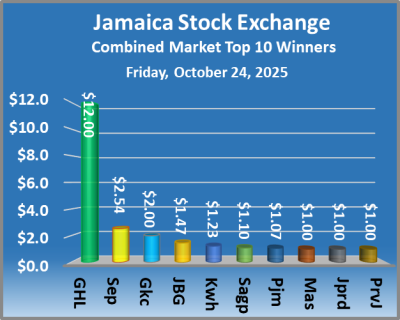 At the close of the market, the JSE Combined Market Index popped 3,518.66 points to wrap up trading at 334,489.99, the All Jamaican Composite Index rallied 4,292.44 points to end at 367,664.97, the JSE Main Index rallied 3,280.95 points to close at 323,843.10, the Junior Market Index bounced by 53.38 points to 3,463.93 and the JSE USD Market Index climbed by 1.04 points to 197.60.
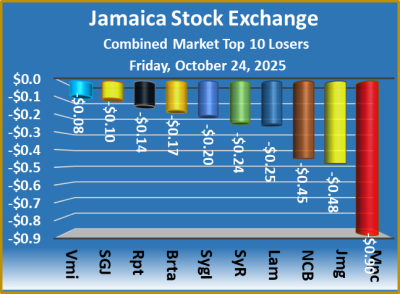 The PE ratio chart covers all ordinary shares are listed on the Jamaica Stock Exchange, grouped by industry, allowing for easy comparisons within a sector and the overall market. The earnings per share (EPS) and PE ratios are based on the 2024 and 2025 actual or projected earnings, excluding any major one time income or expense.
 Investors can use this measure in assessing stock values. The chart also shows daily changes in stock prices and the percentage year to date price movement based on the last traded prices. Dividends that are paid or are due to be paid and yields for each company are shown in the Main and Junior Markets’ daily report charts, along with the closing volume of the highest bid and the lowest offer for each company.
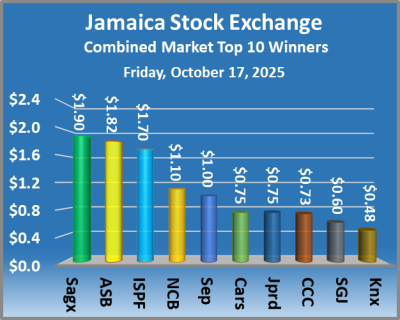
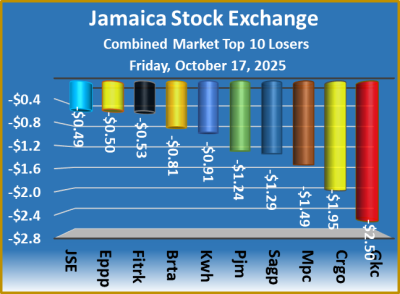
 The market closed with trading of 10,363,654 shares at $145,134,187 compared with 17,740,083 stocks at $182,300,899 on Wednesday.
 The Main Market ended trading with an average PE Ratio of 13.5. The JSE Main and the USD Market PE ratios are based on last traded prices and earnings forecasts by ICInsider.com for companies with the financial year ending around August 2026.
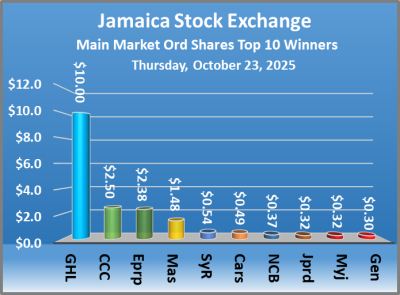
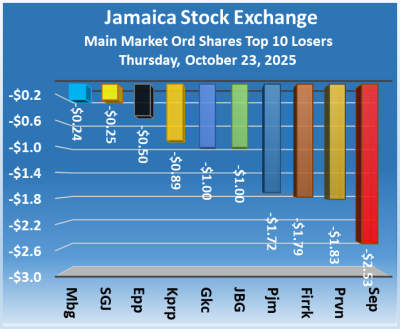
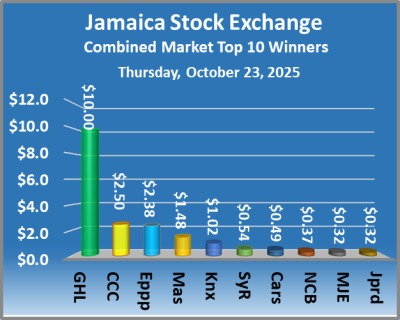
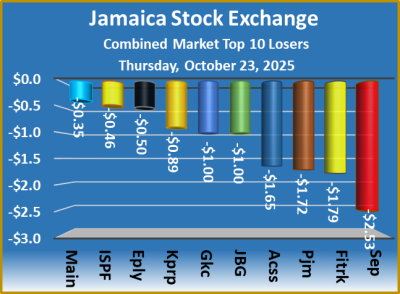
 Kingston Properties slipped 89 cents and ended at $8.11, with 4,574 stock units crossing the exchange. Massy Holdings climbed $1.48 to end at $76.50 with a transfer of 1,347 shares, NCB Financial popped 37 cents in closing at $41.85, with 48,760 units changing hands, Pan Jamaica fell $1.72 to close at $48.03 in an exchange of 19,910 stocks. Seprod skidded $2.53 to $77.05, with 11,182 stock units clearing the market and Sygnus Real Estate Finance gained 54 cents in closing at $8.49 in switching ownership of 2,179 shares.
 Prices of securities trading are those for the last transaction of each stock unless otherwise stated.
 At the close of the market, the JSE Combined Market Index climbed 1,372.07 points to conclude trading at 330,971.33, the All Jamaican Composite Index rallied 1,550.84 points to settle at 363,372.53, the JSE Main Index increased by 1,541.93 points to 320,562.15, the Junior Market Index slipped 14.57 points to 3,410.55 and the JSE USD Market Index increased 2.94 points to 196.56.
 The ICInsider.com PE ratio chart and the other, more detailed daily charts provide regularly updated information to help decision-making. The PE ratio chart covers all ordinary shares listed on the Jamaica Stock Exchange, grouped by industry, allowing for easy comparisons within a sector and the overall market. Earnings per share (EPS) and PE ratios are based on 2024 and 2025 actual or projected earnings, excluding any major one time income or expense.
 The net asset value of each company is incorporated into the chart. Investors can use this measure in assessing stock values. The chart also shows daily changes in stock prices and the percentage year to date price movement based on the last traded prices. Dividends that are paid or are due to be paid and yields for each company are shown in the Main and Junior Markets’ daily report charts, along with the closing volume of the highest bid and the lowest offer for each company.
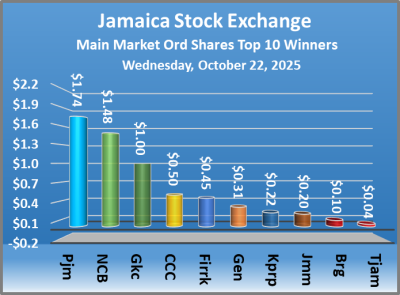 The market closed with 17,740,083 shares trading worth $182,300,899 compared to 11,741,183 stock units at $54,384,733 on Tuesday.
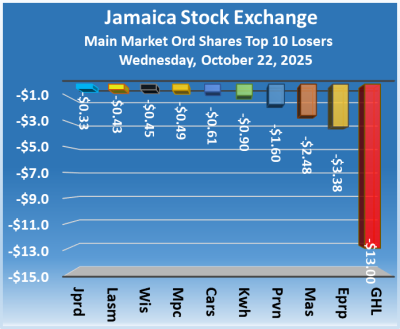 The Main Market ended trading with an average PE Ratio of 13.3. The JSE Main and the USD Market PE ratios are based on last traded prices and earnings that are forecasted by ICInsider.com for companies with the financial year ending around August 2026.
 Massy Holdings fell $2.48 and ended at $75.02 with investors swapping 217,602 stocks. MPC Caribbean Clean Energy declined 49 cents to close at $42.50 after a transfer of 500 units, NCB Financial advanced $1.48 to end at $41.48, with trading of 30,851 shares, Pan Jamaica rallied $1.74 in closing at $49.75 in an exchange of 21,692 stock units and Wisynco Group shed 45 cents to $20, with 1,710,620 stocks clearing the market.
 Prices of securities trading are those for the last transaction of each stock unless otherwise stated.
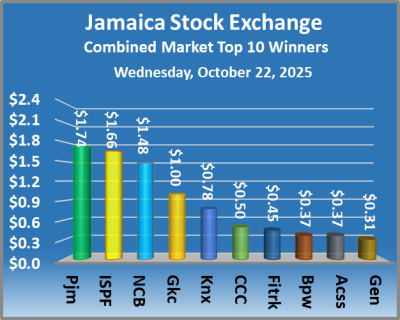 At the close of the market, the JSE Combined Market Index skidded 2,873.87 points to 329,599.26, the All Jamaican Composite Index dropped 4,239.29 points to settle at 361,821.69, the JSE Main Index sank 3,408.36 points to wrap up trading at 319,020.22, the Junior Market Index gained a solid 54.61 points to end at 3,425.12 and the JSE USD Market Index slipped a mere 0.22 points to 193.62.
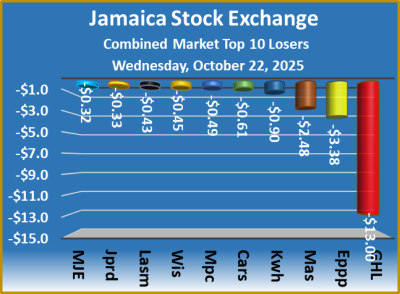 The PE ratio chart covers all ordinary shares listed on the Jamaica Stock Exchange, grouped by industry, allowing for easy comparisons within a sector and the overall market. The earnings per share (EPS) and PE ratios are based on 2024 and 2025 actual or projected earnings, excluding any major one time income or expense.
 The net asset value of each company is incorporated into the chart. Investors can use this measure in assessing stock values. The chart also includes daily changes in stock prices and the percentage year to date price movement based on the last traded prices. Dividends that are paid or are due to be paid and yields for each company are shown in the Main and Junior Markets’ daily report charts, along with the closing volume of the highest bid and the lowest offer for each company.
 At the close of the market, the JSE Combined Market Index rose 17.35 points to 332,473.13, the All Jamaican Composite Index increased 16.66 points to 366,060.98, the JSE Main Index sank with a mere 50.92 points to 322,428.58. The Junior Market Index gained 9.31 points to settle at 3,370.51 and the JSE USD Market Index slipped 0.51 points to finish at 193.84.
 The PE ratio chart covers all ordinary shares listed on the Jamaica Stock Exchange, grouped by industry, allowing for easy comparisons within a sector and the overall market. The earnings per share (EPS) and PE ratios are based on 2024 and 2025 actual or projected earnings, excluding any major one time income or expense.
 The net asset value of each company is incorporated into the chart. Investors can use this measure in assessing stock values. The chart also shows daily changes in stock prices and the percentage year to date price movement based on the last traded prices. Dividends that are paid or are due to be paid and yields for each company are shown in the Main and Junior Markets’ daily report charts, along with the closing volume of the highest bid and the lowest offer for each company.
 At the close of the market, the JSE Combined Market Index gained 788.72 points to end trading at 332,455.78, at the same time the All Jamaican Composite Index gained 497.57 points to settle at 366,044.32, the JSE Main Index climbed 880.49 points to wrap up trading at 322,479.50, the Junior Market Index slipped 7.59 points to end at 3,361.20 and the JSE USD Market Index rallied 2.26 points to 194.35.
 The ICInsider.com PE ratio chart and the other more detailed daily charts provide investors with regularly updated information to help decision-making. The PE ratio chart includes all ordinary shares that are listed on the Jamaica Stock Exchange, and grouped by industry, allowing for easy comparisons within a sector and the overall market. The earnings per share (EPS) and PE ratios are based on 2024 and 2025 actual or projected earnings, excluding any major one time income or expense.
 The net asset value of each company is incorporated into the chart. Investors can use this measure in assessing stock values. The chart also shows daily changes in stock prices and the percentage year to date price movement based on the last traded prices. Dividends that are paid or are due to be paid and yields for each company are shown in the Main and Junior Markets’ daily report charts, along with the closing volume of the highest bid and the lowest offer for each company.
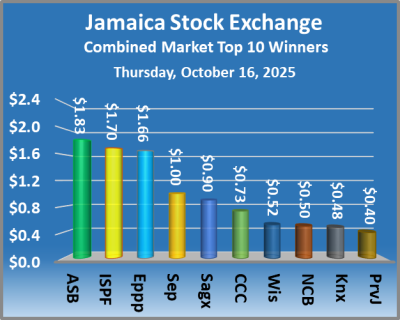 At the close of the market, the JSE Combined Market Index dropped 842.07 points to 331,667.06, the All Jamaican Composite Index lost 1,750.78 points to end at 365,546.75, the JSE Main Index skidded 930.58 points to wrap up trading at 321,599.01, the Junior Market Index popped 6.82 points to end at 3,368.79 and the JSE USD Market Index dipped 1.19 points to 192.09.
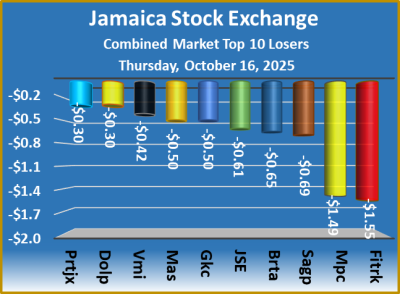 The ICInsider.com PE ratio chart and the other, more detailed daily charts provide regularly updated information to help decision-making. The PE ratio chart covers all ordinary shares listed on the Jamaica Stock Exchange and grouped by industry, allowing for easy comparisons within a sector and the overall market. The earnings per share (EPS) and PE ratios are based on actual 2024 and projected 2025 earnings, excluding any major one time income or expense.
 The net asset value of each company is incorporated into the chart. Investors can use this measure in assessing stock values. The chart also shows daily changes in stock prices and the percentage year to date price movement based on the last traded prices. Dividends that are paid or are due to be paid and yields for each company are shown in the Main and Junior Markets’ daily report charts, along with the closing volume of the highest bid and the lowest offer for each company.