Trading jumped sharply on the Jamaica Stock Exchange Main Market on Monday with a marginal decline in the volume traded with a 164 percent surge in value over Friday, resulting in trading in 57 securities compared to 53on Friday, with 17 rising, 25 declining and 15 ending unchanged.
 A total of 11,450,226 shares were traded for $243,197,157 versus 11,840,614 units at $92,145,603 on Friday.
Trading averaged 200,881 units at $4,266,617 versus 223,408 shares at $1,738,596 on Friday and month to date, an average of 181,268 units at $2,347,445 compared to 178,739 units at $2,099,950 on the previous day. Trading in January averaged 205,236 units at $1,805,558.
Scotia Group led trading with 4.13 million shares for 36.1 percent of total volume followed by QWI Investments with 1.51 million units for 13.2 percent of the day’s trade, Wigton Windfarm with 1.51 million units for 13.2 percent and Transjamaican Highway with 1.01 million units for 8.8 percent market share.
The All Jamaican Composite Index dropped 1,641.15 points to 379,404.43, the JSE Main Index fell 1,138.54 points to 335,146.88 and the JSE Financial Index shed 0.10 points to close at 80.20.
 The PE Ratio, a formula to ascertain appropriate stock values, averages 14 for the Main Market. The JSE Main and USD Market PE ratios incorporate earnings forecasted by ICInsider.com for companies with the financial year ending between November 2022 and August 2023.
Investor’s Choice bid-offer indicator shows 13 stocks ending with bids higher than their last selling prices and three with lower offers.
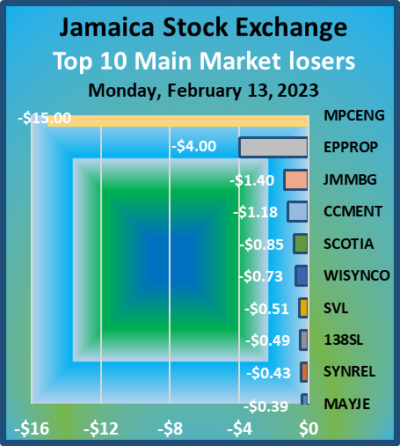
At the close, Caribbean Cement dropped $1.18 to $58 with a transfer of 63,366 shares, Eppley Caribbean Property Fund declined $4 in closing at $42 as investors traded 1,619 stock units, Guardian Holdings advanced $4.30 in ending at $510 with 40,354 stocks crossing the market. JMMB Group shed $1.40 to close at $32 trading 15,984 units, Mayberry Investments popped 69 cents to end at $8.50 after exchanging 4,120 stocks, MPC Caribbean Clean Energy dropped $15 to finish at $71 with 100 units changing hands. 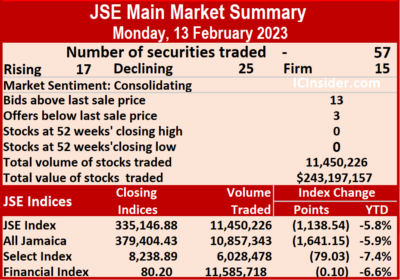 NCB Financial rose $3 to close at $78 after a transfer of 4,277 shares, 138 Student Living lost 49 cents to settle at $4.51 after 3,019 stock units passed through the market, Palace Amusement climbed $22.90 to $2,325 in switching ownership of 64 units. Proven Investments fell $1.30 in closing at $28 after trading 1,130 stock units, Sagicor Group gained 50 cents to end at $53.50 with investors transferring 1,645 stocks, Scotia Group dipped 85 cents in closing at $34 with an exchange of 4,131,234 shares. Seprod rose $1 to end at $65 with the swapping of 7,501 stock units, Stanley Motta rallied 52 cents to close at $4.82 after an exchange of 4,980 units, Supreme Ventures shed 51 cents in ending at $26.49 in transferring 365,798 stocks. Sygnus Credit Investments USD share gained $1.90 to finish at $20.90 after clearing the market with 12 shares, Sygnus Real Estate Finance lost 43 cents in closing at $9.07 as investors traded 1,000 shares,
 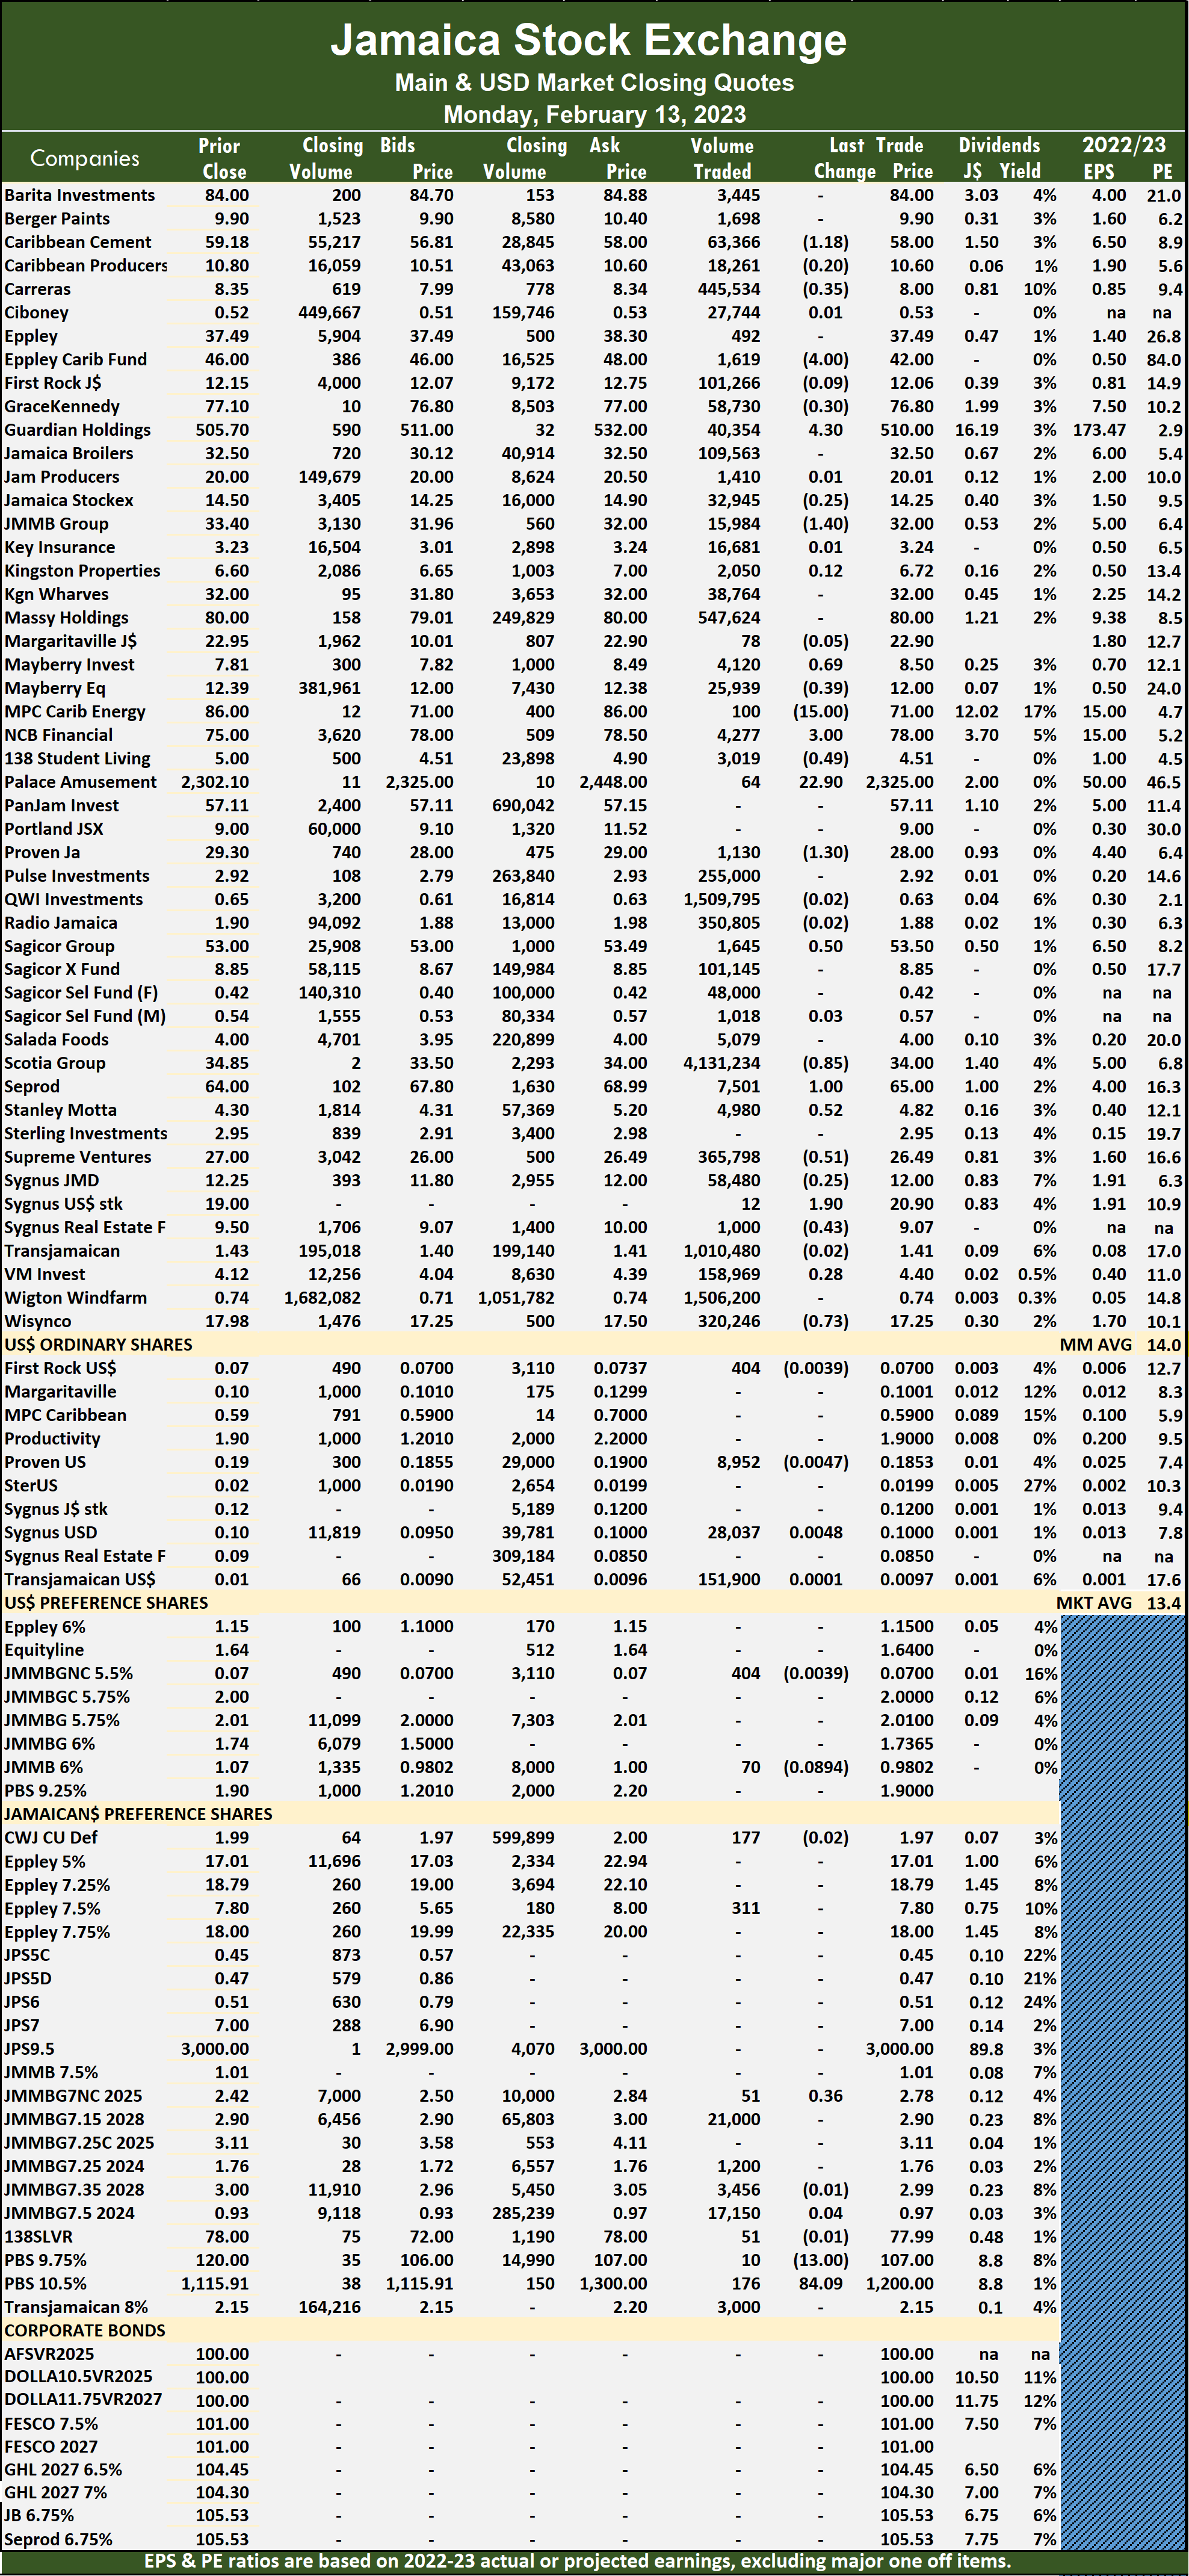 Wisynco Group fell 73 cents to $17.25 with the swapping of 320,246 units.
In the preference segment, Productive Business 10.50% preference share climbed $84.09 to close at $1,200 after exchanging 176 stocks and Productive Business Solutions 9.75% preference share dropped $13 to end at $107 with a transfer of 10 stock units.
Prices of securities trading are those for the last transaction of each stock unless otherwise stated.
Trading drops on JSE Main Market
Trading dropped on the Jamaica Stock Exchange Main Market on Friday with a 30 percent drop in the volume of stocks traded at a 77 percent lower value than on Thursday, after trading in 53 securities up from 51 on Thursday, resulting in prices of stocks 24 rising, 19 declining and 10 ending unchanged.
 A total of 11,840,614 shares were traded for $92,145,603 compared to 16,899,213 units at $398,378,363 on Thursday.
Trading averaged 223,408 shares at $1,738,596 compared to 331,357 shares at $7,811,340 on Thursday and month to date, an average of 178,739 stock units at $2,099,950 compared with 172,653 stocks at $2,149,183 on the previous day. January closed with an average of 205,236 units at $1,805,558.
Sagicor Select Financial Fund led trading with 4.40 million shares for 37.1 percent of total volume followed by Wigton Windfarm with 2.34 million units for 19.7 percent of the day’s trade and Transjamaican Highway with 1.21 million units for 10.2 percent market share.
The All Jamaican Composite Index advanced 466.42 points to 381,045.58, the JSE Main Index rose 302.30 points to close at 336,285.42 and the JSE Financial Index rallied 0.57 points to settle at 80.30.
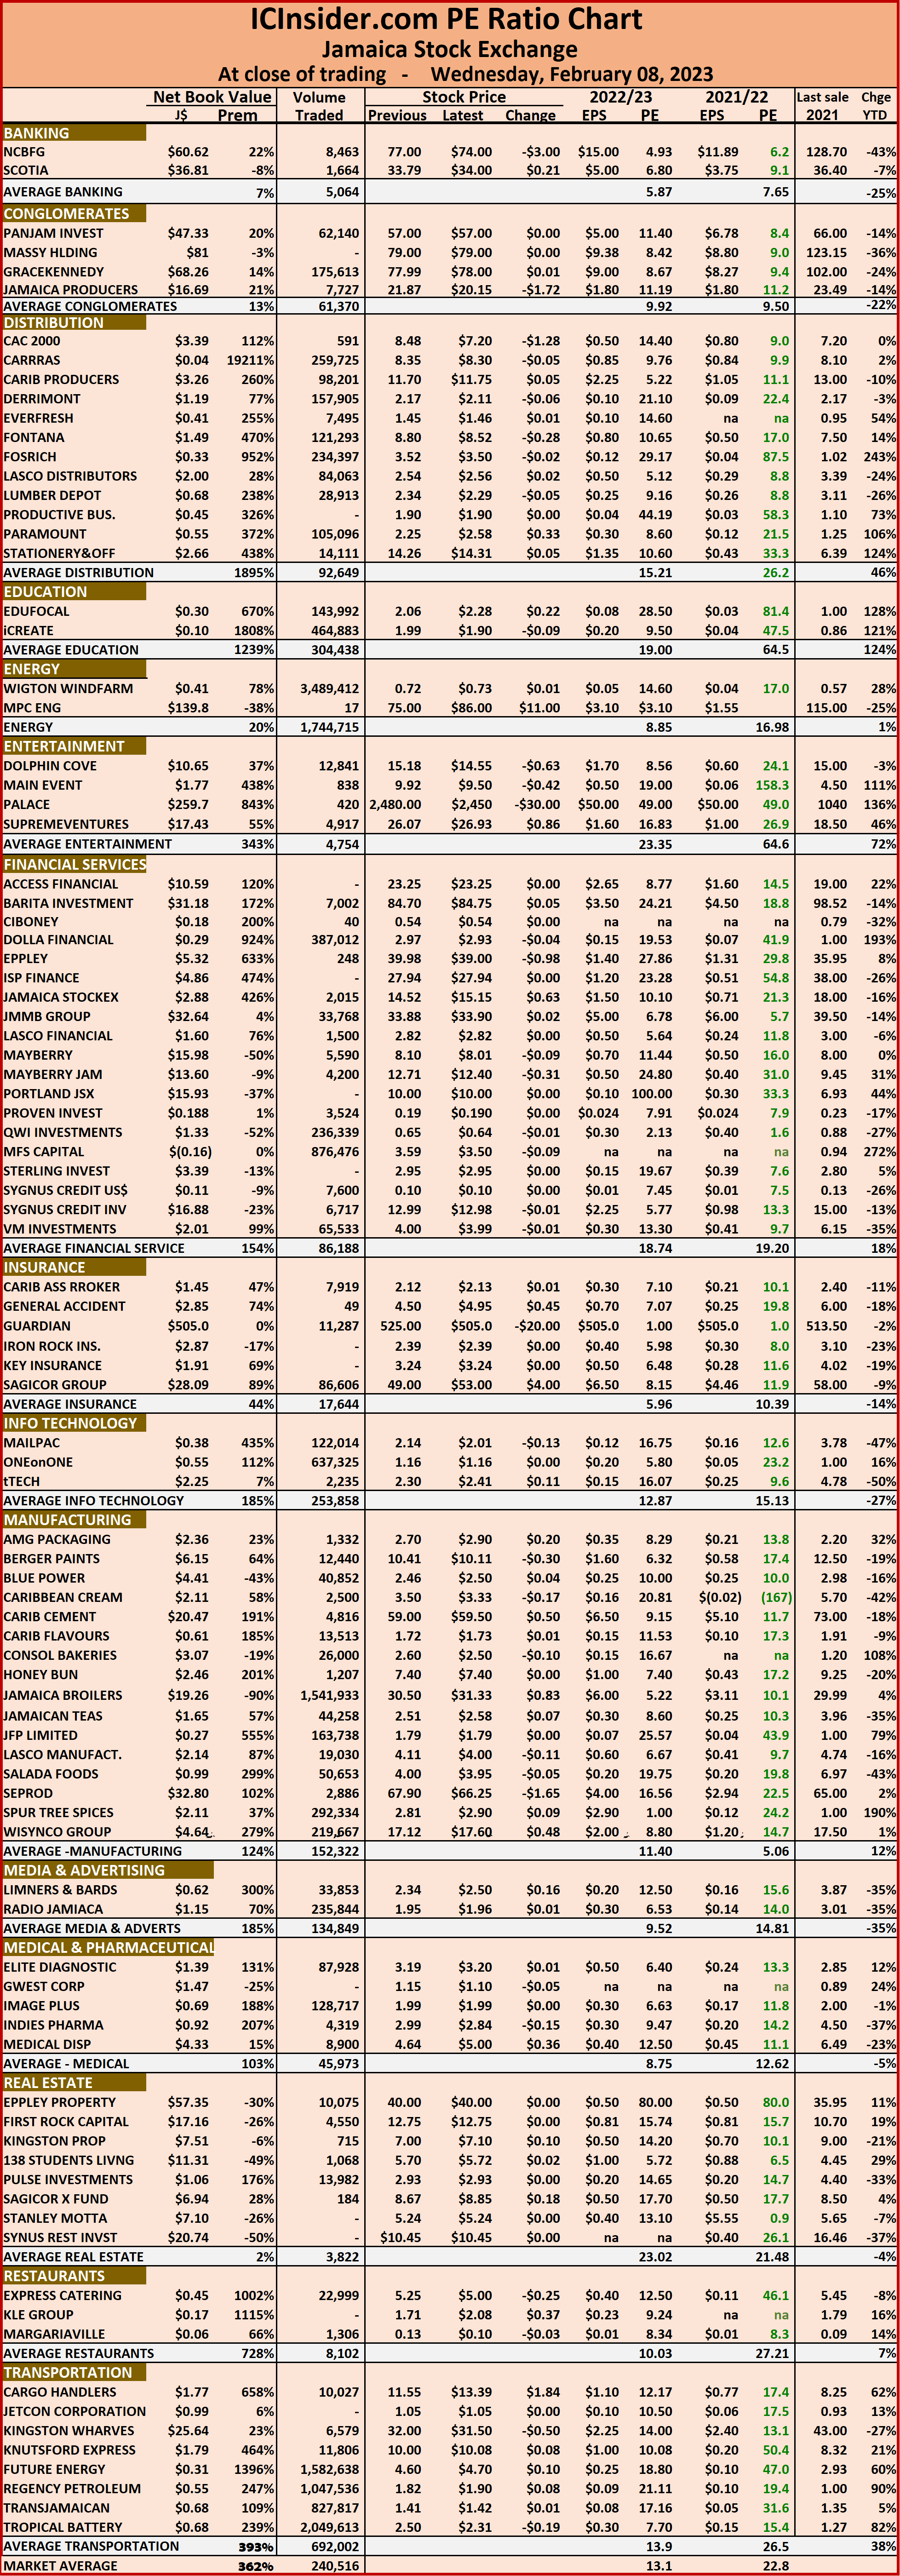
 The PE Ratio, a formula to ascertain appropriate stock values, averages 14.2 for the Main Market. The JSE Main and USD Market PE ratios are computed based on the last traded price and earnings forecasted by ICInsider.com for companies with the financial year ending between November 2022 and August 2023.
Investor’s Choice bid-offer indicator shows 12 stocks ending with bids higher than their last selling prices and five with lower offers.
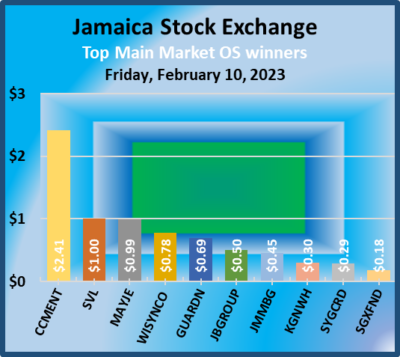
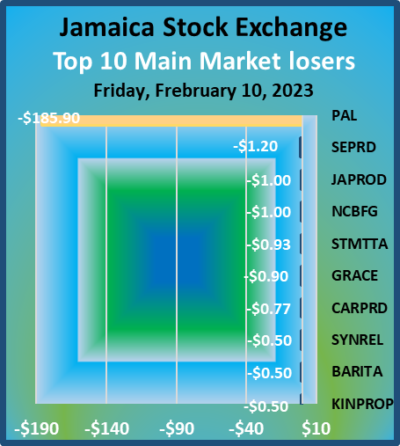
At the close, Barita Investments lost 50 cents in closing at $84 in trading 4,996 shares, Caribbean Cement advanced $2.41 to $59.18 with a transfer of 26,011 units, Caribbean Producers dipped 77 cents to $10.80 with 274,070 stock units changing hands after trading at an intraday 52 weeks’ low of $10.19 following the release of half year results showing reduced profit in the December quarter compared with that of 2021. GraceKennedy shed 90 cents to end at $77.10 after an exchange of 174,611 stocks, Guardian Holdings rallied 69 cents to close at $505.70 with the swapping of 20,423 shares, 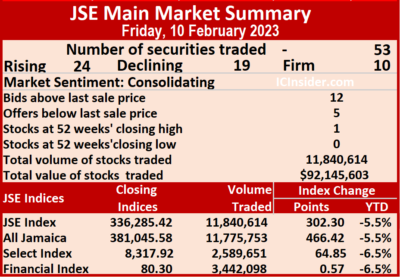 Jamaica Broilers gained 50 cents in closing at a 52 weeks’ high of $32.50 after 946,442 stocks passed through the market. Jamaica Producers fell $1 in ending at $20 after trading 32,439 stock units, JMMB Group popped 45 cents to close at $33.40 with investors transferring 83,865 units, Kingston Properties shed 50 cents to finish at $6.60 in an exchange of 147,000 units. Mayberry Jamaican Equities rose 99 cents to end at $12.39 in switching ownership of 49,660 stocks, NCB Financial declined $1 in closing at $75 with the swapping of 27,651 stock units, Palace Amusement dropped $185.90 to close at $2,302.10 while trading 549 shares. Seprod dipped $1.20 to end at $64 with an exchange of 25,136 units, Stanley Motta fell 93 cents to settle at $4.30 with 47,129 shares changing hands, Supreme Ventures rose $1 to $27 in an exchange of 25,496 stock units.
 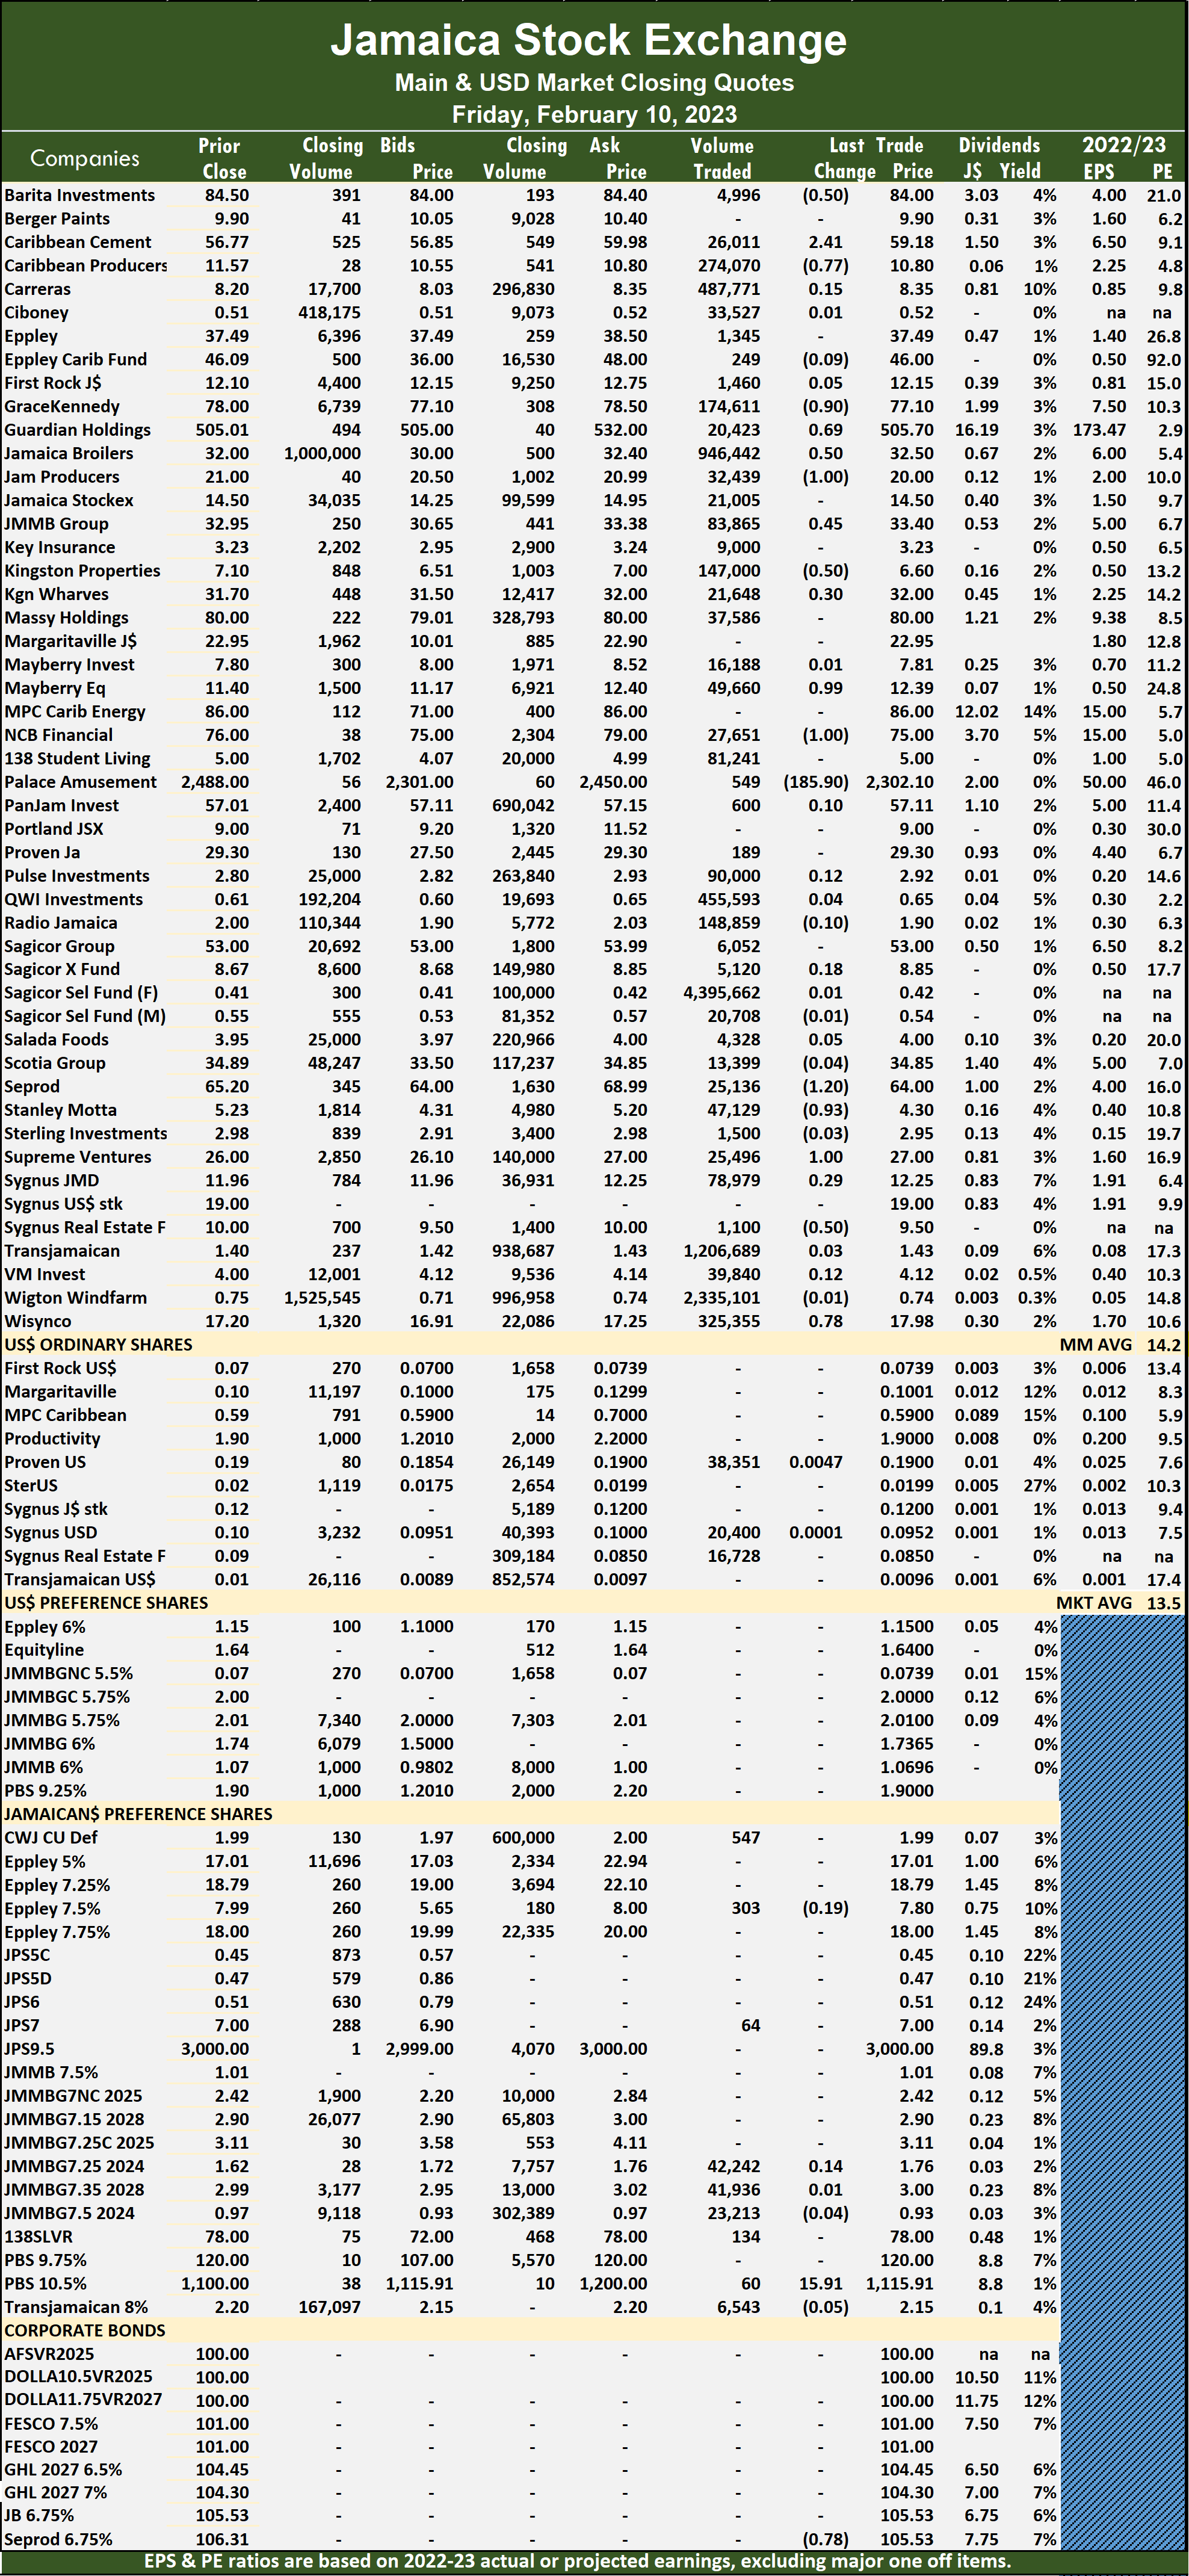 Sygnus Real Estate Finance shed 50 cents to end at $9.50 after 1,100 stocks cleared the market and Wisynco Group popped 78 cents in closing at $17.98 in a transfer of 325,355 units.
In the preference segment, Productive Business 10.50% preference share advanced $15.91 to end at $1,115.91 trading 60 stocks.
Prices of securities trading are those for the last transaction of each stock unless otherwise stated.
Trading picks for JSE Main Market
Trading jumped sharply on the Jamaica Stock Exchange Main Market on Thursday with the volume of stocks traded jumping 78 percent with the value surging 323 percent above Wednesday’s level, after an exchange of 51 securities compared to 52 on the previous day, with 19 rising, 27 declining and five ending unchanged.
 A total of 16,899,213 shares were exchanged for $398,378,363 versus 9,512,250 units at $94,127,743 on Wednesday.
Trading averaged 331,357 units at $7,811,340 compared with 182,928 shares at $1,810,149 on Wednesday and month to date, an average of 172,653 units at $2,149,183 compared with 148,706 units at $1,294,834 on the previous day. January closed with an average of 205,236 units at $1,805,558.
Kingston Wharves led trading with 6.18 million shares for 36.6 percent of total volume followed by Wigton Windfarm with 4.13 million units for 24.4 percent of the day’s trade and Sagicor Select Financial Fund with 966,026 units for 5.7 percent market share.
The All Jamaican Composite Index advanced 1,288.52 points to 380,579.16, the JSE Main Index rose 1,520.99 points to 335,983.12 and the JSE Financial Index gained 0.43 points to end at 79.73.
 The PE Ratio, a formula to ascertain appropriate stock values, averages 14.3 for the Main Market. The JSE Main and USD Market PE ratios incorporate earnings forecasted by ICInsider.com for companies with the financial year ending between November 2022 and August 2023.
Investor’s Choice bid-offer indicator shows 12 stocks ending with bids higher than their last selling prices and one stock with a lower offer.
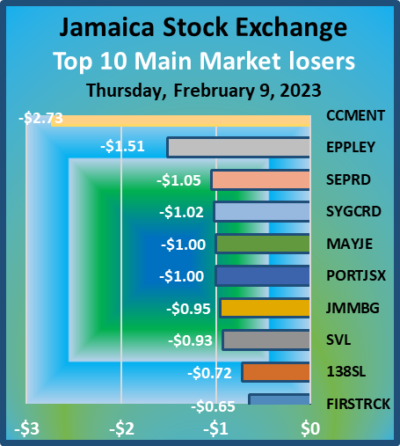
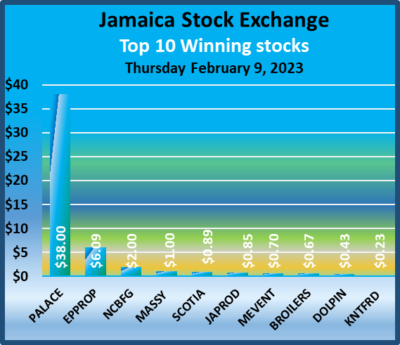
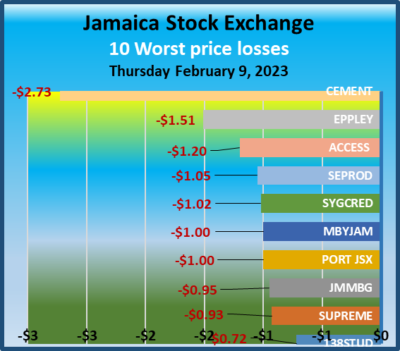
At the close, Caribbean Cement declined $2.73 in closing at $56.77 with an exchange of 302,365 shares, Eppley fell $1.51 to end at $37.49 after 2,522 stock units were traded, Eppley Caribbean Property Fund advanced $6.09 to finish at $46.09 with 52 stocks crossing the market. First Rock Real Estate shed 65 cents to settle at $12.10 in transferring 26,411 units, Jamaica Broilers rose 67 cents to close at $32 with 699,263 stocks clearing the market, Jamaica Producers popped 85 cents to close at $21 with the swapping of 500,397 stock units. 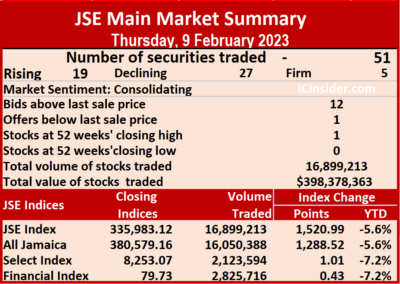 Jamaica Stock Exchange shed 65 cents to end at $14.50 in exchanging 2,345 units, JMMB Group fell 95 cents to $32.95 in switching ownership of 6,127 shares, Massy Holdings gained $1 to close at $80 as investors traded 848,567 shares. Mayberry Jamaican Equities lost $1 in ending at $11.40 with the swapping of 1,344 stock units, NCB Financial popped $2 to finish at $76 in an exchange of 20,998 units, 138 Student Living lost 72 cents to end at $5 in switching ownership of 103,573 stocks. Palace Amusement climbed $38 in closing at $2,488 after 272 shares passed through the market, Portland JSX shed $1 after ending at $9 as investors traded 299,950 stock units, Proven Investments advanced $2.80 to $29.30 in trading 6,447 stocks. Scotia Group rose 89 cents to $34.89 with an exchange of 41,685 units, Seprod fell $1.05 to end at $65.20 with investors transferring 6,225 shares, Supreme Ventures declined 93 cents in closing at $26 with the swapping of 101,847 units. Sygnus Credit Investments dipped $1.02 to t $11.96 after an exchange of 8,965 stocks,
 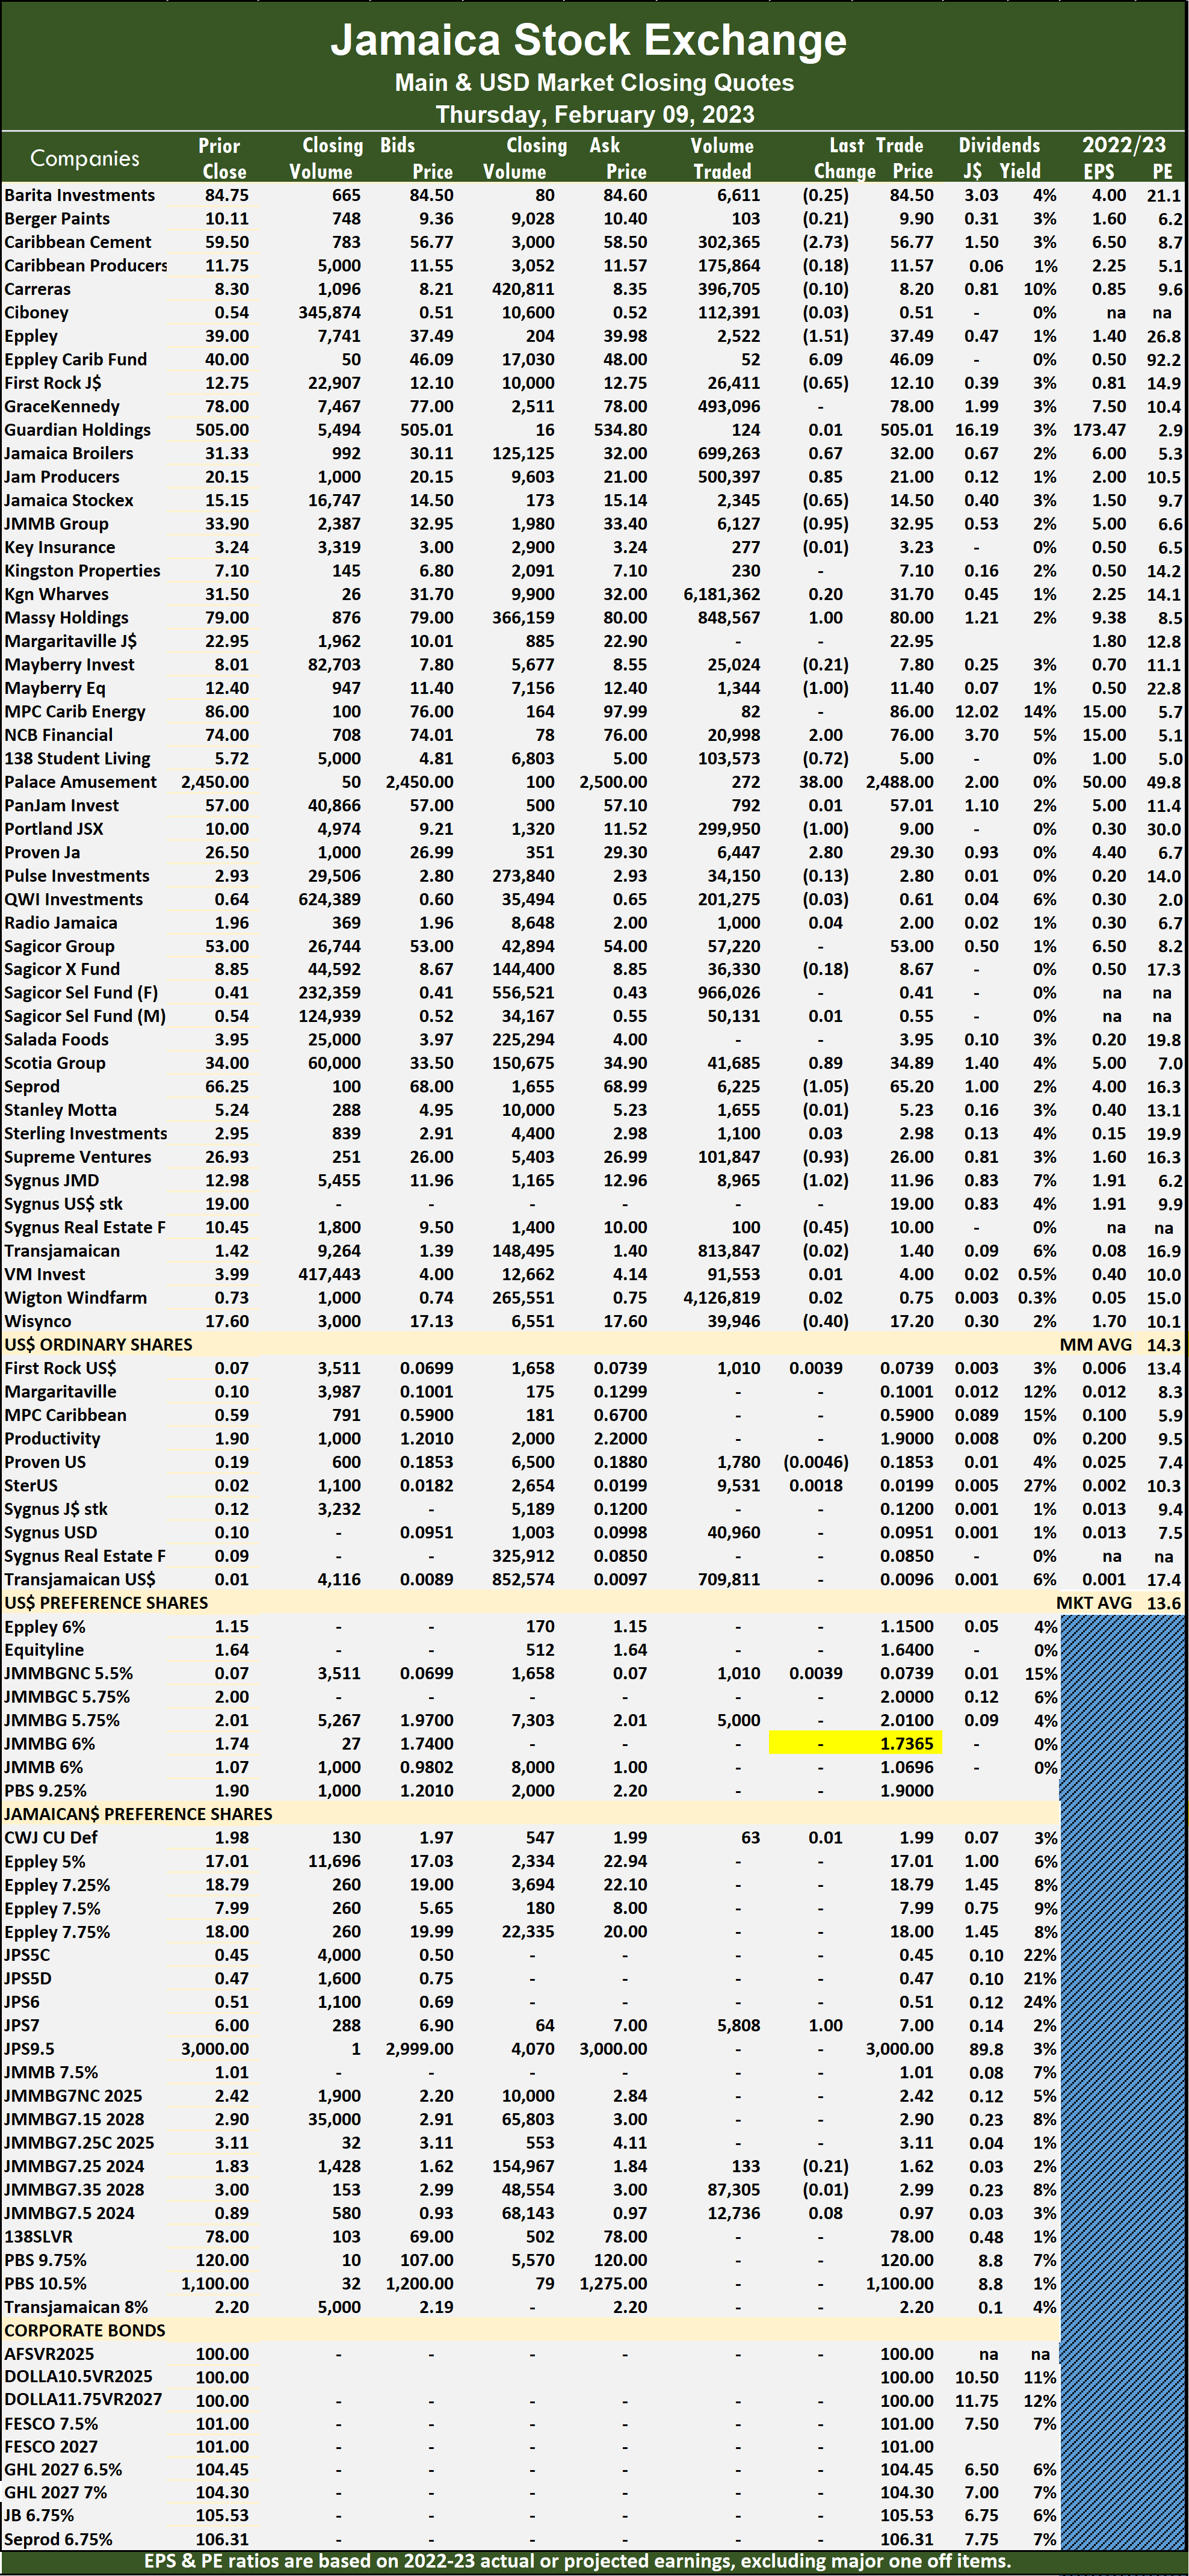 Sygnus Real Estate Finance shed 45 cents in ending at $10 with a transfer of 100 stock units and Wisynco Group dipped 40 cents to close at $17.20 as investors switched ownership of 39,946 stock units.
In the preference segment, Jamaica Public Service 7% advanced $1 in closing at a 52 weeks’ high of $7 after a transfer of 5,808 shares.
Prices of securities trading are those for the last transaction of each stock unless otherwise stated.
Trading surged on the Jamaica Stock Exchange
The Main and the Junior markets of the Jamaica Stock Exchange rose moderately at the close of trading on Thursday, but the USD Markets slipped, resulting from the volume and value of stocks trading surging over Wednesday’s levels.
 Trading ended with 24,448,717 shares changing hands in all three markets, up from 18,817,620 units on Wednesday, valued at $415.7 million, compared with $120.2 million the previous day. Trading on the JSE USD market resulted in investors exchanging the shares traded for US$20,748 versus US$4,280 on Wednesday.
At the close, the Combined Market Index inched 1,542.26 points higher to 349,398.85, the All Jamaican Composite Index rallied 1,288.52 points to 380,579.16, the JSE Main Index rallied 1,520.99 points to 335,983.12, the Junior Market popped 13.50 points to 3,919.02 and the JSE US dollar market dipped 1.15 points to end at 231.63.
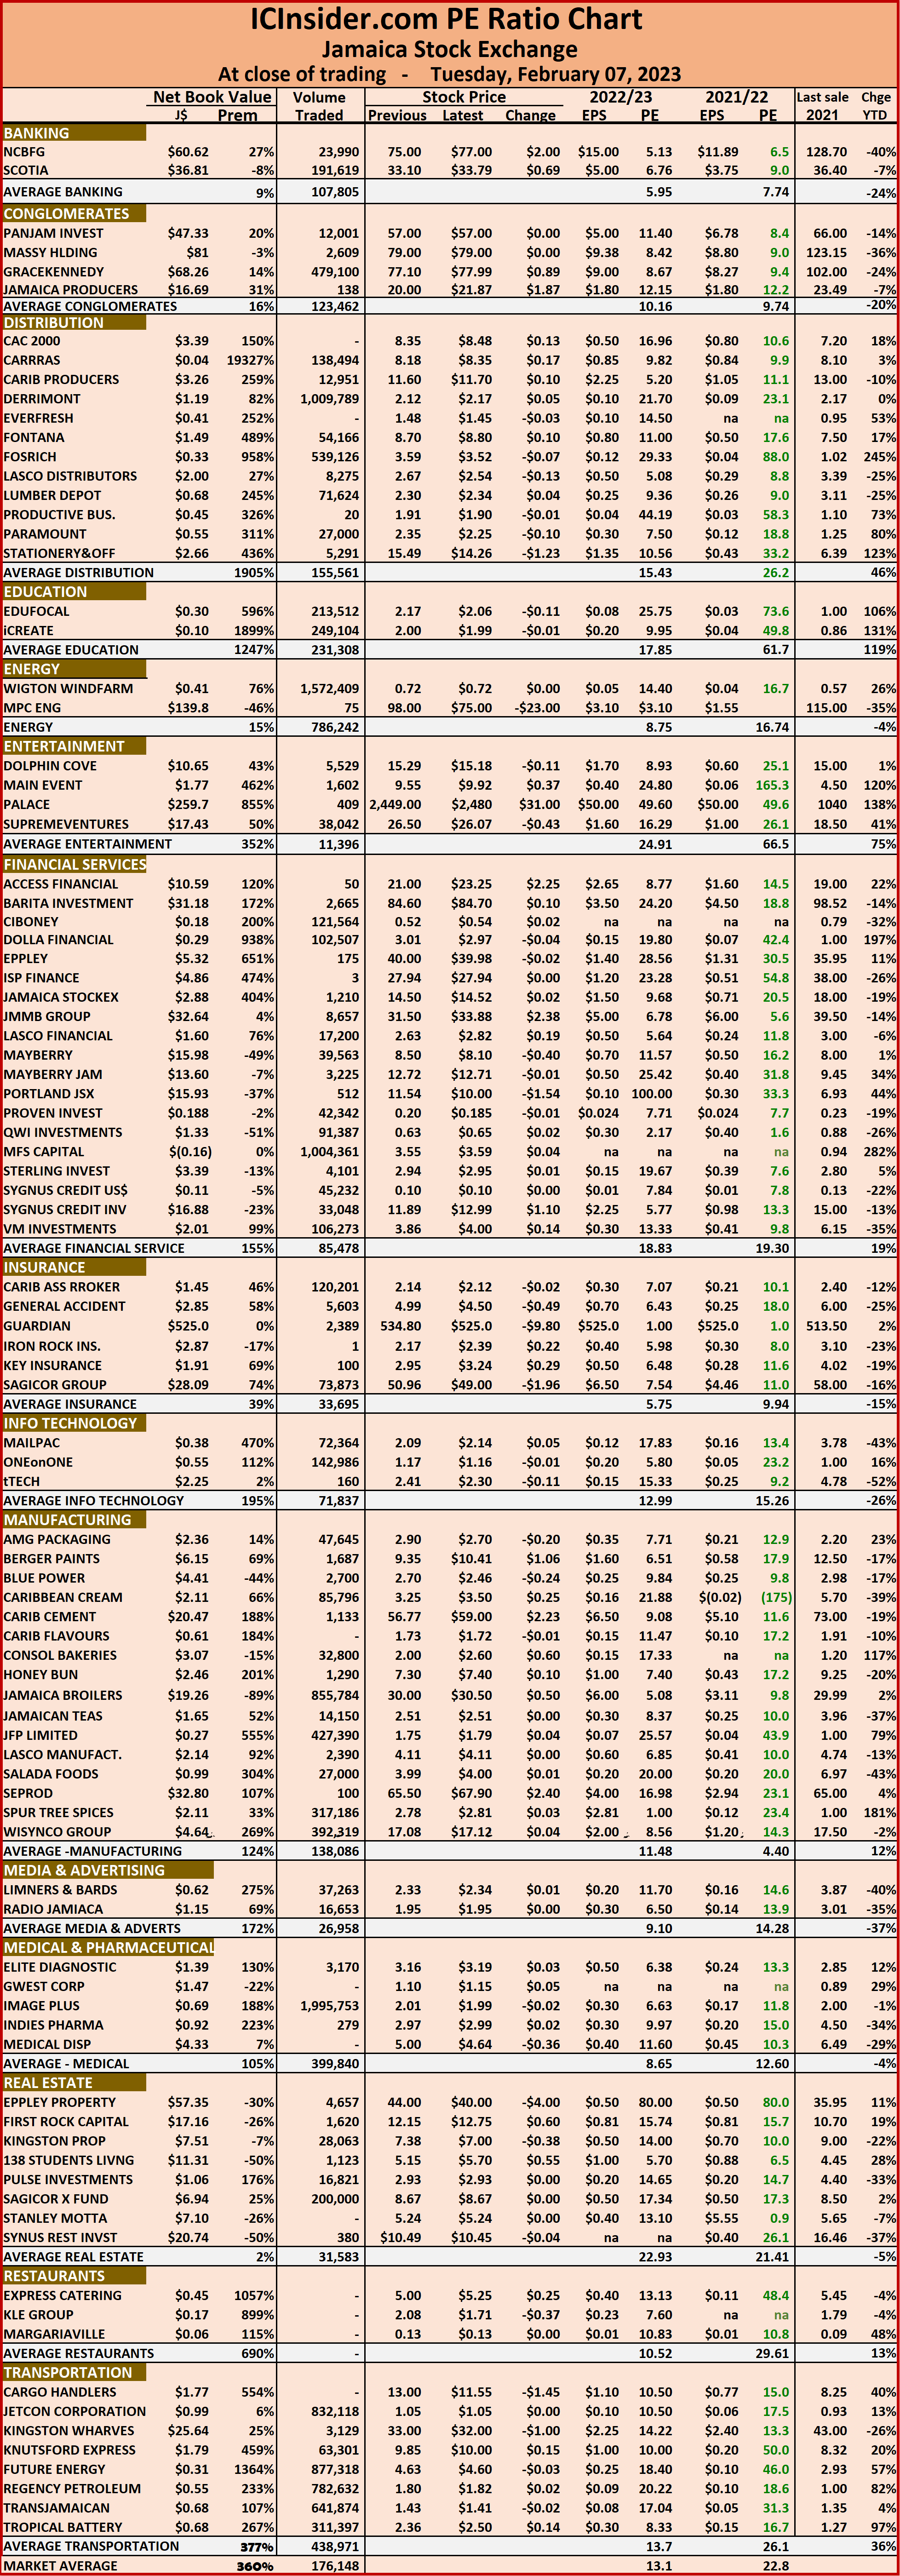
The market’s PE ratio ended at 22.8 based on 2021-22 earnings and 13.1 times those for 2022-23 at the close of trading.
 Investors need pertinent information to navigate many investment options in stock markets successfully. The ICInsider.com PE ratio chart and the more detailed daily report charts provide investors with regularly updated information to help decision-making.
Investors should use the chart to help make rational investment decisions by investing in stocks close to the average for the sector and not going too far from it unless there are compelling reasons to do so. This approach helps to remove emotions from investment decisions and put in on fundamentals while at the same time not being too far from the majority of investors. Investors who buy when the price of a stock is close to the average will find that they are not inclined to overpay for a stock.
The ICInsider.com PE Ratio chart covers all ordinary shares on the Jamaica Stock Exchange. It shows companies grouped on an industry basis, allowing easy comparisons between the same sector companies and the overall market.
The net asset value of each company is reported as a guide to assess the value of stocks based on this measure quickly. The chart also shows daily changes in stock prices and the percentage year to date price movement based on the last traded prices. 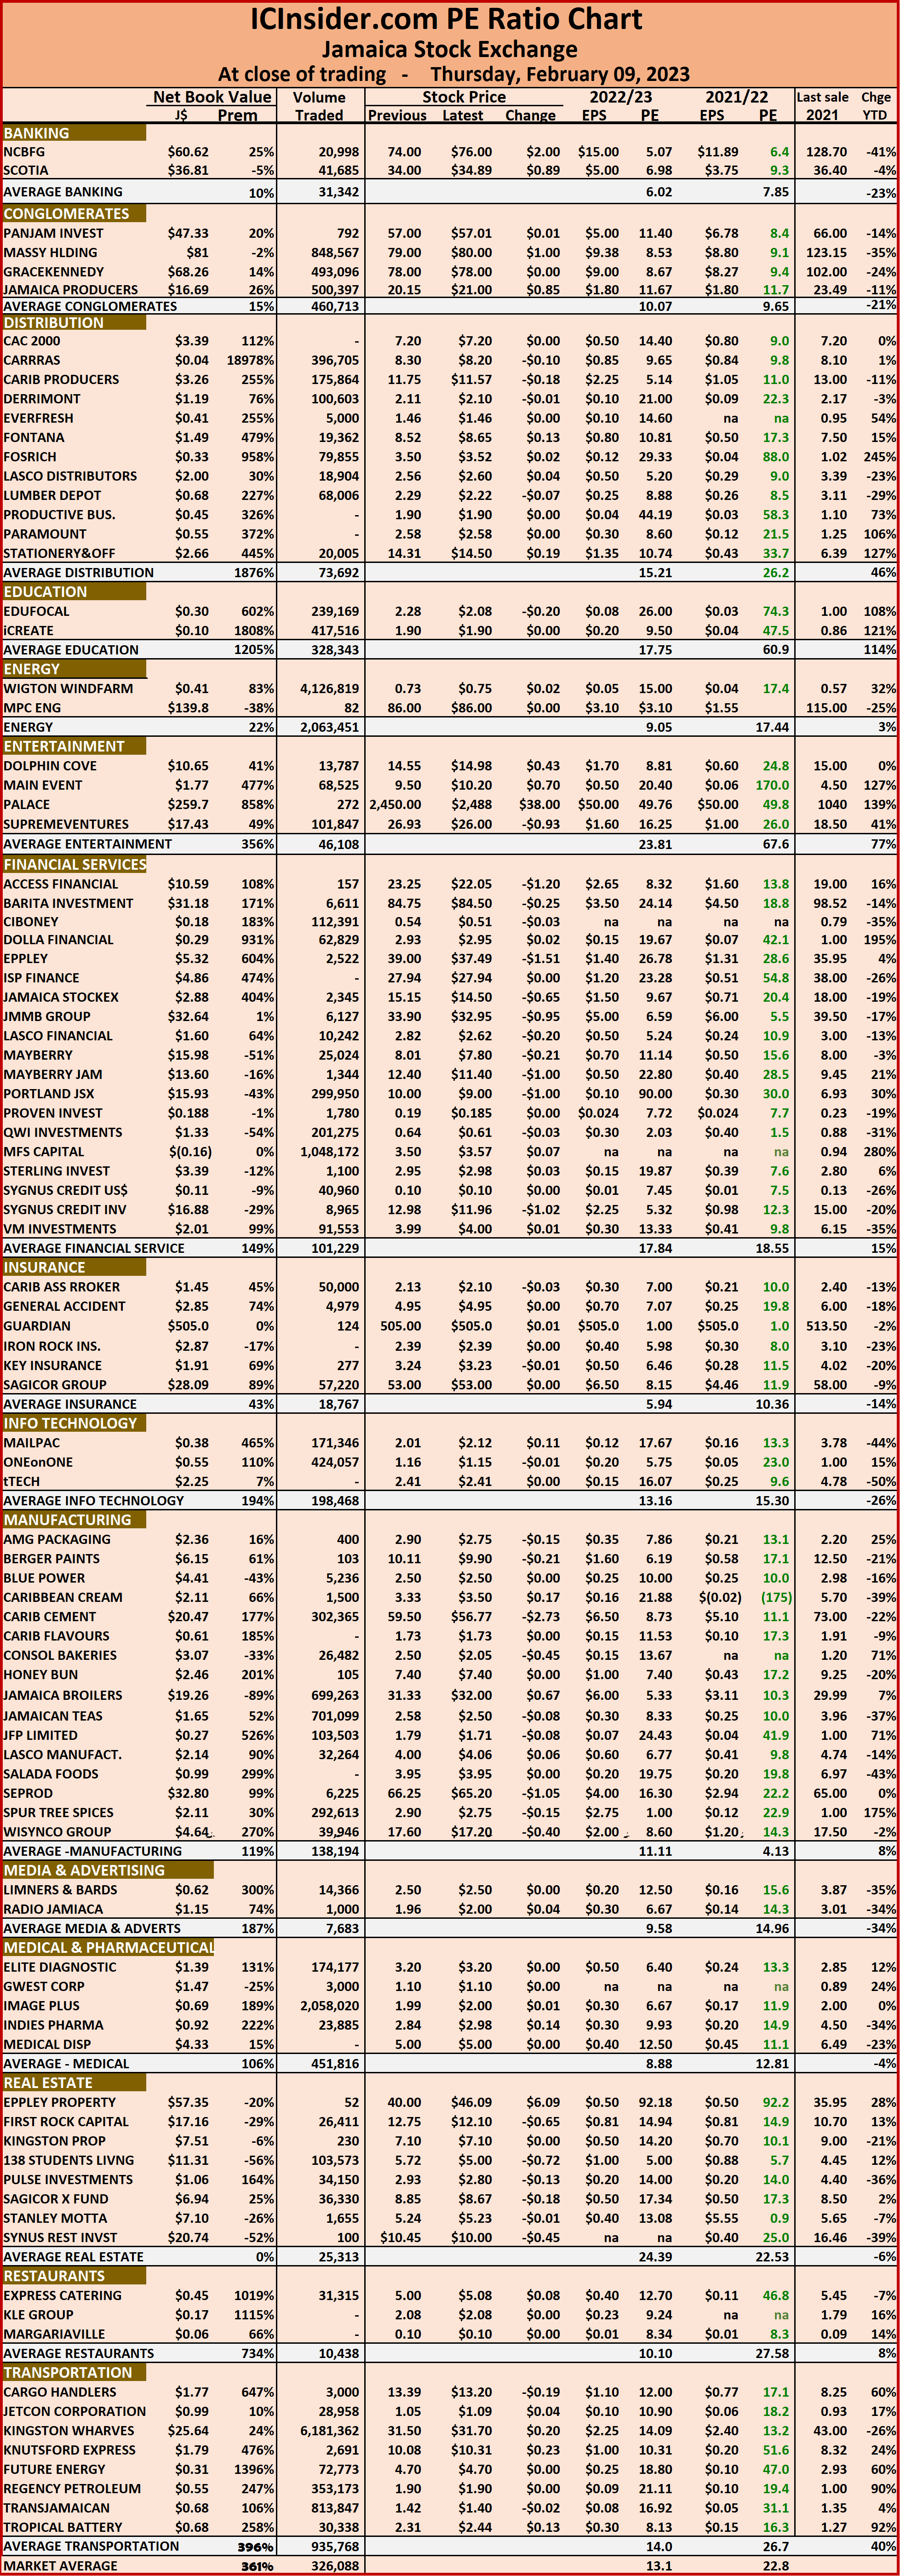 Dividends payable and yields for each company are shown in the Main and Junior Markets’ daily report charts that show the closing volume for the bids and offers.
The EPS & PE ratios are based on 2021 and 2022 actual or projected earnings, excluding major one off items. The PE Ratio is the most popular measure used to determine the value of stocks.
JSE Main Market rises Junior Market slips
The Main Market of the Jamaica Stock Exchange rose at the close of trading on Wednesday and the Junior and the USD Markets declined moderately with the volume and value of stocks trading remaining fairly consistent with that on Tuesday.
 Trading resulted in an exchange of 18,817,620 shares, up from 17,343,337 units on Monday, valued at $120.2 million, compared with $122.33 million on the previous day. Trading on the JSE USD market resulted in investors exchanging shares traded for US$4,280 versus US$19,925 on Tuesday.
At the close, the Combined Market Index climbed 1,375.51 points to 347,856.59, the All Jamaican Composite Index rallied 3,460.05 points to 379,290.64, the JSE Main Index gained 1,544.69 points to close at 334,462.13, the Junior Market slipped 3.17 points to 3,905.52 and the JSE US dollar market dipped 1.18 points to end at 232.78.
The market’s PE ratio ended at 22.8 based on 2021-22 earnings and 13.1 times those for 2022-23 at the close of trading.
 Investors need pertinent information to successfully navigate many investment options in the local stock market. The ICInsider.com PE ratio chart and the more detailed daily report charts provide investors with regularly updated information to help decision-making.
Investors should use the chart to help make rational investment decisions by investing in stocks close to the average for the sector and not going too far from it unless there are compelling reasons to do so. This approach helps to remove emotions from investment decisions and put in on fundamentals while at the same time not being too far from the majority of investors. Investors who buy when the price of a stock is close to the average will find that they are not inclined to overpay for a stock.
The ICInsider.com PE Ratio chart covers all ordinary shares on the Jamaica Stock Exchange. It shows companies grouped on an industry basis, allowing easy comparisons between the same sector companies and the overall market.
 The net asset value of each company is reported as a guide to assess the value of stocks based on this measure quickly. The chart also shows daily changes in stock prices and the percentage year to date price movement based on the last traded prices. Dividends payable and yields for each company are shown in the Main and Junior Markets’ daily report charts that show the closing volume for the bids and offers.
The EPS & PE ratios are based on 2021 and 2022 actual or projected earnings, excluding major one off items. The PE Ratio is the most popular measure used to determine the value of stocks.
JSE Main Market falls
Trading ended on the Jamaica Stock Exchange Main Market on Wednesday with a 20 percent rise in the volume of stocks traded as the value dipped 7 percent below that on Tuesday, resulting from 52 securities trading, down from 57 on Tuesday with prices of 20 rising, 20 declining and 12 ending unchanged.
 A total of 9,512,250 shares were exchanged for $94,127,743 versus 7,945,794 units at $100,709,129 on Tuesday.
Trading averaged 182,928 units at $1,810,149 compared with 139,400 shares at $1,766,827 on Tuesday and month to date an average of 148,706 units at $1,294,834 compared to 142,484 units at $1,201,140 on the previous day. January closed with an average of 205,236 units at $1,805,558.
Wigton Windfarm led trading with 3.49 million shares for 36.7 percent of total volume followed by Jamaica Broilers with 1.54 million units for 16.2 percent of the day’s trade and JMMB Group 7.5% with 1.01 million units for 10.6 percent market share.
The All Jamaican Composite Index rallied 3,460.05 points to 379,290.64, the JSE Main Index advanced 1,544.69 points to 334,462.13 and the JSE Financial Index popped 0.24 points to end at 79.30.
 The PE Ratio, a formula to ascertain appropriate stock values, averages 14.2 for the Main Market. The JSE Main and USD Market PE ratios incorporate earnings forecasted by ICInsider.com for companies with the financial year ending between November 2022 and August 2023.
Investor’s Choice bid-offer indicator shows 13 stocks ending with bids higher than their last selling prices and 7 with lower offers.
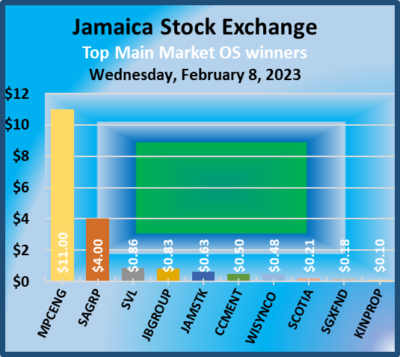
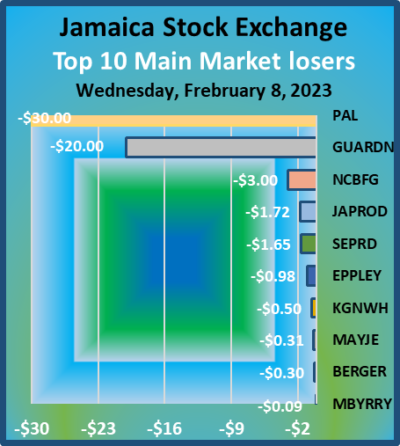
At the close, Caribbean Cement popped 50 cents to close at $59.50 after 4,816 shares passed through the market, Eppley fell 98 cents to $39 in an exchange of 248 stocks, Guardian Holdings dropped $20 to $505 with a transfer of 11,287 units. Jamaica Broilers gained 83 cents to close at $31.33 with the swapping of 1,541,933 stock units, Jamaica Producers dipped $1.72 to $20.15 after trading 7,727 units, Jamaica Stock Exchange rose 63 cents to close at $15.15 in switching ownership of 2,015 shares. Kingston Wharves shed 50 cents to finish at $31.50 with an exchange of 6,579 stock units, MPC Caribbean Clean Energy rose $11 to $86 with 17 stocks changing hands, 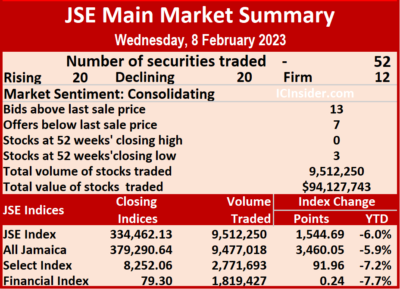 NCB Financial declined $3 to a 52 weeks’ low of $74 with 8,463 stock units clearing the market. Palace Amusement dropped $30 to close at $2,450 in trading 420 stocks, Proven Investments declined $2.51 to close at $26.50 with the swapping of 10,349 units, Sagicor Group rallied $4 to $53 with investors transferring 86,606 shares. Seprod fell $1.65 to end at $66.25 with a transfer of 2,886 units, Supreme Ventures rose 86 cents in closing at $26.93 after exchanging 4,917 stock units and Wisynco Group gained 48 cents in ending at $17.60 after a transfer of 219,667 shares.
In the preference segment, Productive Business 10.50% preference share dived $400 in closing at $1,100 with the swapping of 11 stocks, 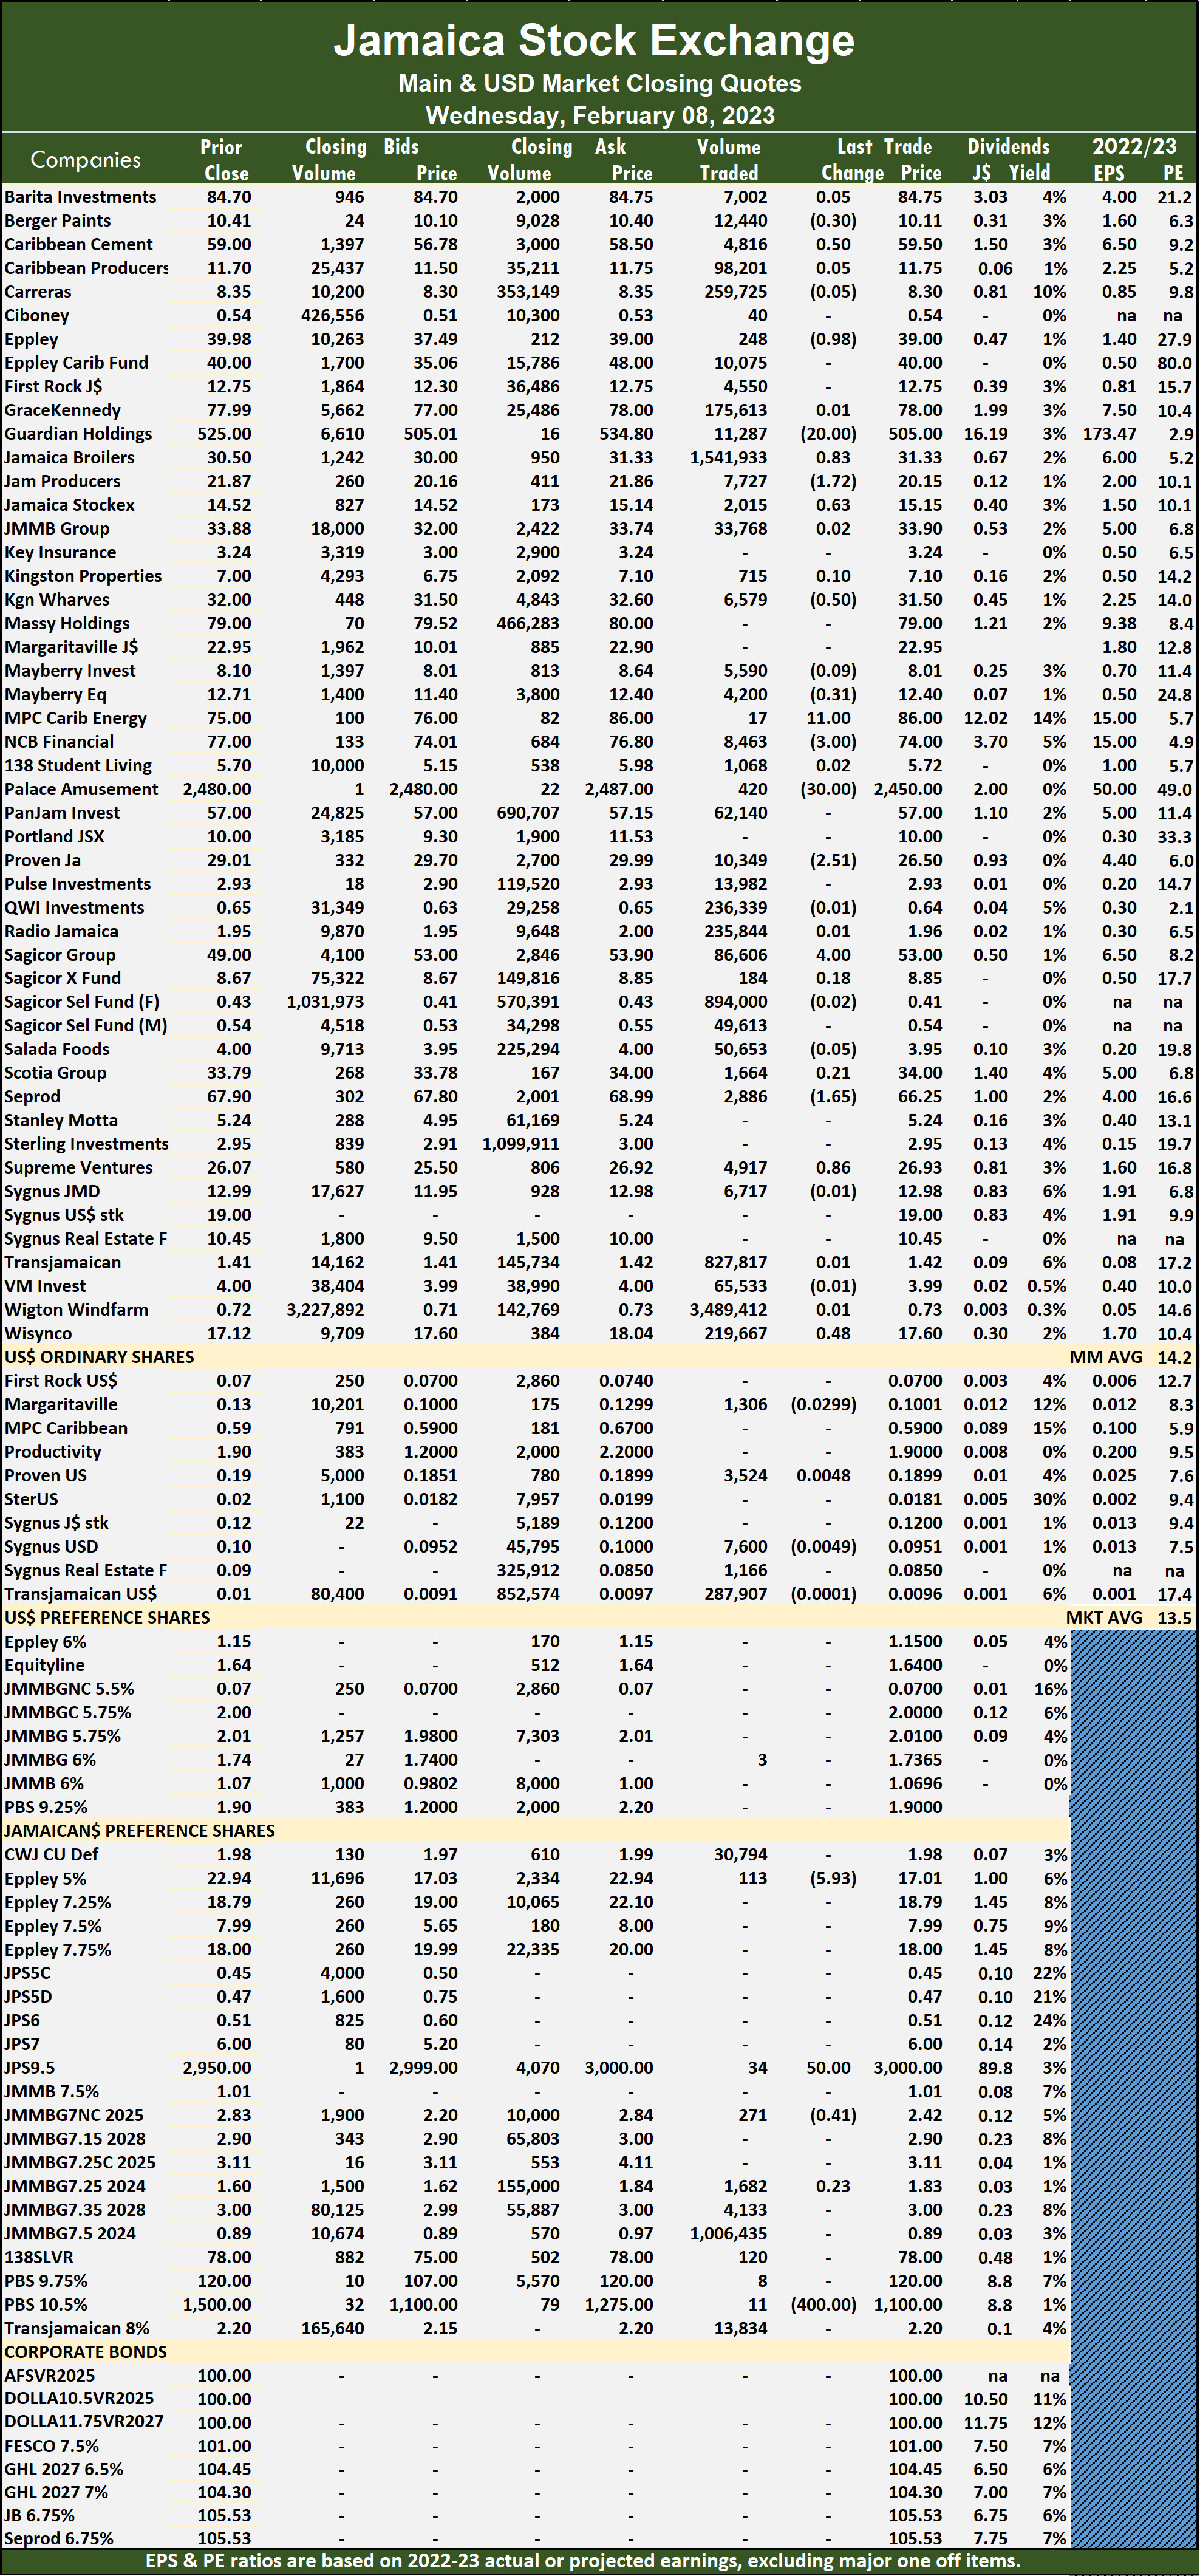 Eppley 5% preference share declined $5.93 in ending at $17.01 and trading 113 shares, Jamaica Public Service 9.5% climbed $50 to settle at $3,000 as investors exchanged 34 units and JMMB Group 7% preference share shed 41 cents to close at $2.42 in an exchange of 271 stocks.
Prices of securities trading are those for the last transaction of each stock unless otherwise stated.
Trading climbs on JSE Main Market
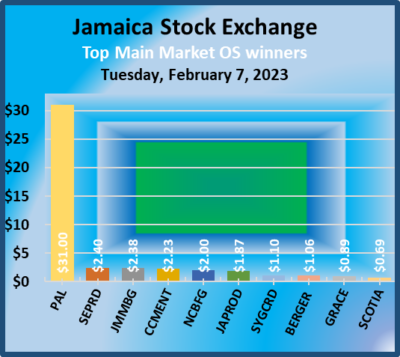
Investors pumped 211 percent more money into the Jamaica Stock Exchange Main Market on Tuesday and purchased16 percent fewer shares than on Monday and sending more stocks closing higher than those falling with57securities trading, as was the case on Monday, and ended with prices of 27 rising, 21 declining and nine ending unchanged.
 A total of 7,945,794 shares were exchanged for $100,709,129 compared to 9,434,901 units at $32,400,825 on Monday.
Trading averaged 139,400 units at $1,766,827 versus 165,525 shares at $568,436 on Monday and month to date, an average of 142,484 units at $1,201,140 compared with 143,252 units at $1,060,336 on the previous day. January closed with an average of 205,236 units at $1,805,558.
JMMB Group 7.35% – 2028, led trading with 2.23 million shares for 28.1 percent of total volume, followed by Wigton Windfarm with 1.57 million units for 19.8 percent of the day’s trade and Jamaica Broilers with 855,784 units for 10.8 percent market share.
The All Jamaican Composite Index declined 2,558.42 points to 375,830.59, the JSE Main Index fell 2,316.43 points to 332,917.44 and the JSE Financial Index shed 0.64 points to close at 79.06.
 The PE Ratio, a formula to ascertain appropriate stock values, averages 14.2 for the Main Market. The JSE Main and USD Market PE ratios incorporate earnings forecasted by ICInsider.com for companies with the financial year ending between November 2022 and August 2023.
Investor’s Choice bid-offer indicator shows seven stocks ending with bids higher than their last selling prices and four with lower offers.
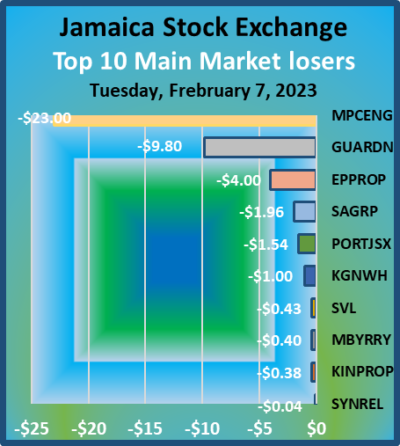
At the close, Berger Paints rose $1.06 to $10.41 in an exchange of 1,687 shares, Caribbean Cement advanced $2.23 to $59 in trading 1,133 stocks, Eppley Caribbean Property Fund fell $4 in closing at $40 after 4,657 units crossed the market. First Rock Real Estate gained 60 cents in ending at $12.75 in transferring 1,620 stock units, GraceKennedy rose 89 cents to end at $77.99 in switching ownership of 479,100 stocks, Guardian Holdings declined $9.80 to close at $525 with an exchange of 2,389 units. Jamaica Broilers popped 50 cents to finish at $30.50 in switching ownership of 855,784 stock units, Jamaica Producers rallied $1.87 to close at $21.87 after a transfer of 138 shares, JMMB Group advanced $2.38 in ending at $33.88 with 8,657 stock units changing hands. Kingston Wharves dipped $1 in closing at $32 after 3,129 shares passed through the market, Mayberry Investments lost 40 cents to end at $8.10 after exchanging 39,563 stocks, MPC Caribbean Clean Energy dropped $23 to end at $75 with a transfer of 75 units. NCB Financial rallied $2 in closing at $77 as investors exchanged 23,990 shares after the price hit a new one year low of $72, 138 Student Living gained 55 cents to settle at $5.70 with the swapping of 1,123 stocks, Palace Amusement popped $31 to close at $2,480 with 409 stock units changing hands. Portland JSX shed $1.54 to settle at $10 with 512 units clearing the market, Proven Investments lost 49 cents in ending at $29.01 with investors transferring 3,048 units, Sagicor Group fell $1.96 to end at $49, trading 73,873 shares. Scotia Group rose 69 cents to close at $33.79 in exchanging 191,619 stocks, Seprod advanced $2.40 to $67.90 after trading 100 stock units, Supreme Ventures lost 43 cents to close at $26.07 in switching ownership of 38,042 shares and Sygnus Credit Investments rose $1.10 to $12.99 with the swapping of 33,048 stock units.
 In the preference segment, JMMB Group 7% preference share gained 42 cents in closing at $2.83 with a transfer of 3,904 stocks and 138 Student Living preference share advanced $2.50 to close at a record high of $78 in trading 1,024 units.
Prices of securities trading are those for the last transaction of each stock unless otherwise stated.
Junior Market gains JSE Main market falls
The volume of stocks trading dropped on the Jamaica Stock Exchange on Tuesday but with  a higher value than on Monday, leading to a rise in the Junior Market and declines in the JSE Main and the USD Market of the Jamaica Stock Exchange.
Trading ended with an exchange of 17,343,337 shares, down from 21,902,708 units on Monday, valued at $122.33 million up from $66.44 million on the previous day. Trading on the JSE USD market resulted in investors trading US$19.925 compared with US$23,988 on Monday.
At the close, the Combined Market Index shed 2,089.31 points to 346,481.08, the All Jamaican Composite Index dropped 2,558.42 points to end at 375,830.59, the JSE Main Index lost 2,316.43 points to end at 332,917.44, the Junior Market rose 7.39 points to 3,912.36 and the JSE US dollar market dipped 1.18 points to close at 235.95.
 The market’s PE ratio ended at 22.8 based on 2021-22 earnings and 13.1 times those for 2022-23 at the close of trading.
Investors need pertinent information to successfully navigate many investment options in the local stock market. The ICInsider.com PE ratio chart and the more detailed daily report charts provide investors with regularly updated information to help decision-making.
Investors should use the chart to help make rational investment decisions by investing in stocks close to the average for the sector and not going too far from it unless there are compelling reasons to do so. This approach helps to remove emotions from investment decisions and put in on fundamentals while at the same time not being too far from the majority of investors. Investors who buy when the price of a stock is close to the average will find that they are not inclined to overpay for a stock.
The ICInsider.com PE Ratio chart covers all ordinary shares on the Jamaica Stock Exchange. It shows companies grouped on an industry basis, allowing easy comparisons between the same sector companies and the overall market.
 The net asset value of each company is reported as a guide to assess the value of stocks based on this measure quickly. The chart also shows daily changes in stock prices and the percentage year to date price movement based on the last traded prices. Dividends payable and yields for each company are shown in the Main and Junior Markets’ daily report charts that show the closing volume for the bids and offers.
The EPS & PE ratios are based on 2021 and 2022 actual or projected earnings, excluding major one off items. The PE Ratio is the most popular measure used to determine the value of stocks.
Trading activity drops of the JSE Main market
Trading activity on the Jamaica Stock Exchange Main Market ended on Monday with a 14 percent increase in the volume of stocks traded and the value 68 percent lower than on Friday, from 57 securities trading compared to 60 on Friday, with 16 rising, 31 declining and 10 ending unchanged.
 A total of 9,434,901 shares were exchanged for $32,400,825 versus 8,306,314 units at $100,793,32 on Friday.
Trading averaged 165,525 units at $568,436 versus 138,439 shares at $1,679,857 on Friday and month to date, an average of 143,252 units at $1,060,336 compared to 135,871 units at $1,223,350 on the previous trading day. January closed with an average of 205,236 units at $1,805,558.
Wigton Windfarm led trading with 4.07 million shares for 43.2 percent of total volume followed by Sagicor Select Financial Fund with 1.35 million units for 14.3 percent of the day’s trade, Transjamaican Highway with 1.32 million units for 14 percent of market share and QWI Investments with 1.13 million units for 12 percent market share.
 The All Jamaican Composite Index dropped 2,647.57 points to 378,389.01, the JSE Main Index fell 2,561.70 points to end at 335,233.87 and the JSE Financial Index lost 0.99 points to settle at 79.70.
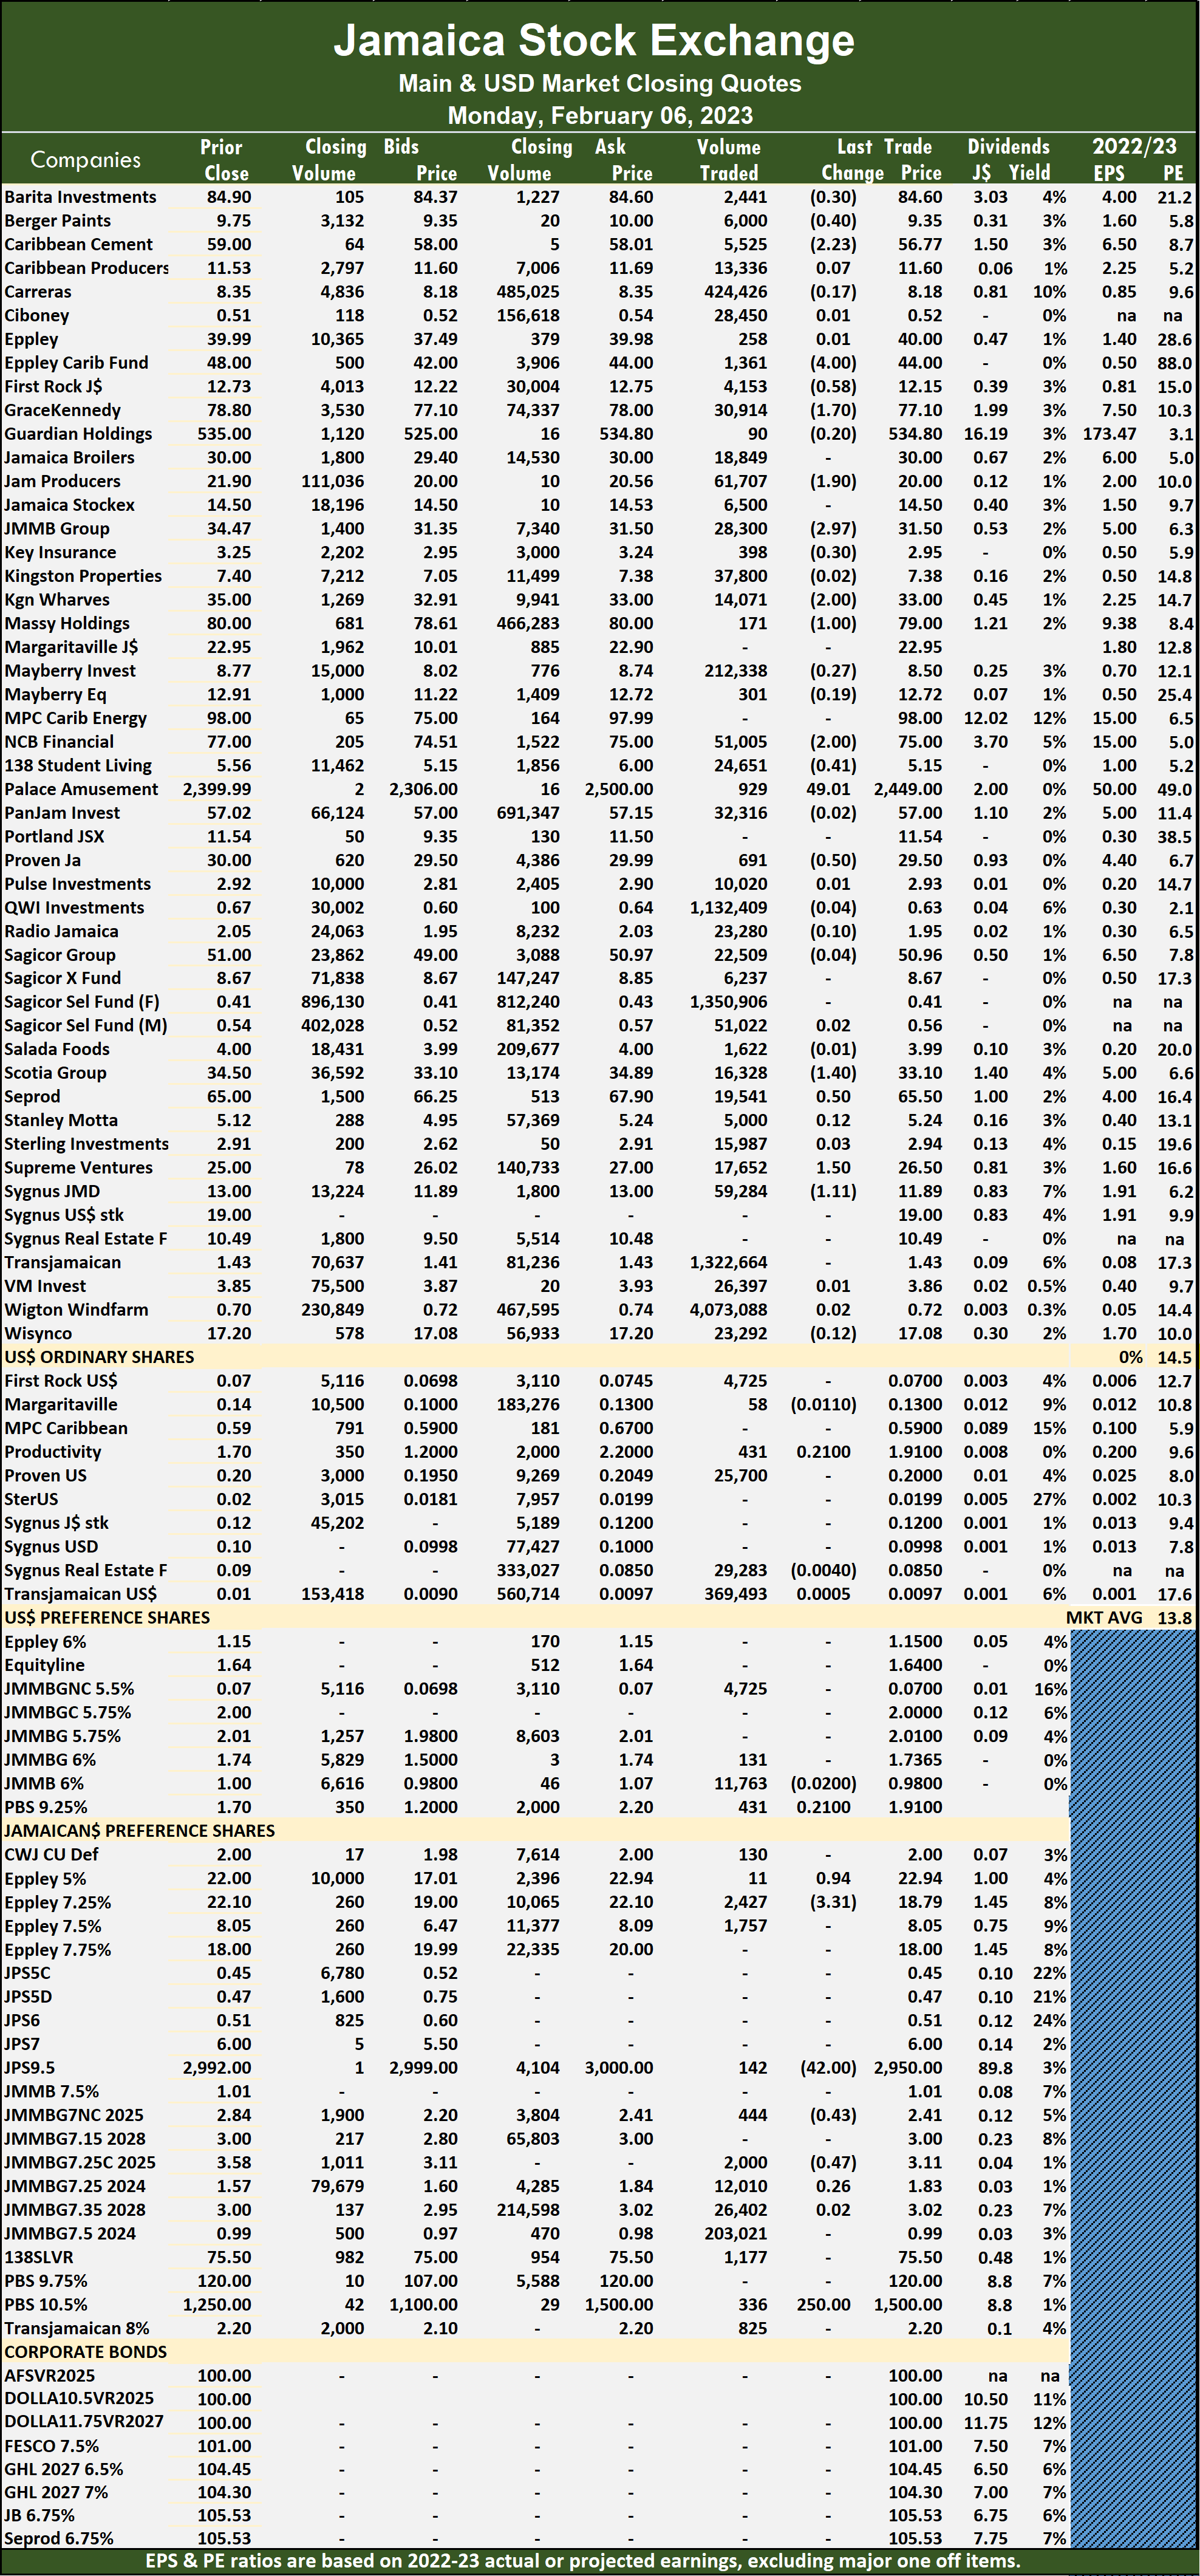
The PE Ratio, a formula to ascertain appropriate stock values, averages 14.5 for the Main Market. The JSE Main and USD Market PE ratios incorporate earnings forecasted by ICInsider.com for companies with the financial year ending between November 2022 and August 2023.
Investor’s Choice bid-offer indicator shows 10 stocks ending with bids higher than their last selling prices and eight with lower offers.
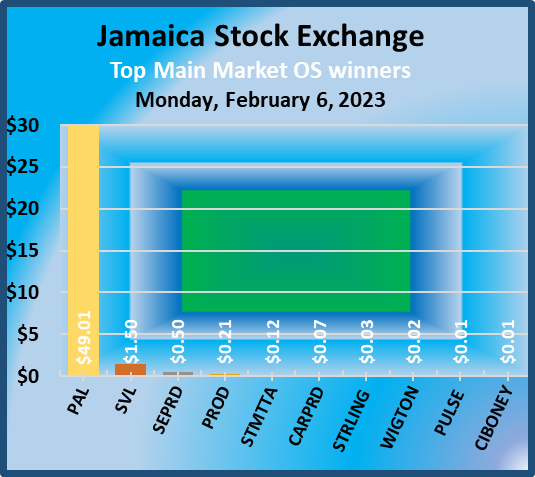
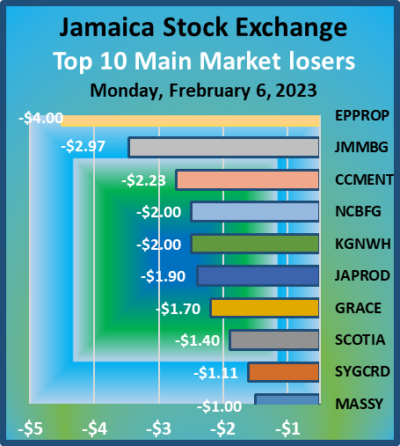
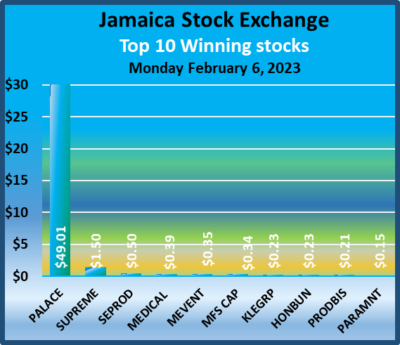
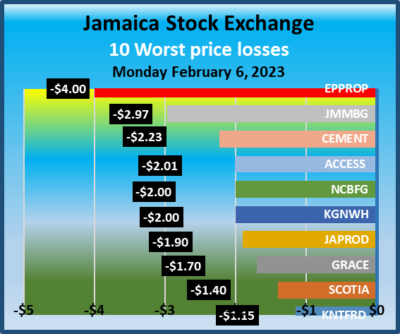
At the close, Berger Paints lost 40 cents to close at $9.35 in trading 6,000 shares, Caribbean Cement declined $2.23 to end at $56.77 with 5,525 stocks crossing the exchange, Eppley Caribbean Property Fund dropped $4 to close at $44 with a transfer of 1,361 stock units. First Rock Real Estate dipped 58 cents in closing at $12.15 with 4,153 units changing hands, 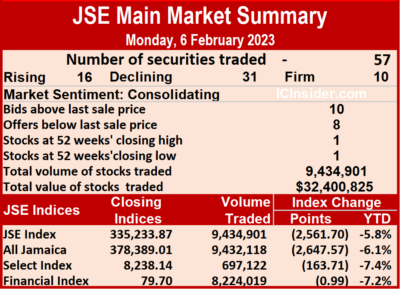 GraceKennedy shed $1.70 in ending at $77.10 in switching ownership of 30,914 units, Jamaica Producers fell $1.90 to $20 in exchanging 61,707 stocks. JMMB Group declined $2.97 in closing at $31.50 with the swapping of 28,300 shares, Kingston Wharves shed $2 to end at $33 as investors exchanged 14,071 stock units, Massy Holdings fell $1 to close at $79 with a transfer of 171 units. NCB Financial shed $2 to end at a 52 weeks’ low of $75 after 51,005 stocks cleared the market, 138 Student Living dipped 41 cents to end at $5.15 in exchanging 24,651 stock units, Palace Amusement climbed $49.01 to $2,449 in switching ownership of 929 shares. Proven Investments lost 50 cents to end at $29.50 after an exchange of 691 stock units, Scotia Group shed $1.40 to close at $33.10 after trading 16,328 units, Seprod gained 50 cents in closing at $65.50 with investors transferring 19,541 stocks. Supreme Ventures advanced $1.50 to $26.50 after trading 17,652 shares and Sygnus Credit Investments fell $1.11 to end at $11.89 with an exchange of 59,284 shares.
 In the preference segment, Productive Business 10.50% preference share popped $250 to a 52 weeks’ high of $1,500 with 336 stock units changing hands. Eppley 5% preference share rallied 94 cents to close at $22.94 after 11 stocks crossed the market, Eppley 7.25% preference share declined $3.31 in ending at $18.79 after exchanging 2,427 units, Jamaica Public Service 9.5% dropped $42 to $2,950 trading 142 stocks. JMMB Group 7% preference share lost 43 cents to end at $2.41 as 444 shares passed through the market and JMMB Group 7.25% preference share dipped 47 cents to $3.11 with a transfer of 2,000 stock units but after it traded at a 52 weeks’ intraday high of $3.94.
Prices of securities trading are those for the last transaction of each stock unless otherwise stated.
Falling prices hit Jamaica Stock Exchange
The volume of trading picked up on the Jamaica Stock exchange on Monday but at a lower value than on Friday, leading to the JSE Main and Junior Market closing lower while the USD Market of the Jamaica Stock Exchange closed higher.
 Trading ended with an exchange of 21,902,708 shares, down from 15,002,754 units on Friday, valued at $66.44 million up from $117 million on the previous day. Trading on the JSE USD market resulted in investors exchanging US$23,988 compared with US$20,906on Friday.
At the close, the Combined Market Index gained 557.08 points to 348,570.39, the All Jamaican Composite Index fell 2,647.57 points to 378,389.01, the JSE Main Index lost 2,561.70 points to end at 335,233.87, the Junior Market fell 35.50 points to 3,904.97 and the JSE US dollar market jumped 13.69 points to close at 237.13.
The market’s PE ratio ended at 22.9 based on 2021-22 earnings and 13.3 times those for 2022-23 at the close of trading.
 Investors need pertinent information to successfully navigate many investment options in the local stock market. The ICInsider.com PE ratio chart and the more detailed daily report charts provide investors with regularly updated information to help decision-making.
Investors should use the chart to help make rational investment decisions by investing in stocks close to the average for the sector and not going too far from it unless there are compelling reasons to do so. This approach helps to remove emotions from investment decisions and put in on fundamentals while at the same time not being too far from the majority of investors. Investors who buy when the price of a stock is close to the average will find that they are not inclined to overpay for a stock.
The ICInsider.com PE Ratio chart covers all ordinary shares on the Jamaica Stock Exchange. It shows companies grouped on an industry basis, allowing easy comparisons between the same sector companies and the overall market.
The net asset value of each company is reported as a guide to assess the value of stocks based on this measure quickly. The chart also shows daily changes in stock prices and the percentage year to date price movement based on the last traded prices. 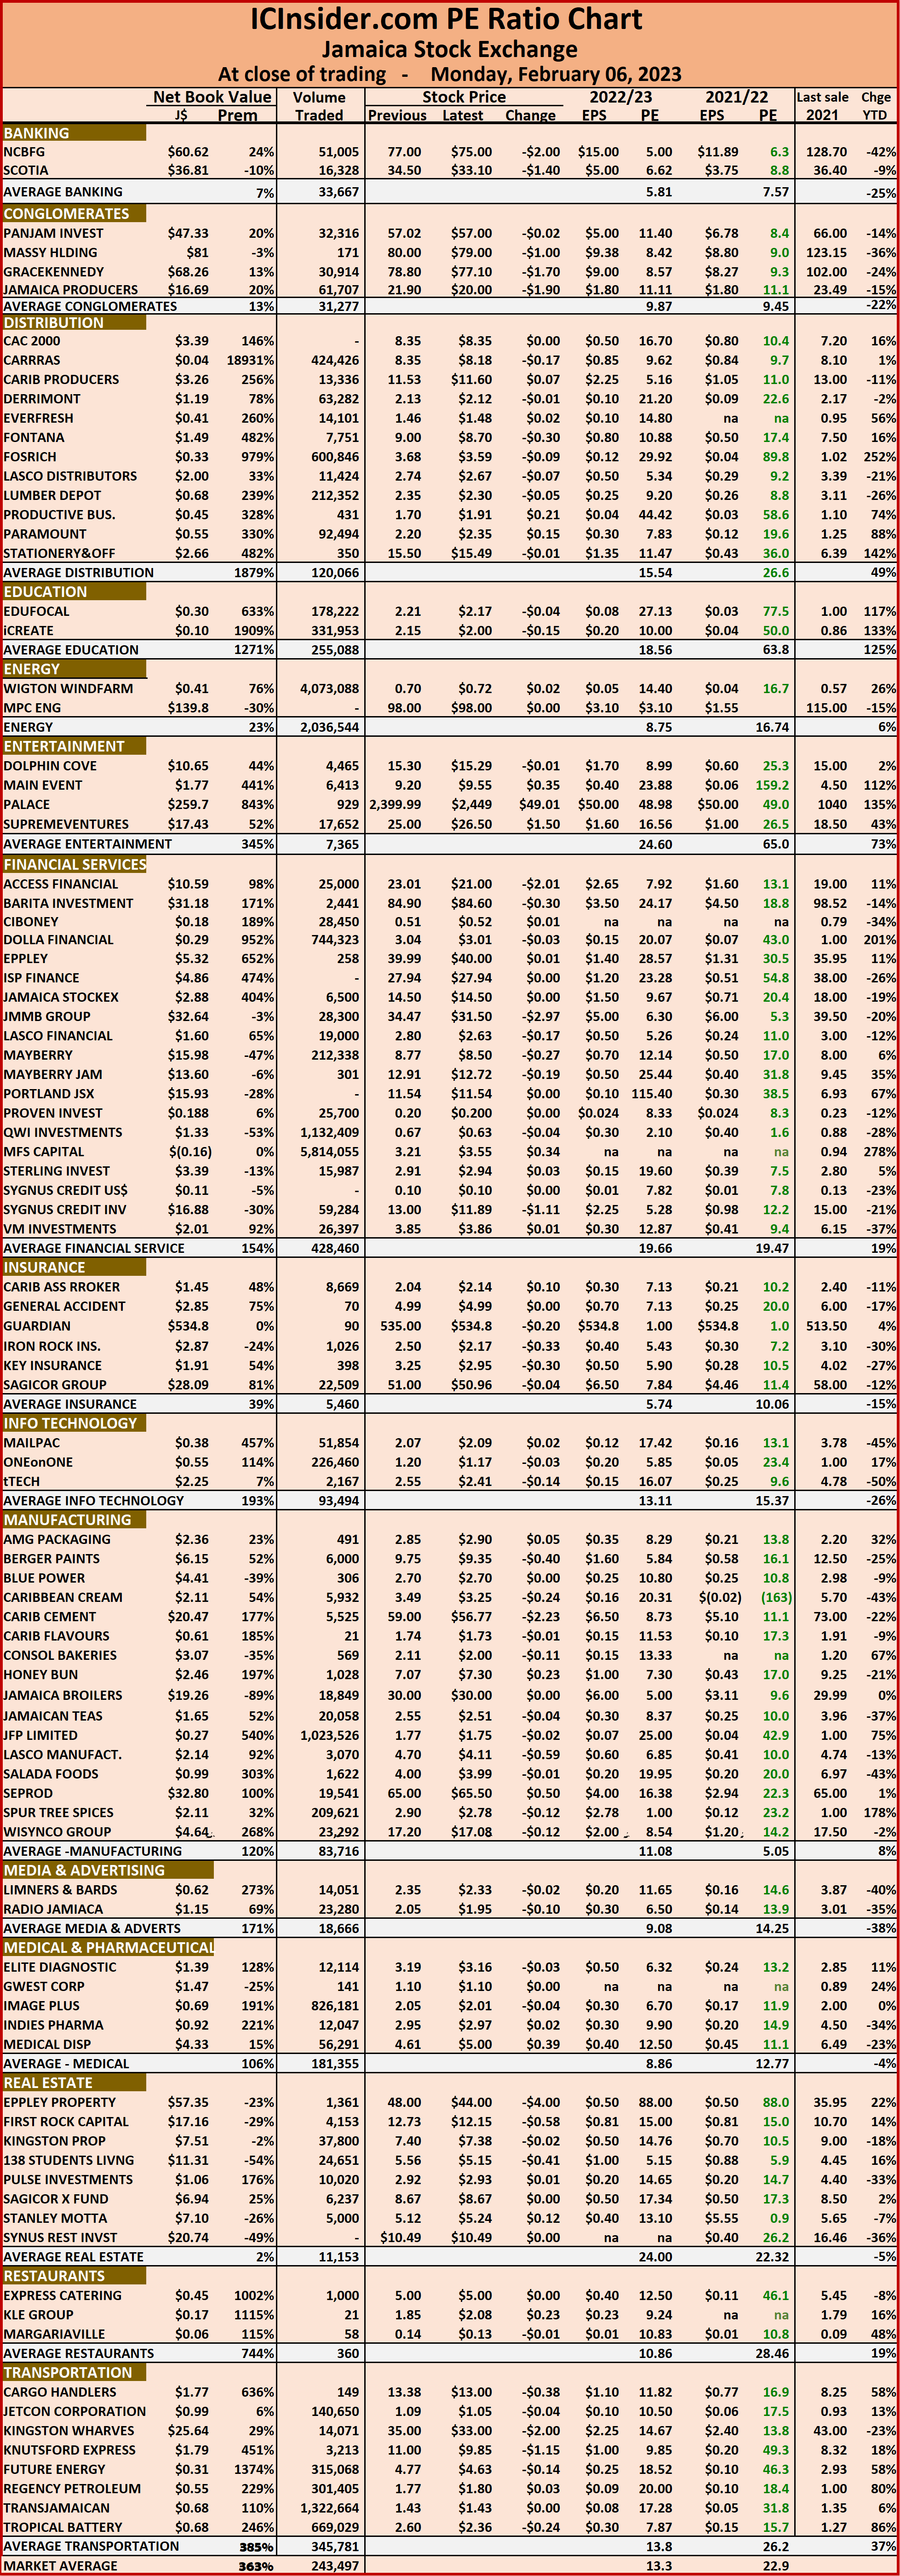 Dividends payable and yields for each company are shown in the Main and Junior Markets’ daily report charts that show the closing volume for the bids and offers.
The EPS & PE ratios are based on 2021 and 2022 actual or projected earnings, excluding major one off items. The PE Ratio is the most popular measure used to determine the value of stocks.


