Dolla Financial ended the second quarter with a profit after tax of $59 million, similar to the first quarter after revenues rose from $141 million in the first quarter to $157 million. Interest expenses increased to $13.7 million from $12.8 million in the March quarter. But it is an $18 million jump in Administrative expenses held back profit from exceeding the first quarter numbers.
 Roughly $18 million in increased administrative costs relates to the listing of the shares on the stock exchange and some other expenses associated with the IPO that are booked as a part of Administrative. ICInsoder.com gathers that cost to fall back to the $60 million level in the third quarter.
Year to date revenues are $298 million versus $108 million in 2021, while the June 2021 quarter delivered revenues of $54 million with a small profit of $9 million.
The third quarter should see a notable increase in loan income, with the IPO proceeds would only have been available in June, with the IPO closing on May 27. As such, revenues should climb by around $25 million in the September quarter and profit should hit $100 million for the quarter.
The balance sheet shows loans of $1.05 billion, up from $870 million at the end of March, Cash stood at $81 million and shareholders’ equity rose from $373 million to $653 million, reflecting the new capital injection from the IPO as well as the profit for the quarter. ICInsider.com understands that they have lent out all the funds received and are preparing to float a billion dollar bond to facilitate expansion. Loans payable amount to $429 million at the end of June, slightly down from the $452 million at the end of March but well up on the $296 million in June 2021.
The company plans to open a branch in Portmore in the current quarter and another in Guyana.
Earnings per share for the quarter was 2 cents and year to date just over 5 cents. ICInsider.com forecasts 20 cents per share for the current year and 35 cents for 2023.
Dolla Financial traded on the Junior Market at $2.87 after investors swapped 643,451 shares.
Dolla profit jumps sharply over 2021
All round losses for JSE markets
All markets slipped on the Jamaica Stock Exchange to close out the week and closed with modest changes in the indices. The JSE Combined Index fell 774.70 points to 394,724.22.
 Trading ended, with a mere 15,955,497 shares changing hands in the overall market, with a value of just $82.5 million, while the JSE USD market ended with the value of stocks traded at US$96,524.
At the close, the All Jamaican Composite Index fell 768.00 points to 435,643.29, the JSE Main Index lost 652.21 points to close at 380,664.04, the Junior Market slipped 18.34 points to 4,314.71 and the JSE USD market Index slipped 1.25 points lower to 209.66.
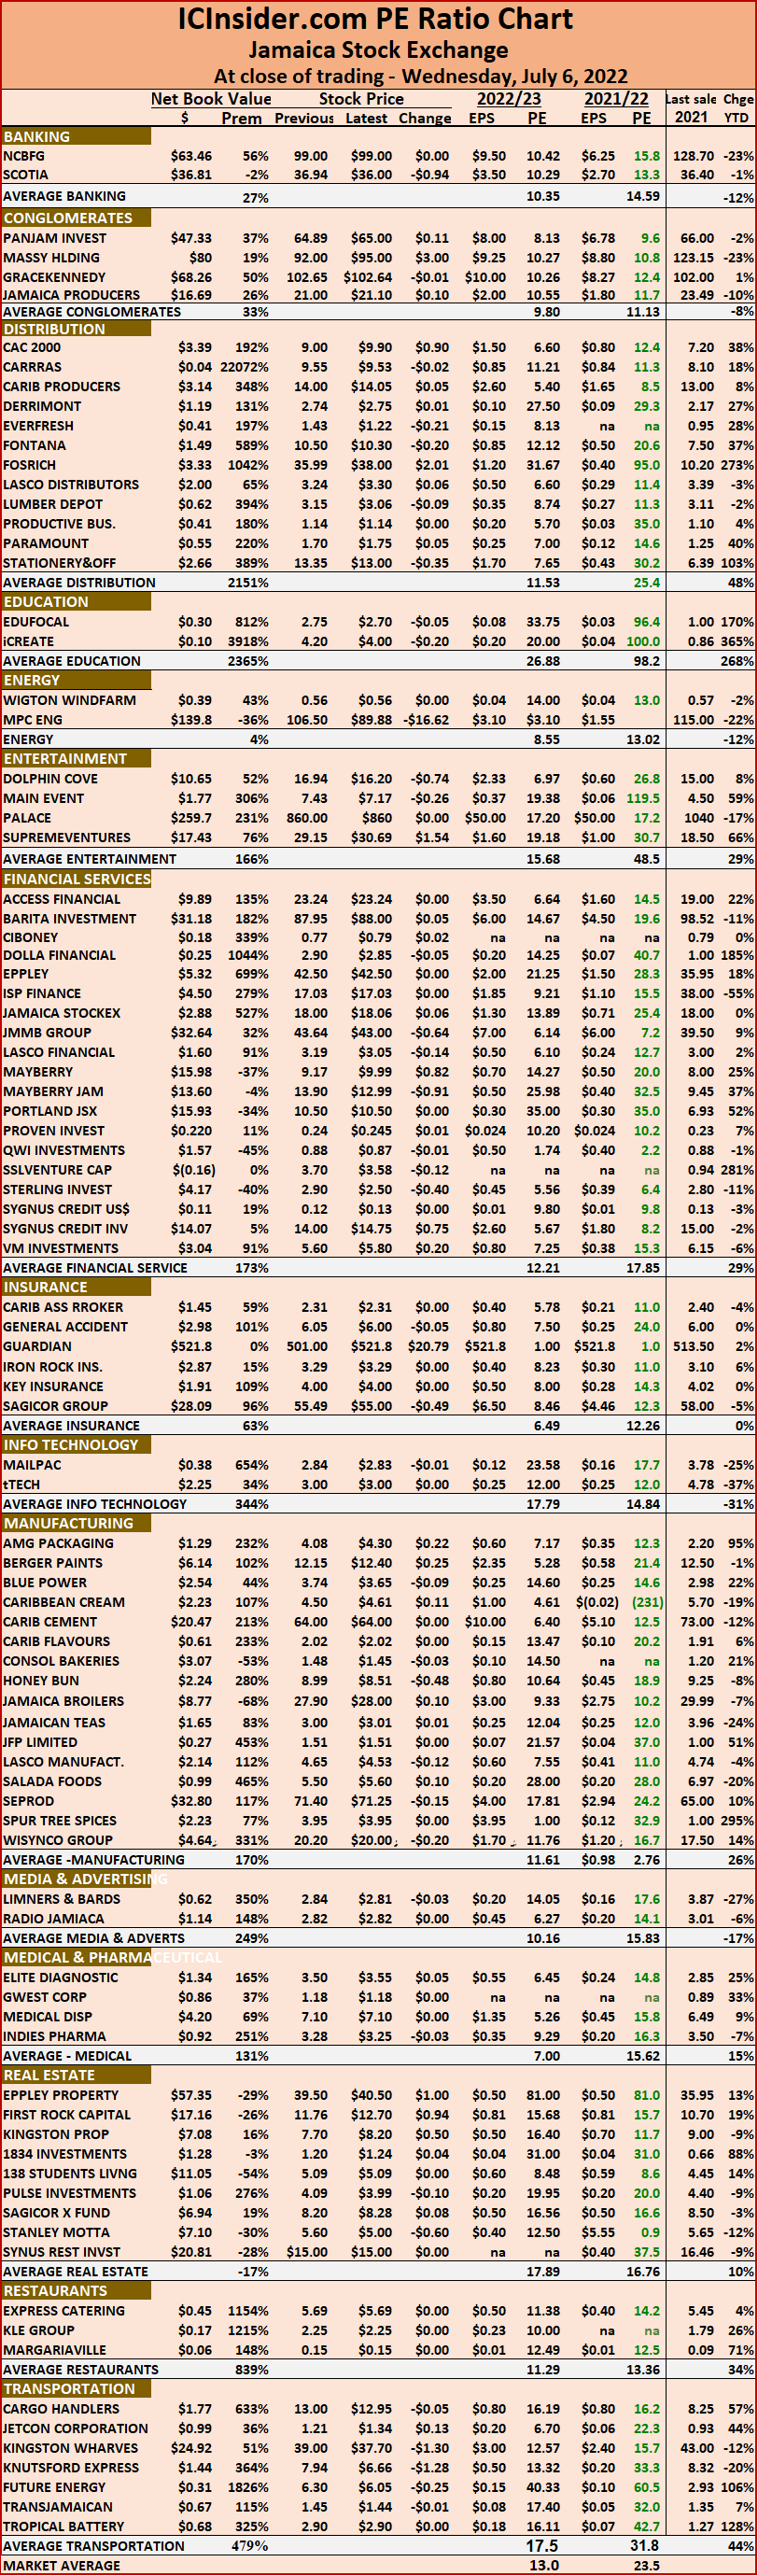
The market’s PE ratio ended at 23.7 based on 2021-22 earnings and 12.7 times those for 2022-23 at the close of trading.
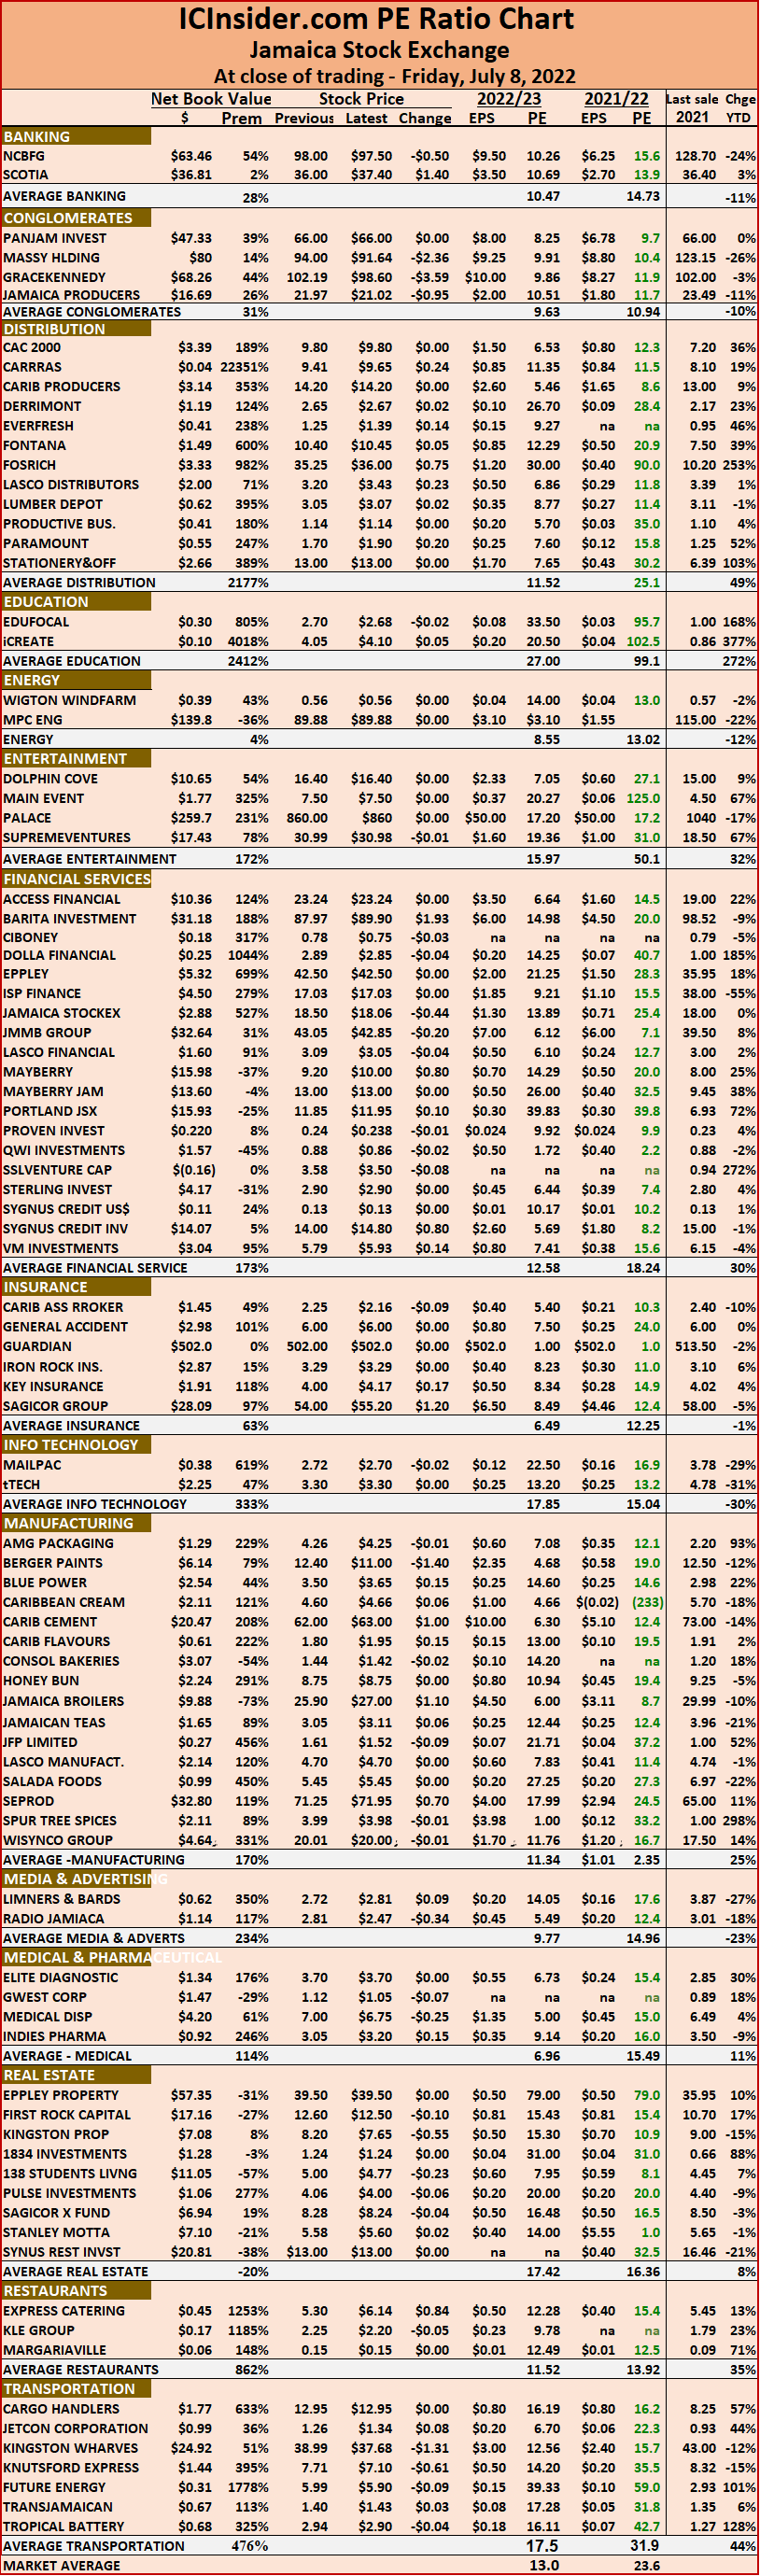
Investors need pertinent information to successfully navigate many investment choices, in the local stock market. The ICInsider.com PE ratio chart and the more detailed daily report charts provide investors with regularly updated information to help decision-making.
Investors should use the chart to help make rational investment decisions by investing in stocks close to the average for the sector and not going too far from it unless there are compelling reasons to do so. This approach helps to remove emotions from investment decisions and put in on fundamentals while at the same time not being too far from the majority of investors. Investors who buy when the price of a stock is close to the average will find that they are not inclined to overpay for a stock.
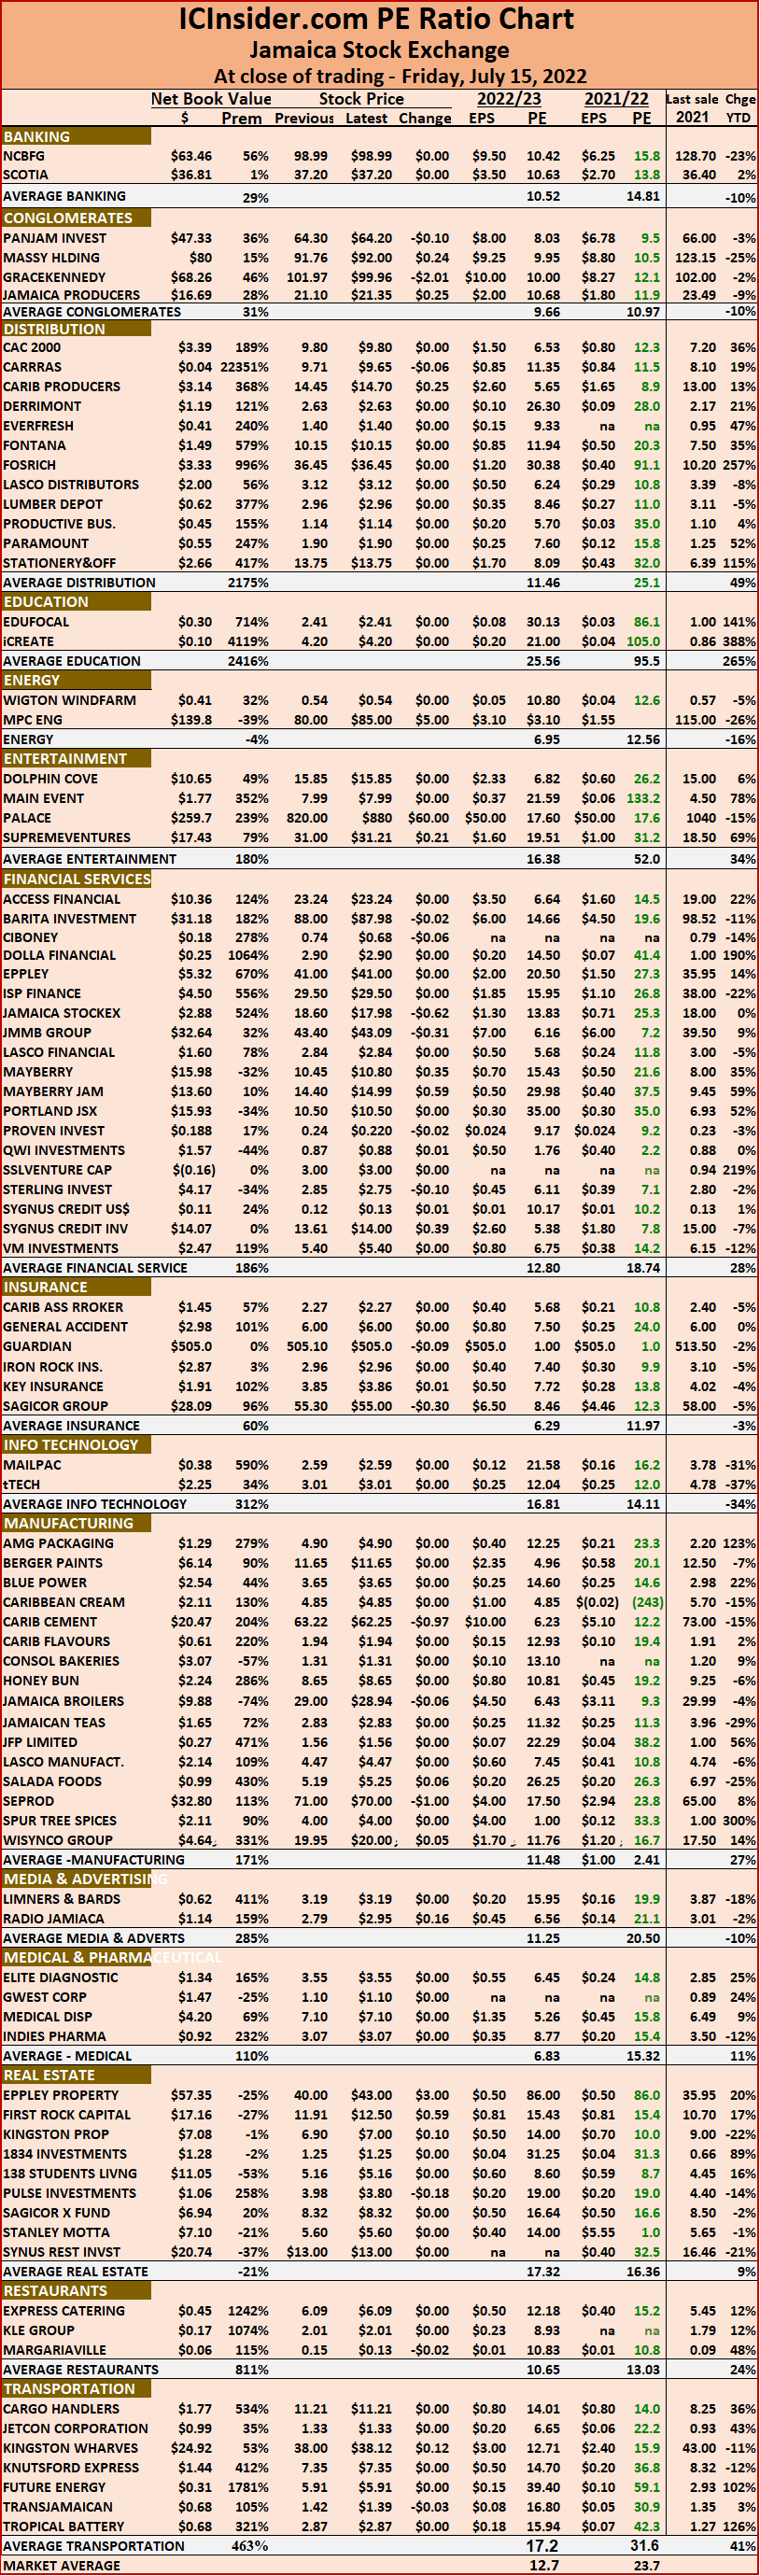 The ICInsider.com PE Ratio chart covers all ordinary shares on the Jamaica Stock Exchange. It shows companies grouped on an industry basis, allowing easy comparisons between the same sector companies and the overall market.
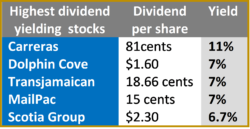
The net asset value of each company is reported as a guide to assess the value of stocks based on this measure quickly. The chart also shows daily changes in stock prices and the percentage year to date price movement based on the last traded prices. Dividends payable and yields for each company are shown in the Main and Junior Markets’ daily report charts that show the closing volume for the bids and offers.
The EPS & PE ratios are based on 2021 and 2022 actual or projected earnings, excluding major one off items. The PE Ratio is the most popular measure used to determine the value of stocks.
Gains for Jamaican stocks
Trading on the Junior Market was spirited on Thursday accounting for $40 million against $87 million in the Jamaica Stock Exchange Main Market, with PanJam Investment trading nearly $17 million in shares, with the market closing with modest changes in the indices as shown by the JSE Combined Index that rose a mere 82.65 points to end at 395,498.92.

PanJam Investment topped trading on Thursday with $17m
Trading ended on Thursday, with a mere 17,460,701 shares changing hands in the overall market, with a value of just $127.2 million, while the JSE USD market ended with the value of stocks traded at US$24,336.
At the close, the All Jamaican Composite Index rose 169.71 points to 436,411.29, the JSE Main Index added just 30.25 points to close at 381,316.25, the Junior Market rose 6.05 points to 4,333.05 and the JSE USD market Index slipped 1.35 points to 210.92.
The market’s PE ratio ended at 23.4 based on 2021-22 earnings and 12.7 times those for 2022-23 at the close of trading.
Investors need pertinent information to successfully navigate many investment choices, in the local stock market. The ICInsider.com PE ratio chart and the more detailed daily report charts provide investors with regularly updated information to help decision-making.
Investors should use the chart to help make rational investment decisions by investing in stocks close to the average for the sector and not going too far from it unless there are compelling reasons to do so. This approach helps to remove emotions from investment decisions and put in on fundamentals while at the same time not being too far from the majority of investors. Investors who buy when the price of a stock is close to the average will find that they are not inclined to overpay for a stock.
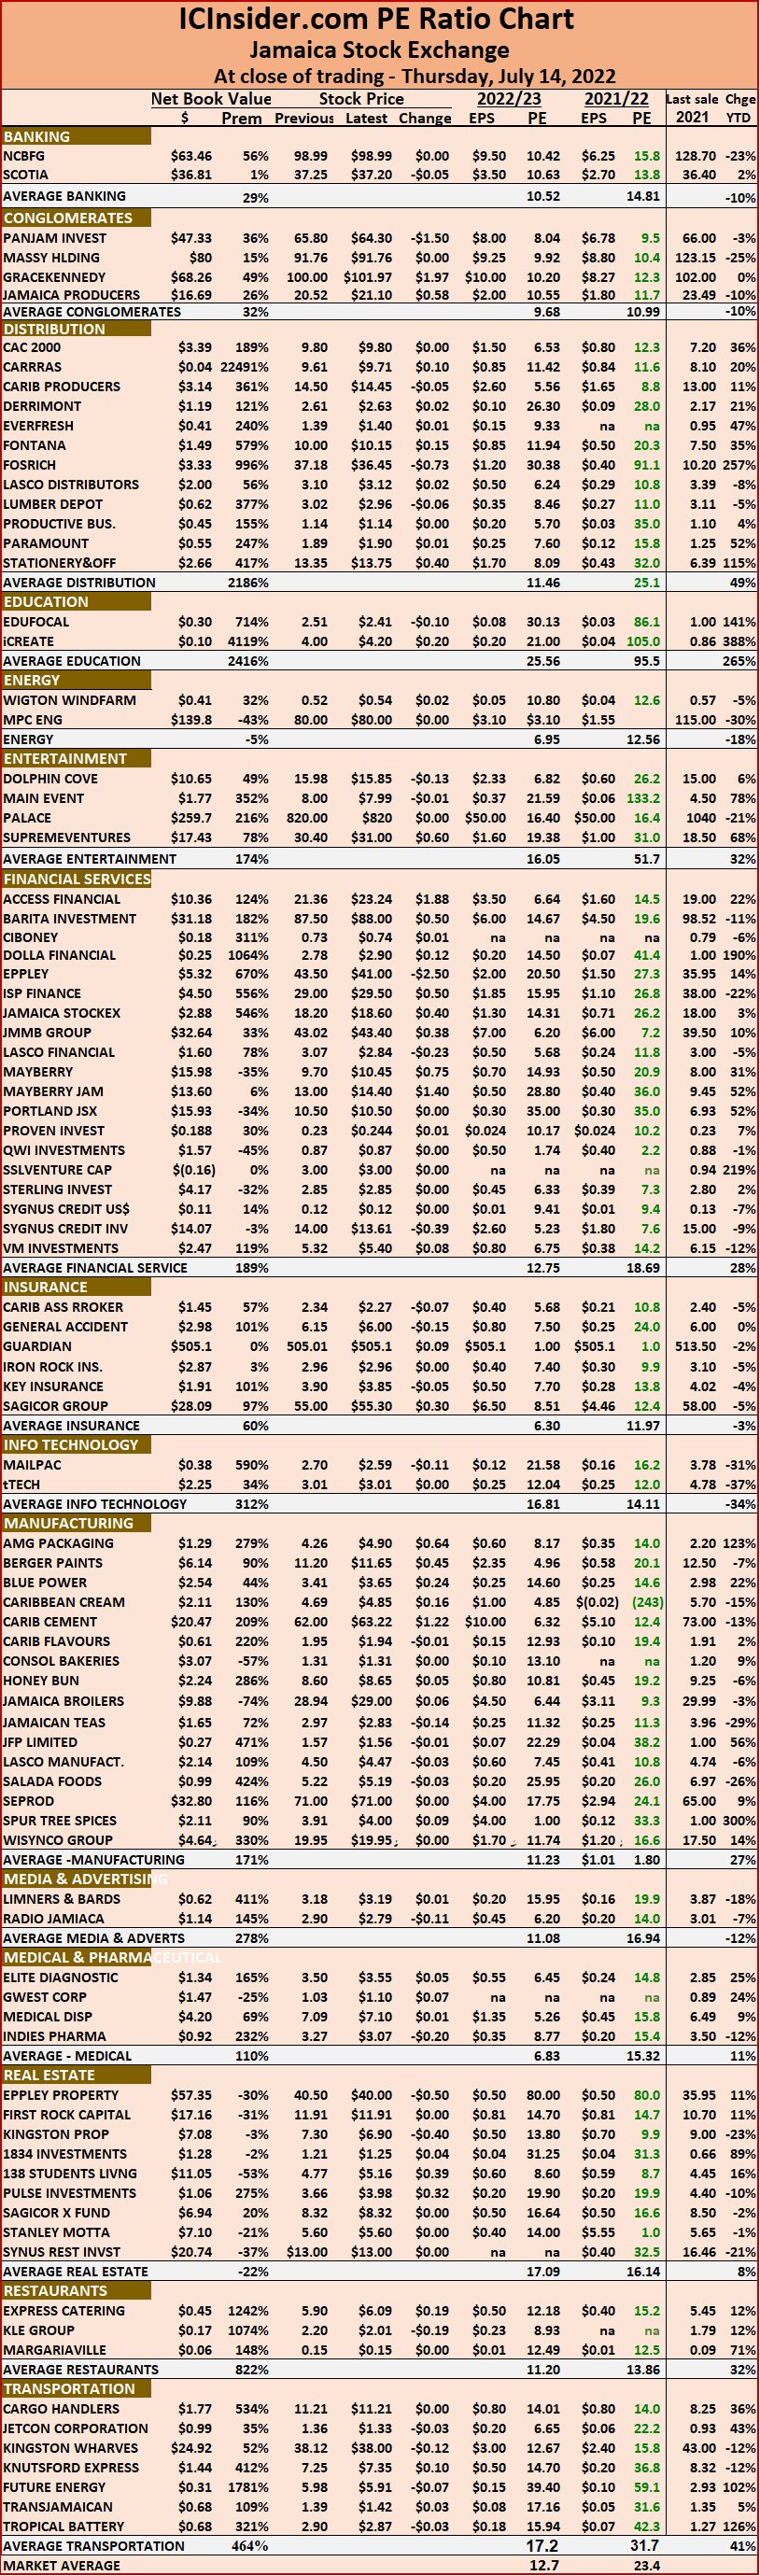 The ICInsider.com PE Ratio chart covers all ordinary shares on the Jamaica Stock Exchange. It shows companies grouped on an industry basis, allowing easy comparisons between the same sector companies and the overall market.
The net asset value of each company is reported as a guide to assess the value of stocks based on this measure quickly. The chart also shows daily changes in stock prices and the percentage year to date price movement based on the last traded prices. Dividends payable and yields for each company are shown in the Main and Junior Markets’ daily report charts that show the closing volume for the bids and offers.
The EPS & PE ratios are based on 2021 and 2022 actual or projected earnings, excluding major one off items. The PE Ratio is the most popular measure used to determine the value of stocks.
Sharp drop for Junior Market
Junior Market pulled back on Wednesday with the market index plunging 73.38 points to 4,327.00 with a pullback in prices of several stocks, with the Junior Market fall spilling over into the JSE Combined Index fell 310.14 points to end at 395,416.26.
Trading ended on the Jamaica Stock Exchange on Wednesday with 24,248,164 shares trading in the overall market, with a value of just $93.8 million, while the JSE USD market ended with US$6,586, following market consolidation.
At the close, the All Jamaican Composite Index rose 495.67 points to 436,241.57, the JSE Main Index added 374.05 points to close at 381,286.00 and the JSE USD market Index inched 0.41 points lower to 212.27.
The market’s PE ratio ended at 23.4 based on 2021-22 earnings and 12.7 times those for 2022-23 at the close of trading.
Investors need pertinent information to successfully navigate many investment choices, in the local stock market. The ICInsider.com PE ratio chart and the more detailed daily report charts provide investors with regularly updated information to help decision-making.
Investors should use the chart to help make rational investment decisions by investing in stocks close to the average for the sector and not going too far from it unless there are compelling reasons to do so. This approach helps to remove emotions from investment decisions and put in on fundamentals while at the same time not being too far from the majority of investors. Investors who buy when the price of a stock is close to the average will find that they are not inclined to overpay for a stock.
 The ICInsider.com PE Ratio chart covers all ordinary shares on the Jamaica Stock Exchange. It shows companies grouped on an industry basis, allowing easy comparisons between the same sector companies and the overall market.
The net asset value of each company is reported as a guide to assess the value of stocks based on this measure quickly. The chart also shows daily changes in stock prices and the percentage year to date price movement based on the last traded prices. Dividends payable and yields for each company are shown in the Main and Junior Markets’ daily report charts that show the closing volume for the bids and offers.
The EPS & PE ratios are based on 2021 and 2022 actual or projected earnings, excluding major one off items. The PE Ratio is the most popular measure used to determine the value of stocks.
Gains for Jamaica Stock Exchange
Trading remained moderate on the Jamaica Stock Exchange on Monday with a mere 21,150,413 shares trading in the overall market, with a value of just $117 million, while the JSE USD market ended with US$33,962 passing through the market, as the market closed with mixed results flowing from the current consolidating mood of the market.
 The JSE Combined Index rose 1,559.39 points to end at 395,726.41, the All Jamaican Composite Index climbed 1,325.22 points to 435,745.89, the JSE Main Index added 1,253.18 points to close at 380,911.94, the Junior Market Index rose 43.10 points to 4,400.38 and the JSE USD market Index dipped 0.87 points to 212.69.
The market’s PE ratio ended at 23.7 based on 2021-22 earnings and 12.9 times those for 2022-23 at the close of trading.
Investors need pertinent information to successfully navigate many investment choices in the local stock market. The ICInsider.com PE ratio chart and the more detailed daily report charts provide investors with regularly updated information to help decision-making.
Investors should use the chart to help make rational investment decisions by investing in stocks close to the average for the sector and not going too far from it unless there are compelling reasons to do so. This approach helps to remove emotions from investment decisions and put in on fundamentals while at the same time not being too far from the majority of investors. Investors who buy when the price of a stock is close to the average will find that they are not inclined to overpay for a stock.
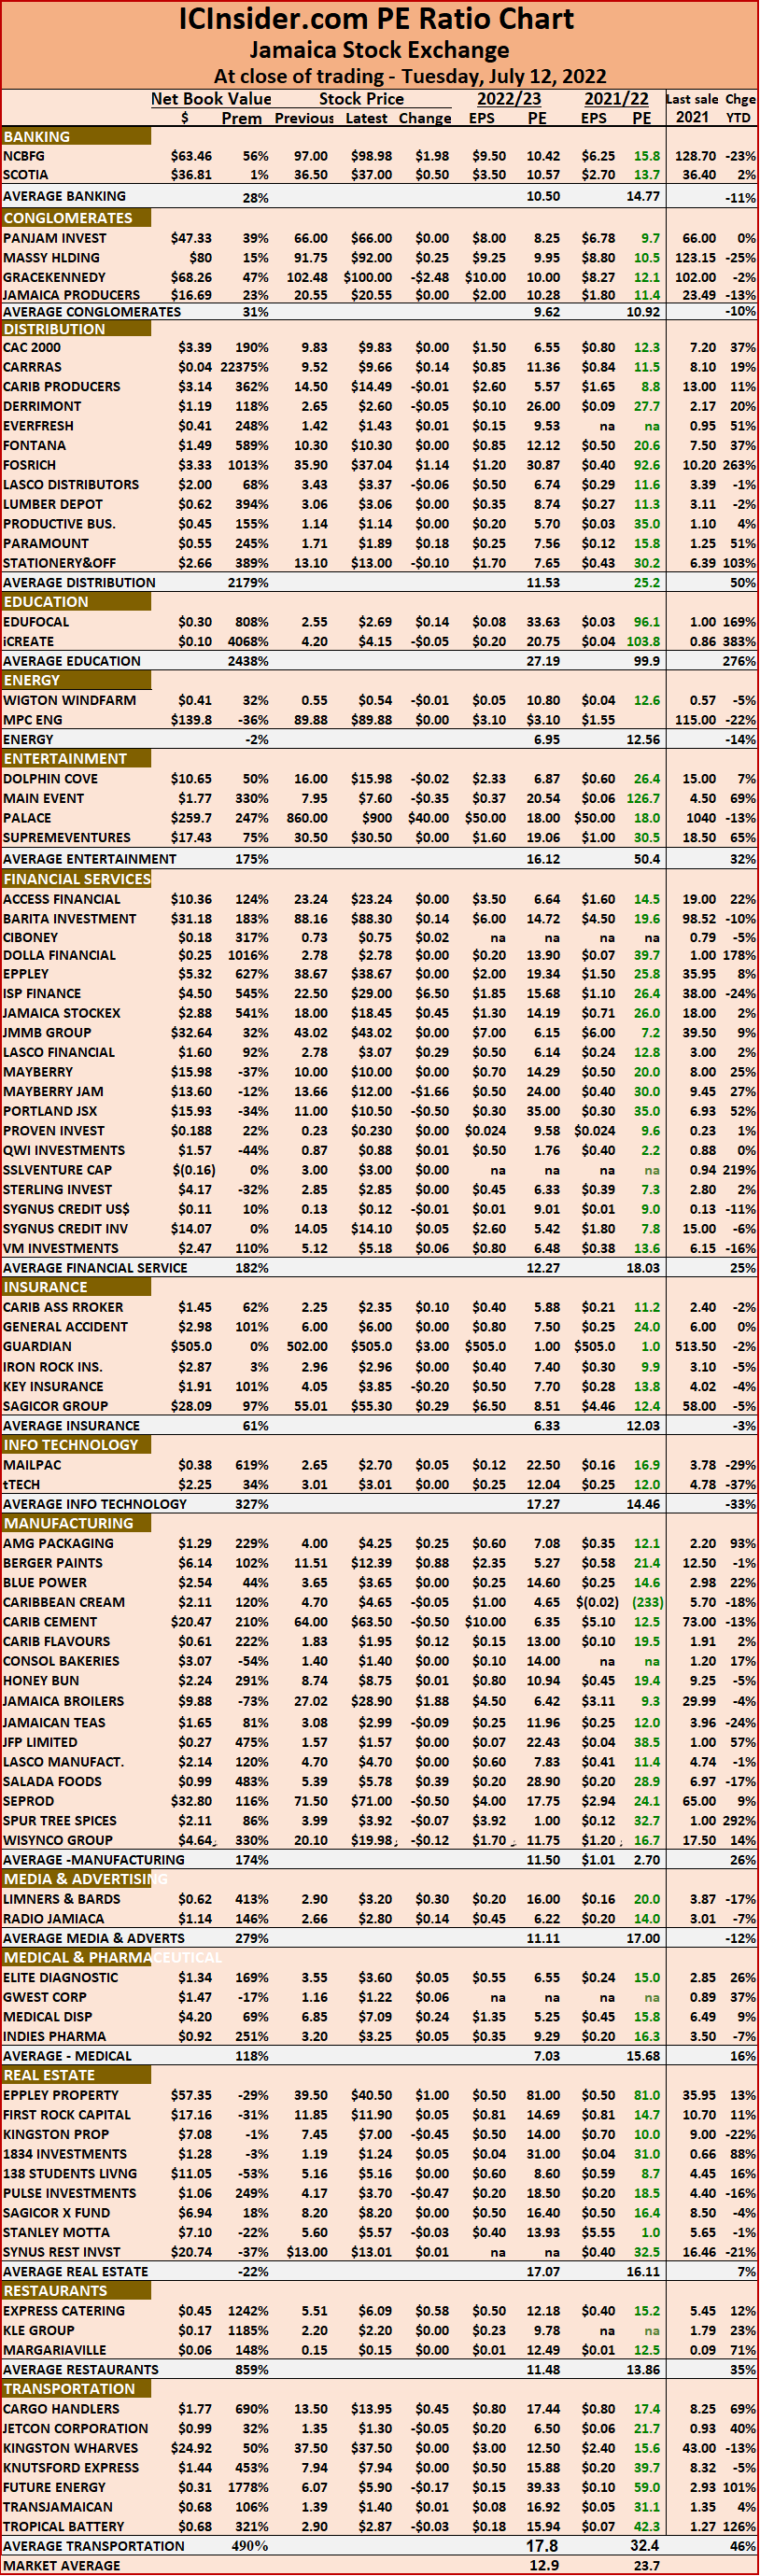 The ICInsider.com PE Ratio chart covers all ordinary shares on the Jamaica Stock Exchange. It shows companies grouped on an industry basis, allowing easy comparisons between the same sector companies and the overall market.
The net asset value of each company is reported as a guide to assess the value of stocks based on this measure quickly. The chart also shows daily changes in stock prices and the percentage year to date price movement based on the last traded prices. Dividends payable and yields for each company are shown in the Main and Junior Markets’ daily report charts that show the closing volume for the bids and offers.
The EPS & PE ratios are based on 2021 and 2022 actual or projected earnings, excluding major one off items. The PE Ratio is the most popular measure used to determine the value of stocks.
Decline for JSE Main Market
Trading remained moderate on the Jamaica Stock Exchange on Monday with 17,383,723 shares traded in the overall market, with a value of just $108.2 million, while the JSE USD market ended with US$18,398 passing through the market as the market closed with mixed results flowing from the current consolidating mood of the market.
 The JSE Combined Index lost 862.36 points to end at 394,167.02, while the All Jamaican Composite Index dropped 1,389.45 points to 434,420.67, the JSE Main Index shed 1,076.84 points to 379,658.76, the Junior Market Index rose 16.07 points to 4,356.28 and the JSE USD market Index popped 0.73 points to 213.56.
The market’s PE ratio ended at 23.5 based on 2021-22 earnings and 12.7 times those for 2022-23 at the close of trading.
Investors need pertinent information to successfully navigate many investment choices in the local stock market. The ICInsider.com PE ratio chart and the more detailed daily report charts provide investors with regularly updated information to help decision-making.
Investors should use the chart to help make rational investment decisions by investing in stocks close to the average for the sector and not going too far from it unless there are compelling reasons to do so. This approach helps to remove emotions from investment decisions and put in on fundamentals while at the same time not being too far from the majority of investors. Investors who buy when the price of a stock is close to the average will find that they are not inclined to overpay for a stock.
 The ICInsider.com PE Ratio chart covers all ordinary shares on the Jamaica Stock Exchange. It shows companies grouped on an industry basis, allowing easy comparisons between the same sector companies and the overall market.
The net asset value of each company is reported as a guide to assess the value of stocks based on this measure quickly. The chart also shows daily changes in stock prices and the percentage year to date price movement based on the last traded prices. Dividends payable and yields for each company are shown in the Main and Junior Markets’ daily report charts that show the closing volume for the bids and offers.
The EPS & PE ratios are based on 2021 and 2022 actual or projected earnings, excluding major one off items. The PE Ratio is the most popular measure used to determine the value of stocks.
Big gains for ICTOP10 stocks
The markets bobbed and weaved this past week as investors mostly remained on the sidelines until late this month, ahead of the imminent release of second quarter results. Notwithstanding, there were a few strong moves in both markets.
 In the Junior Market, Caribbean Cream climbed 16 percent to $4.66, followed by an 11 percent rise for Access Financial, while Lasco Distributors rose 7 percent to $3.43 and Elite Diagnostic gained 6 percent to close at $3.70. The Main Market saw Key Insurance jumping 23 percent to $4.17.
The Main Market, Radio Jamaica, dropped 15 percent to $2.47 and Berger Paints gave up 10 percent at $11. In the Junior Market, Medical Disposables, CAC 2000 and Lasco Financial fell 5 percent.
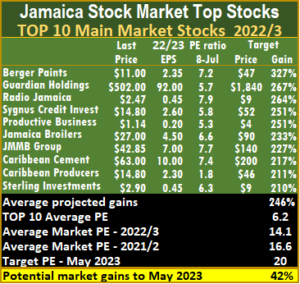
The week ended with one new listing in the TOP10 Main market as Key Insurance moved on with the strong gain mentioned above and Jamaica Broilers surged in following a jump in projected earnings after posting full year results.
 Keep a careful watch on AMG Packaging, Dolphin Cove, Express Catering, General Accident Lasco Distributors, Lasco Manufacturing and Stationery and Office Supplies. Dolphin Cove, Caribbean Producers, Express Catering will be significant beneficiaries of the strong rebound in tourist arrivals and the supply of General Accident has declined sharply over the past few weeks.
The average PE for the JSE Main Market TOP 10 is 6.2, well below the market average of 14.1, while the Junior Market Top 10 PE is 6.1 versus the market at 13.2. The Junior Market TOP10 is projected to gain an average of 235 percent to May 2023 and the Main Market 244 percent.
ICTOP10 focuses on likely yearly winners, accordingly, the list includes some of the best companies in the market but not always. 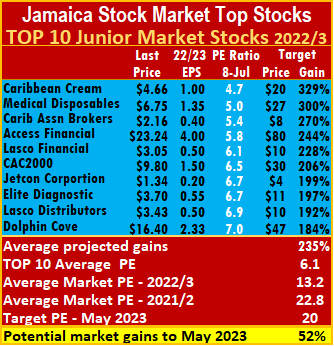 ICInsider.com ranks stocks based on projected earnings to highlight winners from the rest, allowing investors to focus on potential winning stocks and helping to remove emotions from selecting stocks that often result in costly mistakes.
IC TOP10 stocks are likely to deliver the best returns up to the end of May 2023 and are ranked in order of potential gains, computed using projected earnings for the current fiscal year. Expected values will change as stock prices fluctuate, resulting in weekly movements in and out of the lists. Revisions to earnings are ongoing, based on receipt of new information.
Persons who compiled this report may have an interest in securities commented on in this report.
Decline for Jamaican Stock Exchange
Trading declined moderately on the Jamaica Stock Exchange on Friday with 17,172,004 shares traded in the overall market, with an exchange of $128.2 million worth of shares, while the JSE USD market ended with US$8,982 passing through the market as all three markets suffered declines in their indices.
The JSE Combined Index lost 1,232.06 points to end at 395,029.38, while the All Jamaican Composite Index dropped 638.67 points to 436,010.12, the JSE Main Index shed 1,167.36 points to 380,735.60, the Junior Market Index slipped 25.44 points to 4,341.21 and the JSE USD market Index dipped 1.97 points to 212.83.
The market’s PE ratio ended at 23.6 based on 2021-22 earnings and 13 times those for 2022-23 at the close of trading.
Investors need pertinent information to successfully navigate the many investment choices, in the local stock market. The ICInsider.com PE ratio chart and the more detailed daily report charts provide investors with regularly updated information to help decision-making.
Investors should use the chart to help make rational investment decisions by investing in stocks close to the average for the sector and not going too far from it unless there are compelling reasons to do so. This approach helps to remove emotions from investment decisions and put in on fundamentals while at the same time not being too far from the majority of investors. Investors who buy when the price of a stock is close to the average will find that they are not inclined to overpay for a stock.
 The ICInsider.com PE Ratio chart covers all ordinary shares on the Jamaica Stock Exchange. It shows companies grouped on an industry basis, allowing easy comparisons between the same sector companies and the overall market.
The net asset value of each company is reported as a guide to assess the value of stocks based on this measure quickly. The chart also shows daily changes in stock prices and the percentage year to date price movement based on the last traded prices. Dividends payable and yields for each company are shown in the Main and Junior Markets’ daily report charts that show the closing volume for the bids and offers.
The EPS & PE ratios are based on 2021 and 2022 actual or projected earnings, excluding major one off items. The PE Ratio is the most popular measure used to determine the value of stocks.
Jamaican Stock Exchange mostly rise
Trading remained moderate on the Jamaica Stock Exchange on Thursday with 18,818,877 shares traded in the overall market, ending with $194.5 million worth of shares trading, while the JSE USD market ended with US$49,241 passing through the market.
 The main market closed slightly higher than on Wednesday while the Junior Market slipped modestly. At the close, the JSE Combined Index rose 232.92 points to 396,261.44, while the All Jamaican Composite Index popped 1,484.02 points to 436,648.80, the JSE Main Index popped 331.94 points to 381,902.96, the Junior Market Index slipped 4.54 points to 4,356.89 and the JSE USD market Index gained 1.01 points to close at 214.80 The market’s PE ratio ended at 23.5 based on 2021-22 earnings and 13 times those for 2022-23 at the close of trading.
Investors need pertinent information to successfully navigate many investment choices, in the local stock market. The ICInsider.com PE ratio chart and the more detailed daily report charts provide investors with regularly updated information to help decision-making.
Investors should use the chart to help make rational investment decisions by investing in stocks close to the average for the sector and not going too far from it unless there are compelling reasons to do so. This approach helps to remove emotions from investment decisions and put in on fundamentals while at the same time not being too far from the majority of investors. Investors who buy when the price of a stock is close to the average will find that they are not inclined to overpay for a stock.
 The ICInsider.com PE Ratio chart covers all ordinary shares on the Jamaica Stock Exchange. It shows companies grouped on an industry basis, allowing easy comparisons between the same sector companies and the overall market.
The net asset value of each company is reported as a guide to assess the value of stocks based on this measure quickly. The chart also shows daily changes in stock prices and the percentage year to date price movement based on the last traded prices. Dividends payable and yields for each company are shown in the Main and Junior Markets’ daily report charts that show the closing volume for the bids and offers.
The EPS & PE ratios are based on 2021 and 2022 actual or projected earnings, excluding major one off items. The PE Ratio is the most popular measure used to determine the value of stocks.
Back to normal for Jamaican Stock Exchange
Trading fell back in line with more recent activities on the Jamaica Stock Exchange, following Tuesday’s big Future Energy Source trade of 241.4 million, valued at $1.44 billion as the markets closed on Wednesday with just 18,045,079 shares traded in the overall market and the Main and Junior Markets ending with $122.8 million worth of shares trading and the JSE USD market, with US$$15,558.
 The Main Market ended lower but the Junior Market gained. The JSE Combined Index slipped 16.78 points to 396,028.51, while the All Jamaican Composite Index dived 2,438.78 points to 435,164.77 and the JSE Main Index fell 488.85 points to close at 381,571.02. The Junior Market index rallied 48.92 points to 4,365.44 and the JSE USD market index slipped 1.09 points to 213.79.
The market’s PE ratio ended at 23.5 based on 2021-22 earnings and 13 times those for 2022-23 at the close of trading.
Investors need pertinent information to successfully navigate many investment choices, in the local stock market. The ICInsider.com PE ratio chart and the more detailed daily report charts provide investors with regularly updated information to help decision-making.
Investors should use the chart to help make rational investment decisions by investing in stocks close to the average for the sector and not going too far from it unless there are compelling reasons to do so. This approach helps to remove emotions from investment decisions and put in on fundamentals while at the same time not being too far from the majority of investors. Investors who buy when the price of a stock is close to the average will find that they are not inclined to overpay for a stock.
 The ICInsider.com PE Ratio chart covers all ordinary shares on the Jamaica Stock Exchange. It shows companies grouped on an industry basis, allowing easy comparisons between the same sector companies and the overall market.
The net asset value of each company is reported as a guide to assess the value of stocks based on this measure quickly. The chart also shows daily changes in stock prices and the percentage year to date price movement based on the last traded prices. Dividends payable and yields for each company are shown in the Main and Junior Markets’ daily report charts that show the closing volume for the bids and offers.
The EPS & PE ratios are based on 2021 and 2022 actual or projected earnings, excluding major one off items. The PE Ratio is the most popular measure used to determine the value of stocks.