Trading drops on the JSE Wednesday

The Junior Market was the only Jamaica Stock Exchange market to record gains in Wednesday’s trading, while the Main Market declined moderately, resulting in the JSE Combined Index, a measure of the overall market, falling 620.61 points to close at three 367,538.63.
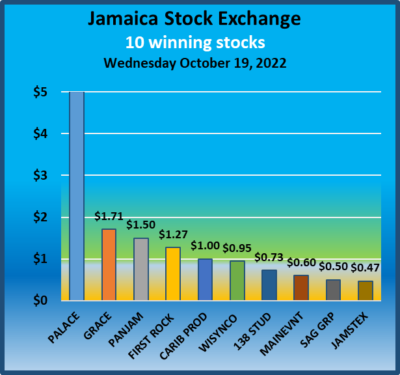
NB Palace gain on Wednesday is $40 and not $5 as shown in the chart.

The All Jamaican Composite Index dropped 1,165.48 points to 404,873.54, the JSE Main Index fell 906.66 points to 353,247.24, the Junior Market Index rose 24.95 points to 4,141.88 and the JSE USD market Index dropped 19.24 points to close at 192.29.
Trading ended, with 28,261,215 shares changing hands, at a mere $63.6 million, down from $102.4 million, with 14,308,105 shares traded in all markets on the previous day. The JSE USD market ended with the value of stocks traded at US$21,025 from US$41,204 on Tuesday.
The market’s PE ratio ended at 23.6 based on 2021-22 earnings and 12.6 times those for 2022-23 at the close of trading.
Investors need pertinent information to navigate many investment options in the local stock market successfully. The ICInsider.com PE ratio chart and the more detailed daily report charts provide investors with regularly updated information to help decision-making.
Investors should use the chart to help make rational investment decisions by investing in stocks close to the average for the sector and not going too far from it unless there are compelling reasons to do so. This approach helps to remove emotions from investment decisions and put in on fundamentals while at the same time not being too far from the majority of investors. Investors who buy when the price of a stock is close to the average will find that they are not inclined to overpay for a stock.
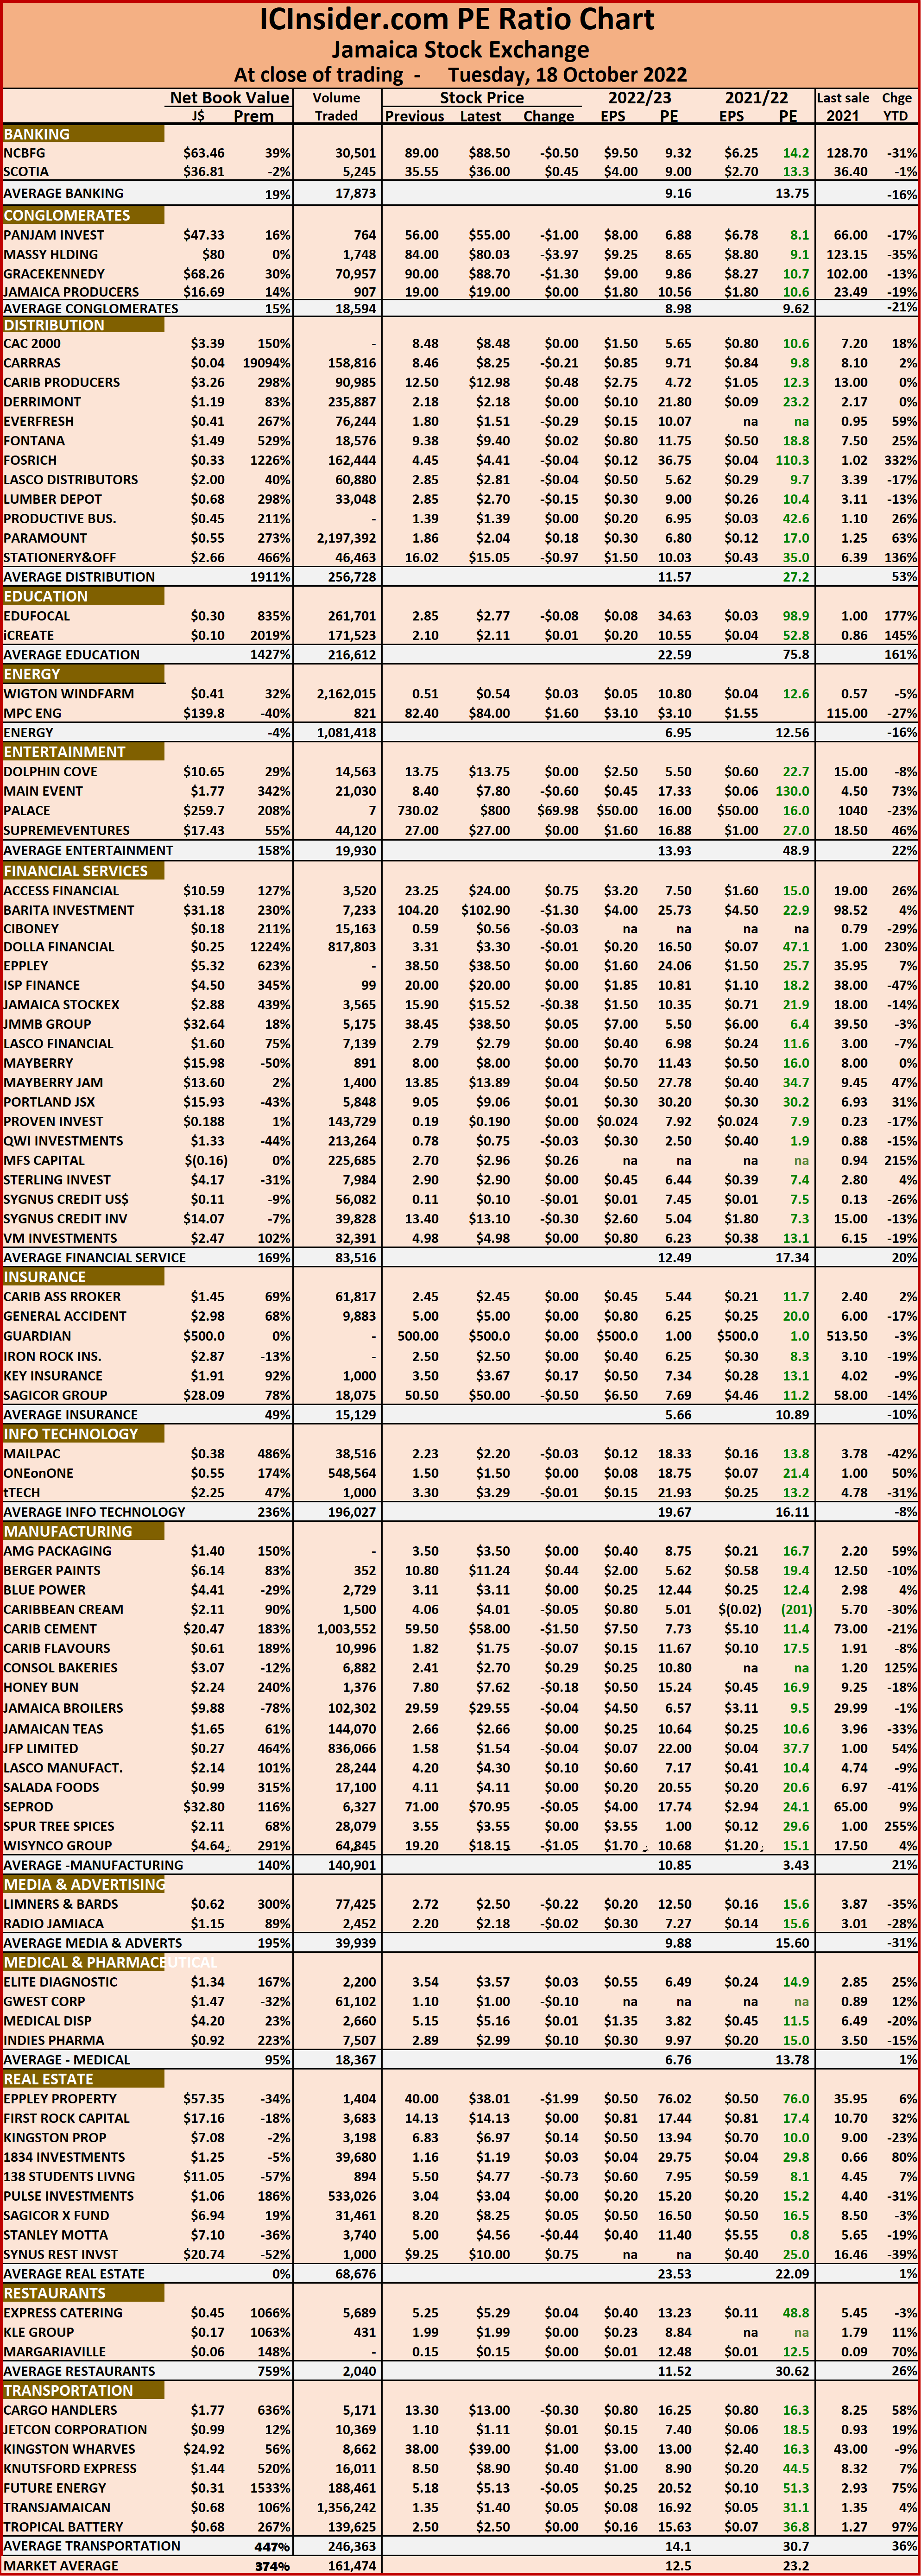
The ICInsider.com PE Ratio chart covers all ordinary shares on the Jamaica Stock Exchange. It shows companies grouped on an industry basis, allowing easy comparisons between the same sector companies and the overall market.
The net asset value of each company is reported as a guide to assess the value of stocks based on this measure quickly. The chart also shows daily changes in stock prices and the percentage year to date price movement based on the last traded prices. Dividends payable and yields for each company are shown in the Main and Junior Markets’ daily report charts that show the closing volume for the bids and offers.
The EPS & PE ratios are based on 2021 and 2022 actual or projected earnings, excluding major one off items. The PE Ratio is the most popular measure used to determine the value of stocks.


Steady trading continues for the JSE

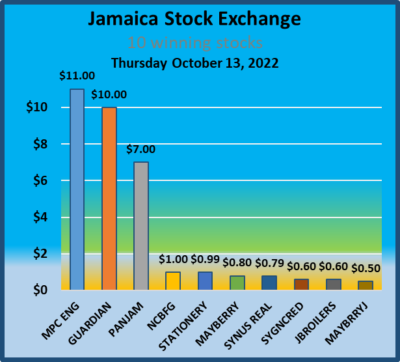
Palace gained $69.95 in Tuesday’s trading, which is not fully reflected in the above chart.

The Junior Market was the only Jamaica Stock Exchange market to record gains in Tuesday’s trading, while the US and the Main Market declined moderately, resulting in the JSE Combined Index, a measure of the overall market, falling 1,318.44 points to close at 368,159.24.
The All Jamaican Composite Index dropped 335.04 points to 406,039.02, the JSE Main Index fell 1,583.59 points to 354,153.90, the Junior Market Index rose 17.73 points to 4,116.93 and the JSE USD market Index slipped 0.88 points to close at 211.53.
Trading ended, with 14,308,105 shares changing hands, at $102.4 million, down from $114.5 million, with 21,014,171 shares traded in all markets on the previous trading day. The JSE USD market ended with the value of stocks traded at US$41,204 from US$5,262 on Friday.
The market’s PE ratio ended at 23.2 based on 2021-22 earnings and 12.5 times those for 2022-23 at the close of trading.
Investors need pertinent information to successfully navigate many investment options in the local stock market. The ICInsider.com PE ratio chart and the more detailed daily report charts provide investors with regularly updated information to help decision-making.
Investors should use the chart to help make rational investment decisions by investing in stocks close to the average for the sector and not going too far from it unless there are compelling reasons to do so. This approach helps to remove emotions from investment decisions and put in on fundamentals while at the same time not being too far from the majority of investors. Investors who buy when the price of a stock is close to the average will find that they are not inclined to overpay for a stock.
The ICInsider.com PE Ratio chart covers all ordinary shares on the Jamaica Stock Exchange. It shows companies grouped on an industry basis, allowing easy comparisons between the same sector companies and the overall market.
The net asset value of each company is reported as a guide to assess the value of stocks based on this measure quickly. The chart also shows daily changes in stock prices and the percentage year to date price movement based on the last traded prices. Dividends payable and yields for each company are shown in the Main and Junior Markets’ daily report charts that show the closing volume for the bids and offers.
The EPS & PE ratios are based on 2021 and 2022 actual or projected earnings, excluding major one off items. The PE Ratio is the most popular measure used to determine the value of stocks.


Trading picked up but JSE markets fall

Trading picked up sharply on the Jamaica Stock Exchange but the markets all dropped again on Thursday resulting in the JSE Combined Index, a measure of the overall market, falling 1,813.79 points to close at 369,621.51.
The All Jamaican Composite Index dropped 1,662.75 points to 406 874.27, the JSE Main Index fell 1,570.82 points to 356,095.93, the Junior Market Index shed 38.20 points to 4,078.14 and the JSE USD market Index slipped 3.15 points to close at 212.02.
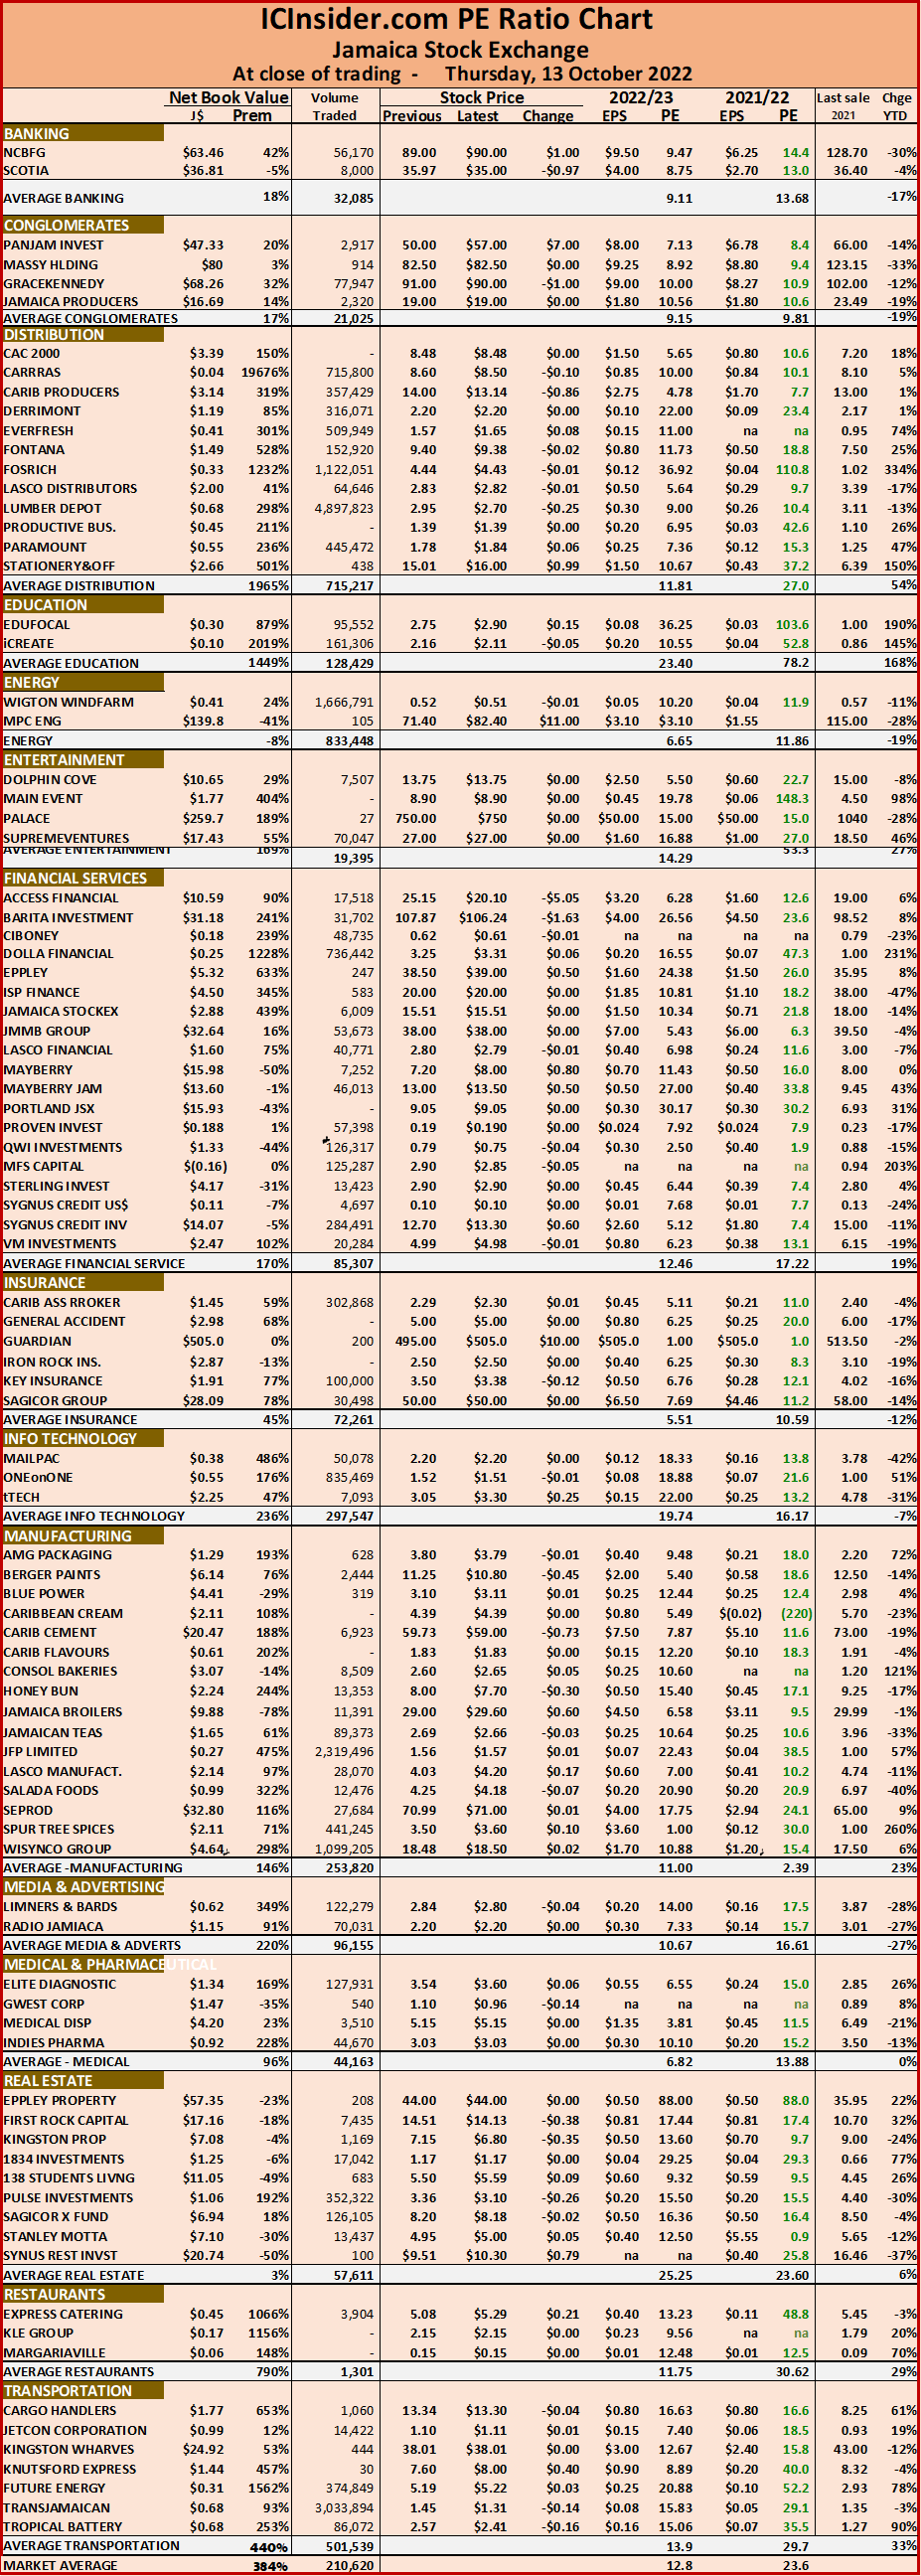
Trading ended, with 24,727,814 shares changing hands, at $107.9 million, up from $91 million, with 14,099,659 shares traded in all markets on the previous day. The JSE USD market ended with the value of stocks traded at US$18,682 from US$14,727 on Tuesday.
The market’s PE ratio ended at 23.6 based on 2021-22 earnings and 12.8 times those for 2022-23 at the close of trading.
Investors need pertinent information to successfully navigate many investment options in the local stock market. The ICInsider.com PE ratio chart and the more detailed daily report charts provide investors with regularly updated information to help decision-making.
Investors should use the chart to help make rational investment decisions by investing in stocks close to the average for the sector and not going too far from it unless there are compelling reasons to do so. This approach helps to remove emotions from investment decisions and put in on fundamentals while at the same time not being too far from the majority of investors. Investors who buy when the price of a stock is close to the average will find that they are not inclined to overpay for a stock.
The ICInsider.com PE Ratio chart covers all ordinary shares on the Jamaica Stock Exchange. It shows companies grouped on an industry basis, allowing easy comparisons between the same sector companies and the overall market.
The net asset value of each company is reported as a guide to assess the value of stocks based on this measure quickly. The chart also shows daily changes in stock prices and the percentage year to date price movement based on the last traded prices. Dividends payable and yields for each company are shown in the Main and Junior Markets’ daily report charts that show the closing volume for the bids and offers.
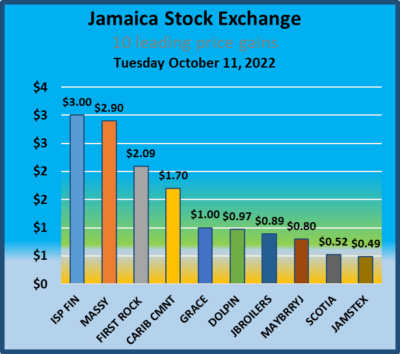
The EPS & PE ratios are based on 2021 and 2022 actual or projected earnings, excluding major one off items. The PE Ratio is the most popular measure used to determine the value of stocks.

Modest Jamaican Stock Exchange changes

Marginal changes were the order of the day on the three markets of the Jamaica Stock Exchange at the close on Tuesday leading the JSE Combined Index, a measure of the overall market, with a marginal rise of 136.17 points to 373,382.36 at the close.
The All Jamaican Composite Index popped 436.67 points to 410,175.31, the JSE Main Index rose 293.25 points to 359,209.37, the Junior Market Index shed 15.18 points to 4,141.94 and the JSE USD market Index slipped 0.87 points to close at 217.04.
Trading ended, with 15,816,154 shares changing hands, at $66.78 million, down from $74.8 million, with 14,216,541 shares traded in all markets on the previous day. The JSE USD market ended with the value of stocks traded at US$85,810 from US$12,768 on Monday.
The market’s PE ratio ended at 23.2 based on 2021-22 earnings and 12.6 times those for 2022-23 at the close of trading.
Investors need pertinent information to navigate many investment options in the local stock market successfully. The ICInsider.com PE ratio chart and the more detailed daily report charts provide investors with regularly updated information to help decision-making.
Investors should use the chart to help make rational investment decisions by investing in stocks close to the average for the sector and not going too far from it unless there are compelling reasons to do so. This approach helps to remove emotions from investment decisions and put in on fundamentals while at the same time not being too far from the majority of investors. Investors who buy when the price of a stock is close to the average will find that they are not inclined to overpay for a stock.
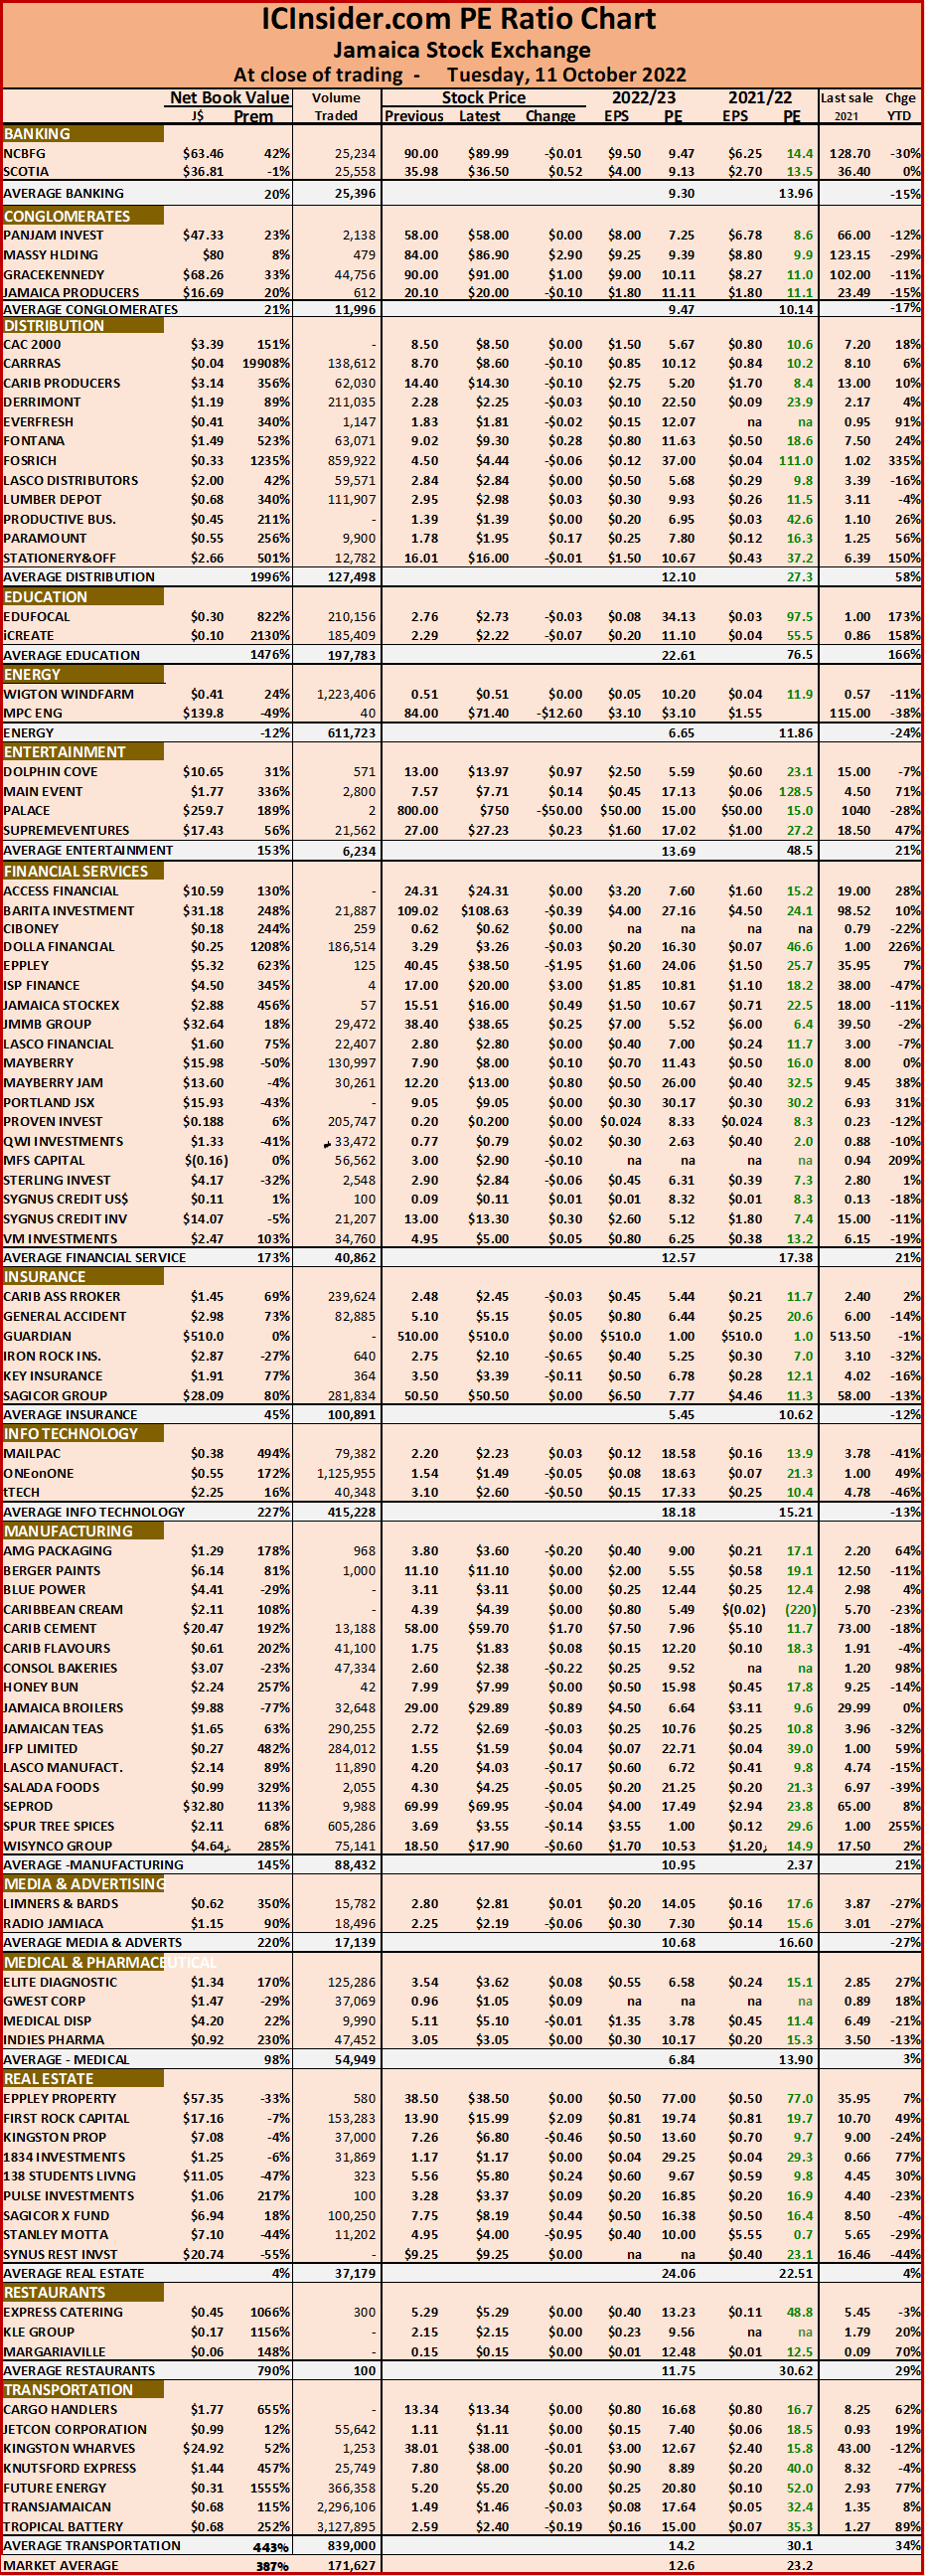
The ICInsider.com PE Ratio chart covers all ordinary shares on the Jamaica Stock Exchange. It shows companies grouped on an industry basis, allowing easy comparisons between the same sector companies and the overall market.
The net asset value of each company is reported as a guide to assess the value of stocks based on this measure quickly. The chart also shows daily changes in stock prices and the percentage year to date price movement based on the last traded prices. Dividends payable and yields for each company are shown in the Main and Junior Markets’ daily report charts that show the closing volume for the bids and offers.
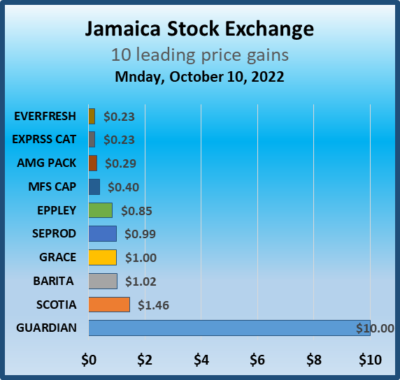
The EPS & PE ratios are based on 2021 and 2022 actual or projected earnings, excluding major one off items. The PE Ratio is the most popular measure used to determine the value of stocks.

Mixed results for Jamaican stocks

The Main Market of the Jamaica Stock Exchange closed higher on Monday but the JSE USD market and the Junior Market pulled back from Friday’s close and leaving the JSE Combined Index, a measure of the overall market, with a moderate gain of 249.46 points to finish at 373,246.18 at the close.
The All Jamaican Composite Index popped 529.05 points to 409,683.84, the JSE Main Index climbed 449.27 points to 359,209.37, the Junior Market Index shed 18.77 points to 4,1 57.12 and the JSE USD market Index slipped 4.59 points to close at 217.91
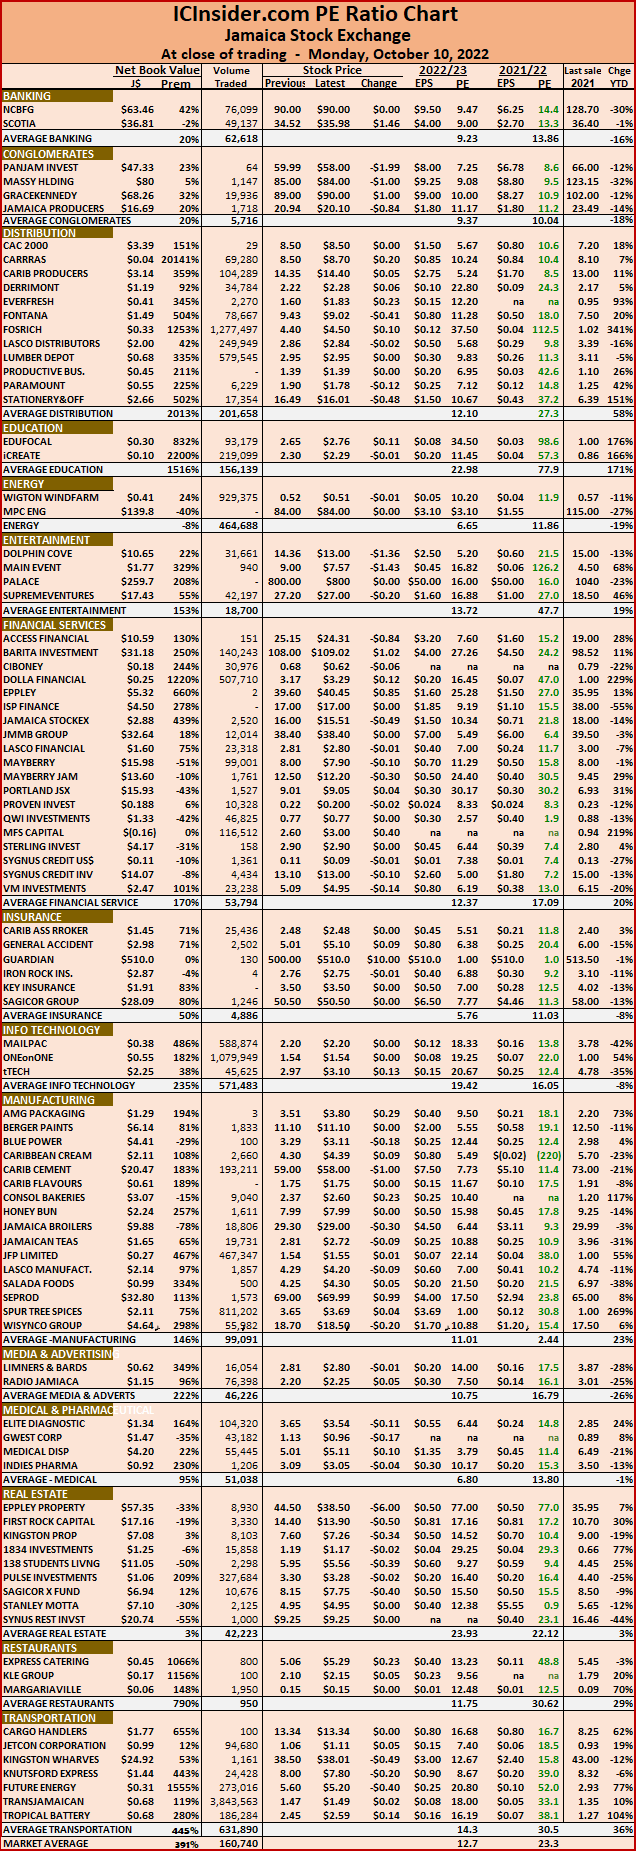
Trading ended, with 14,216,541 shares changing hands, at $74.8 million, down from $118.2 million, with 26,446,637 shares traded in all markets on the previous day. The JSE USD market ended with the value of stocks traded at US$12,768 from US$26,409 on Friday.
The market’s PE ratio ended at 23.3 based on 2021-22 earnings and 12.7 times those for 2022-23 at the close of trading.
Investors need pertinent information to navigate many investment options in the local stock market successfully. The ICInsider.com PE ratio chart and the more detailed daily report charts provide investors with regularly updated information to help decision-making.
Investors should use the chart to help make rational investment decisions by investing in stocks close to the average for the sector and not going too far from it unless there are compelling reasons to do so. This approach helps to remove emotions from investment decisions and put in on fundamentals while at the same time not being too far from the majority of investors. Investors who buy when the price of a stock is close to the average will find that they are not inclined to overpay for a stock.
The ICInsider.com PE Ratio chart covers all ordinary shares on the Jamaica Stock Exchange. It shows companies grouped on an industry basis, allowing easy comparisons between the same sector companies and the overall market.
The net asset value of each company is reported as a guide to assess the value of stocks based on this measure quickly. The chart also shows daily changes in stock prices and the percentage year to date price movement based on the last traded prices. Dividends payable and yields for each company are shown in the Main and Junior Markets’ daily report charts that show the closing volume for the bids and offers.
The EPS & PE ratios are based on 2021 and 2022 actual or projected earnings, excluding major one off items. The PE Ratio is the most popular measure used to determine the value of stocks.


More gains for Jamaican stocks

The Main Market of the Jamaica Stock Exchange and the JSE USD market recorded more gains on Friday, but the Junior Market pulled back from Thursday’s strong and leaving the JSE Combined Index, a measure of the overall market, climbed 1,443.04 points to 372,996.72.
The All Jamaican Composite Index popped 601.52 points to 409,154.78, the JSE Main Index jumped 1,744.69 points to 358,760.10, the Junior Market Index shed 20.57 points to 4,175.89 and the JSE USD market Index added 1.25 points to close at 222.51.
Trading ended, with 26,446,637 shares changing hands, at $118.2 million, up from $149.7 million, with 21,520,578 shares traded in all markets on the previous day. The JSE USD market ended with the value of stocks traded at US$26,409 from US$8,280 on Thursday.
The market’s PE ratio ended at 23.7 based on 2021-22 earnings and 12.8 times those for 2022-23 at the close of trading.
Investors need pertinent information to successfully navigate many investment options in the local stock market. The ICInsider.com PE ratio chart and the more detailed daily report charts provide investors with regularly updated information to help decision-making.
Investors should use the chart to help make rational investment decisions by investing in stocks close to the average for the sector and not going too far from it unless there are compelling reasons to do so. This approach helps to remove emotions from investment decisions and put in on fundamentals while at the same time not being too far from the majority of investors. Investors who buy when the price of a stock is close to the average will find that they are not inclined to overpay for a stock.
The ICInsider.com PE Ratio chart covers all ordinary shares on the Jamaica Stock Exchange. It shows companies grouped on an industry basis, allowing easy comparisons between the same sector companies and the overall market.
The net asset value of each company is reported as a guide to assess the value of stocks based on this measure quickly. The chart also shows daily changes in stock prices and the percentage year to date price movement based on the last traded prices. Dividends payable and yields for each company are shown in the Main and Junior Markets’ daily report charts that show the closing volume for the bids and offers.
The EPS & PE ratios are based on 2021 and 2022 actual or projected earnings, excluding major one off items. The PE Ratio is the most popular measure used to determine the value of stocks.


Solid gains for Jamaican stock markets

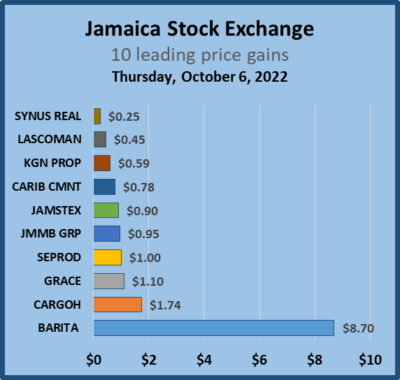
All three Jamaica Stock Exchange markets recorded strong gains on Thursday, with the Junior Market jumping 70.28 points to 4,196.47, while the JSE USD market rose 4.42 points to close at 221.26 leading the JSE Combined Index, a measure of the overall market, to climb 2,508.68 points to 371,553.67.
The All Jamaican Composite Index popped 3,348.14, points to 408,553.26 and the JSE Main Index jumped 2,003.26 points to 357,015.40.
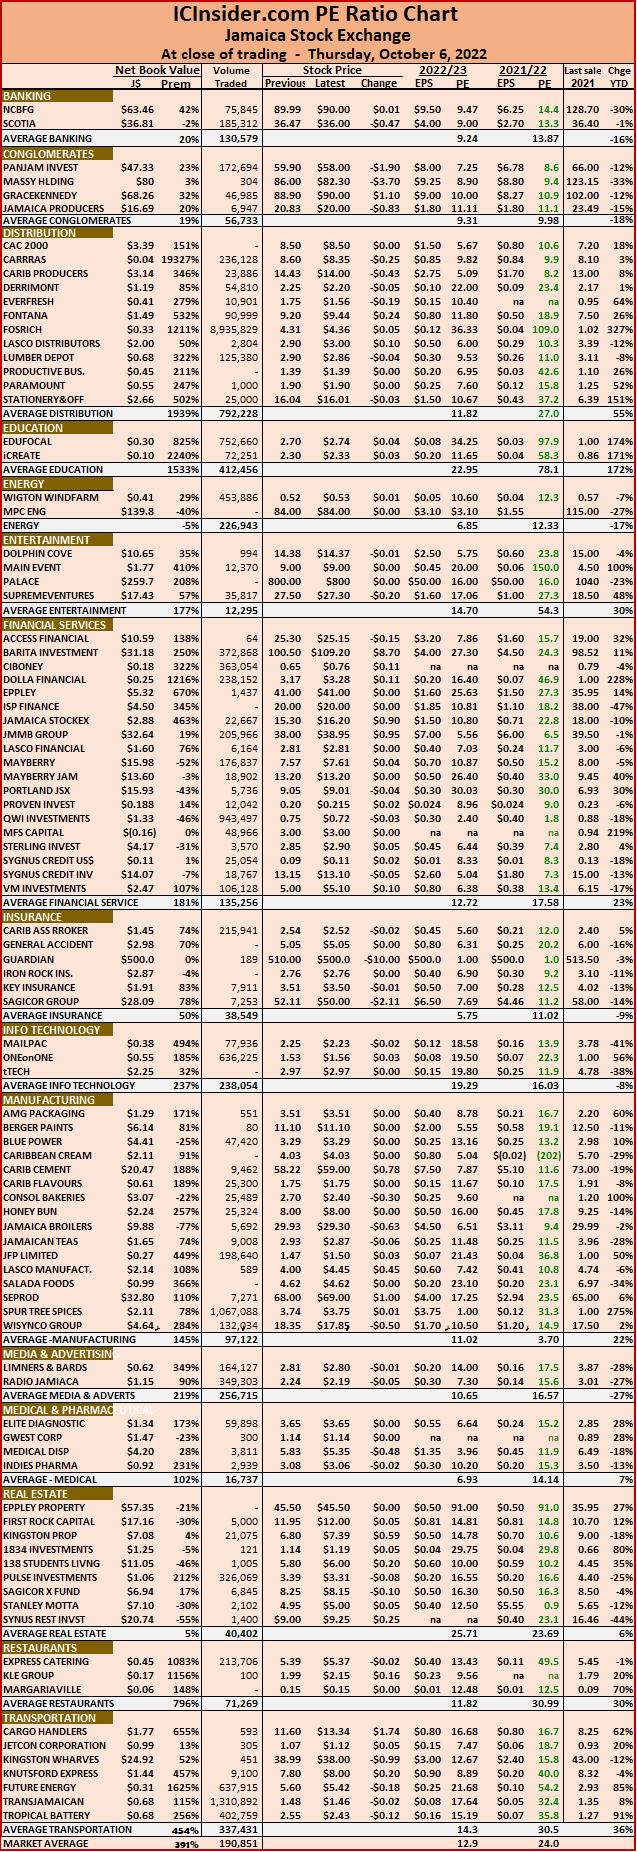
A total of 21,520,578 shares changed hands, for $149.7 million, up from $186.4 million, with 23,968,005 shares traded in all markets on the previous day. The JSE USD market ended with the value of stocks traded at US$8,280 from US$11,486 on Wednesday.
The market’s PE ratio ended at 24 based on 2021-22 earnings and 12.9 times those for 2022-23 at the close of trading.
Investors need pertinent information to successfully navigate many investment options in the local stock market. The ICInsider.com PE ratio chart and the more detailed daily report charts provide investors with regularly updated information to help decision-making.
Investors should use the chart to help make rational investment decisions by investing in stocks close to the average for the sector and not going too far from it unless there are compelling reasons to do so. This approach helps to remove emotions from investment decisions and put in on fundamentals while at the same time not being too far from the majority of investors. Investors who buy when the price of a stock is close to the average will find that they are not inclined to overpay for a stock.
The ICInsider.com PE Ratio chart covers all ordinary shares on the Jamaica Stock Exchange. It shows companies grouped on an industry basis, allowing easy comparisons between the same sector companies and the overall market.
The net asset value of each company is reported as a guide to assess the value of stocks based on this measure quickly. The chart also shows daily changes in stock prices and the percentage year to date price movement based on the last traded prices. Dividends payable and yields for each company are shown in the Main and Junior Markets’ daily report charts that show the closing volume for the bids and offers.
The EPS & PE ratios are based on 2021 and 2022 actual or projected earnings, excluding major one off items. The PE Ratio is the most popular measure used to determine the value of stocks.

Trading dropped drops again

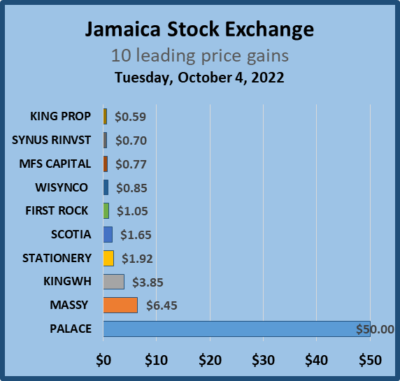
Stocks retreated by the close of trading on the Jamaica Stock Exchange on Tuesday in the Main and Junior Markets but rose in the JSE USD market, after traded volume of socks roses with a lower value than Tuesday, leaving the JSE Combined Index, a measure of the overall market, falling 1,871.06 points to 373,225.06.
The All Jamaican Composite Index popped 4,027.86 points to 410,104.57, the JSE Main Index fell 1,429.05 points to 359,272.56, the Junior Market Index shed 59.11 points to 4,148.29 and the JSE USD market Index added 4.63 points to close 217.29.
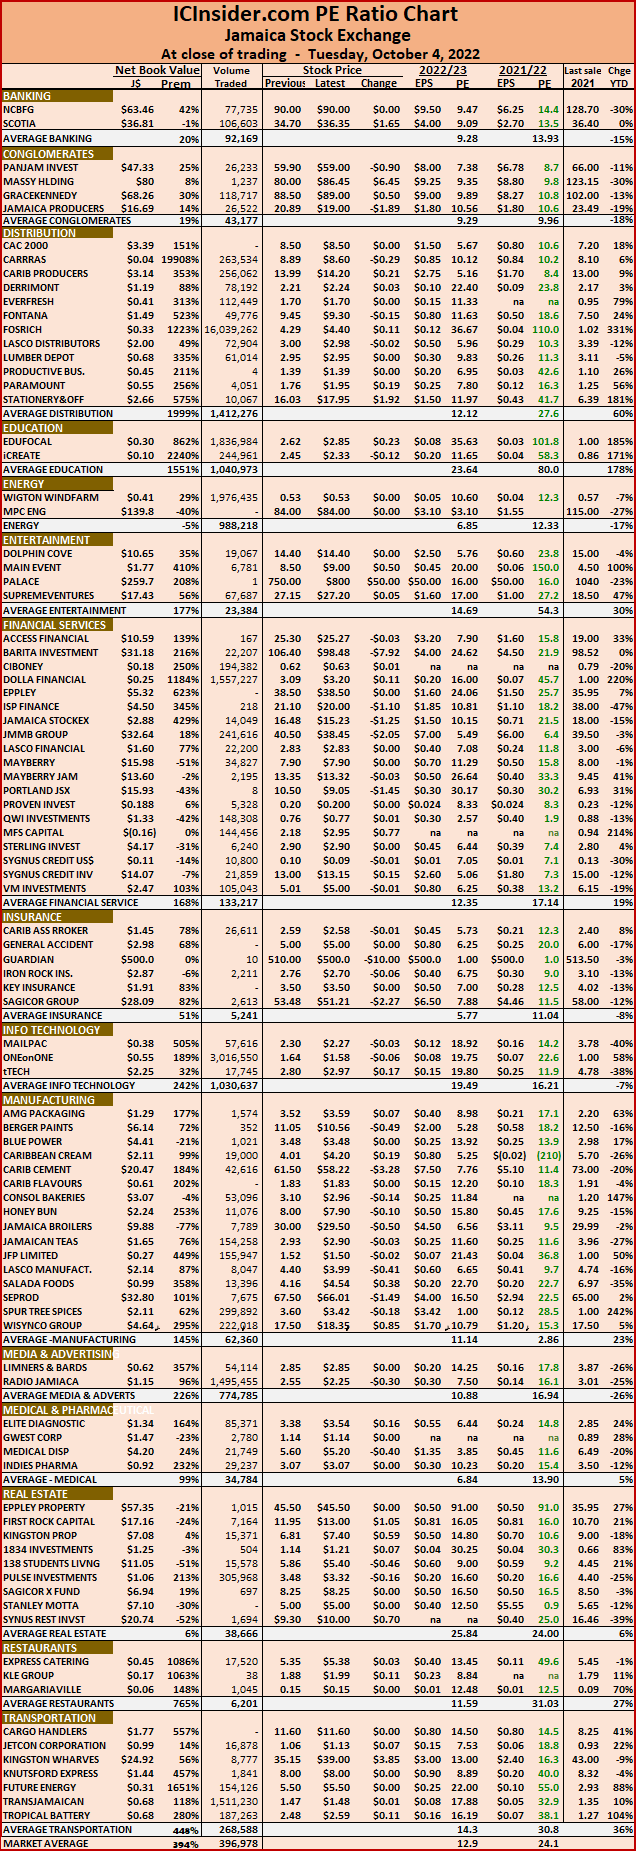
Trading ended, with 32,492,408 shares changing hands, valued at $150.7 million shares from $280.7 million, with 21,708,505 shares traded in all markets on the previous day. The JSE USD market ended with the value of stocks traded at US$16,860 from US$10,692 on Monday
The market’s PE ratio ended at 24.1 based on 2021-22 earnings and 12.9 times those for 2022-23 at the close of trading.
Investors need pertinent information to successfully navigate many investment options in the local stock market. The ICInsider.com PE ratio chart and the more detailed daily report charts provide investors with regularly updated information to help decision-making.
Investors should use the chart to help make rational investment decisions by investing in stocks close to the average for the sector and not going too far from it unless there are compelling reasons to do so. This approach helps to remove emotions from investment decisions and put in on fundamentals while at the same time not being too far from the majority of investors. Investors who buy when the price of a stock is close to the average will find that they are not inclined to overpay for a stock.
The ICInsider.com PE Ratio chart covers all ordinary shares on the Jamaica Stock Exchange. It shows companies grouped on an industry basis, allowing easy comparisons between the same sector companies and the overall market.
The net asset value of each company is reported as a guide to assess the value of stocks based on this measure quickly. The chart also shows daily changes in stock prices and the percentage year to date price movement based on the last traded prices. Dividends payable and yields for each company are shown in the Main and Junior Markets’ daily report charts that show the closing volume for the bids and offers.
The EPS & PE ratios are based on 2021 and 2022 actual or projected earnings, excluding major one off items. The PE Ratio is the most popular measure used to determine the value of stocks.

Trading dropped from Friday’s heady levels

Stocks started out October with the Markets in positive territory but failed to hang onto most of the early gains with the market slipping mildly at the close as trading on the Jamaica Stock Exchange fell back from Friday’s big volume.  
JSE Combined Index, a measure of the overall market, fell 1,125.60 points to end at 375,096.12, the All Jamaican Composite Index popped 189.12 points to close at 414,132.43, the JSE Main Index fell 989.99 points to 360,701.61, the Junior Market Index shed 22.14 points to 4,207.40 and the JSE USD market Index slipped 2.89 points to close 212.66.
Trading ended, with 21,708,505 shares changing hands, valued at $280.7 million shares down from $2.47 billion, with 236,220,291 shares traded in all markets on the previous day. The JSE USD market ended with the value of stocks traded at US$10,692 from US$51,064 on Friday.
The market’s PE ratio ended at 23.8 based on 2021-22 earnings and 12.8 times those for 2022-23 at the close of trading.
Investors need pertinent information to successfully navigate many investment options in the local stock market. The ICInsider.com PE ratio chart and the more detailed daily report charts provide investors with regularly updated information to help decision-making.
Investors should use the chart to help make rational investment decisions by investing in stocks close to the average for the sector and not going too far from it unless there are compelling reasons to do so. This approach helps to remove emotions from investment decisions and put in on fundamentals while at the same time not being too far from the majority of investors. Investors who buy when the price of a stock is close to the average will find that they are not inclined to overpay for a stock.
The ICInsider.com PE Ratio chart covers all ordinary shares on the Jamaica Stock Exchange. It shows companies grouped on an industry basis, allowing easy comparisons between the same sector companies and the overall market.
The net asset value of each company is reported as a guide to assess the value of stocks based on this measure quickly. The chart also shows daily changes in stock prices and the percentage year to date price movement based on the last traded prices. Dividends payable and yields for each company are shown in the Main and Junior Markets’ daily report charts that show the closing volume for the bids and offers.
The EPS & PE ratios are based on 2021 and 2022 actual or projected earnings, excluding major one off items. The PE Ratio is the most popular measure used to determine the value of stocks.


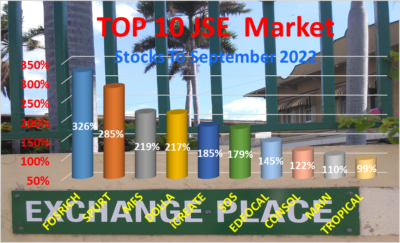
Junior Market delivered 2022 JSE best

The eleven best performing stocks on the Jamaica Stock Exchange for 2022 to the end of September, all came from the Junior Market with Fosrich, a company that expanded into manufacturing, put in an incredible run of 326 percent, the 2022 listed Spur Tree Spices was second with gains of 285 percent and Tropical Battery coming in at tenth position with gains of 99 percent.

Future Energy, distributors of gasoline, produced a rise of 96 percent to cap a spectacular two year run. 1834 Investments climbed 83 percent to be the best performing main market stock, after the company agreed to be acquired by Radio Jamaica, followed by Portland JSX, with 52 percent and Supreme Ventures the gaming company came next at 46 percent, in a period when the main market declined in value.