Jamaica Producers and PanJam Investment shares climbed higher on Monday following the disclosure that the two groups reached an agreement to merge their operations, with a likely conclusion in 2023. The stock prices of both companies rose on the Jamaica Stock Exchange, with Jamaica Producers gaining 22.9 percent to $22.50 from a close on Friday of $18.31 and Pan Jam Investment jumping just over 18 percent to $58 from the last traded price of $49 on Friday.
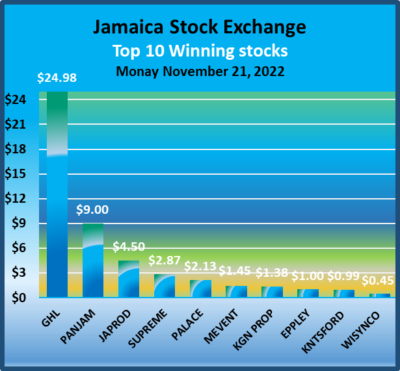 The gains in the above two companies pushed the Main Market higher, at the same time that investors pushed the Junior Market down for another day, but the JSE US dollar market rose modestly at the close.
At the end of trading the Combined Market Index rose 1,988.03 points to 350,382.05, the JSE Main Index popped 2,531.53 points in ending at 337,908.71, the Junior Market Index dropped 41.57 points to 3,830.39 while the All Jamaica Composite Index shed 1,041.52 points to 379,320.32 and the JSE US dollar market rallied 1.62 points to end at 228.89.
Trading ended, with 22,782,785shares changing hands, for $91.10 million, versus $116.96 million, with 18,045,996 shares traded in all markets on the previous day. The JSE USD market ended with the value of stocks traded amounting to US$60,270 from US$22,001 on Friday.
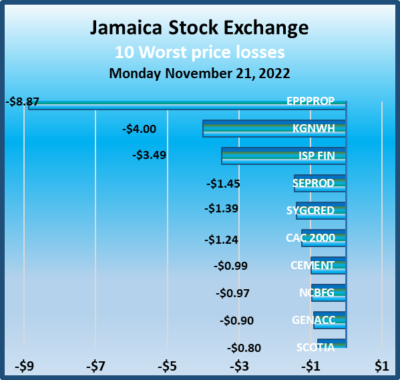 The market’s PE ratio ended at 22.6 based on 2021-22 earnings and 12.4 times those for 2022-23 at the close of trading.
Investors need pertinent information to successfully navigate many investment options in the local stock market. The ICInsider.com PE ratio chart and the more detailed daily report charts provide investors with regularly updated information to help decision-making.
Investors should use the chart to help make rational investment decisions by investing in stocks close to the average for the sector and not going too far from it unless there are compelling reasons to do so. This approach helps to remove emotions from investment decisions and put in on fundamentals while at the same time not being too far from the majority of investors. Investors who buy when the price of a stock is close to the average will find that they are not inclined to overpay for a stock.
The ICInsider.com PE Ratio chart covers all ordinary shares on the Jamaica Stock Exchange. It shows companies grouped on an industry basis, allowing easy comparisons between the same sector companies and the overall market.
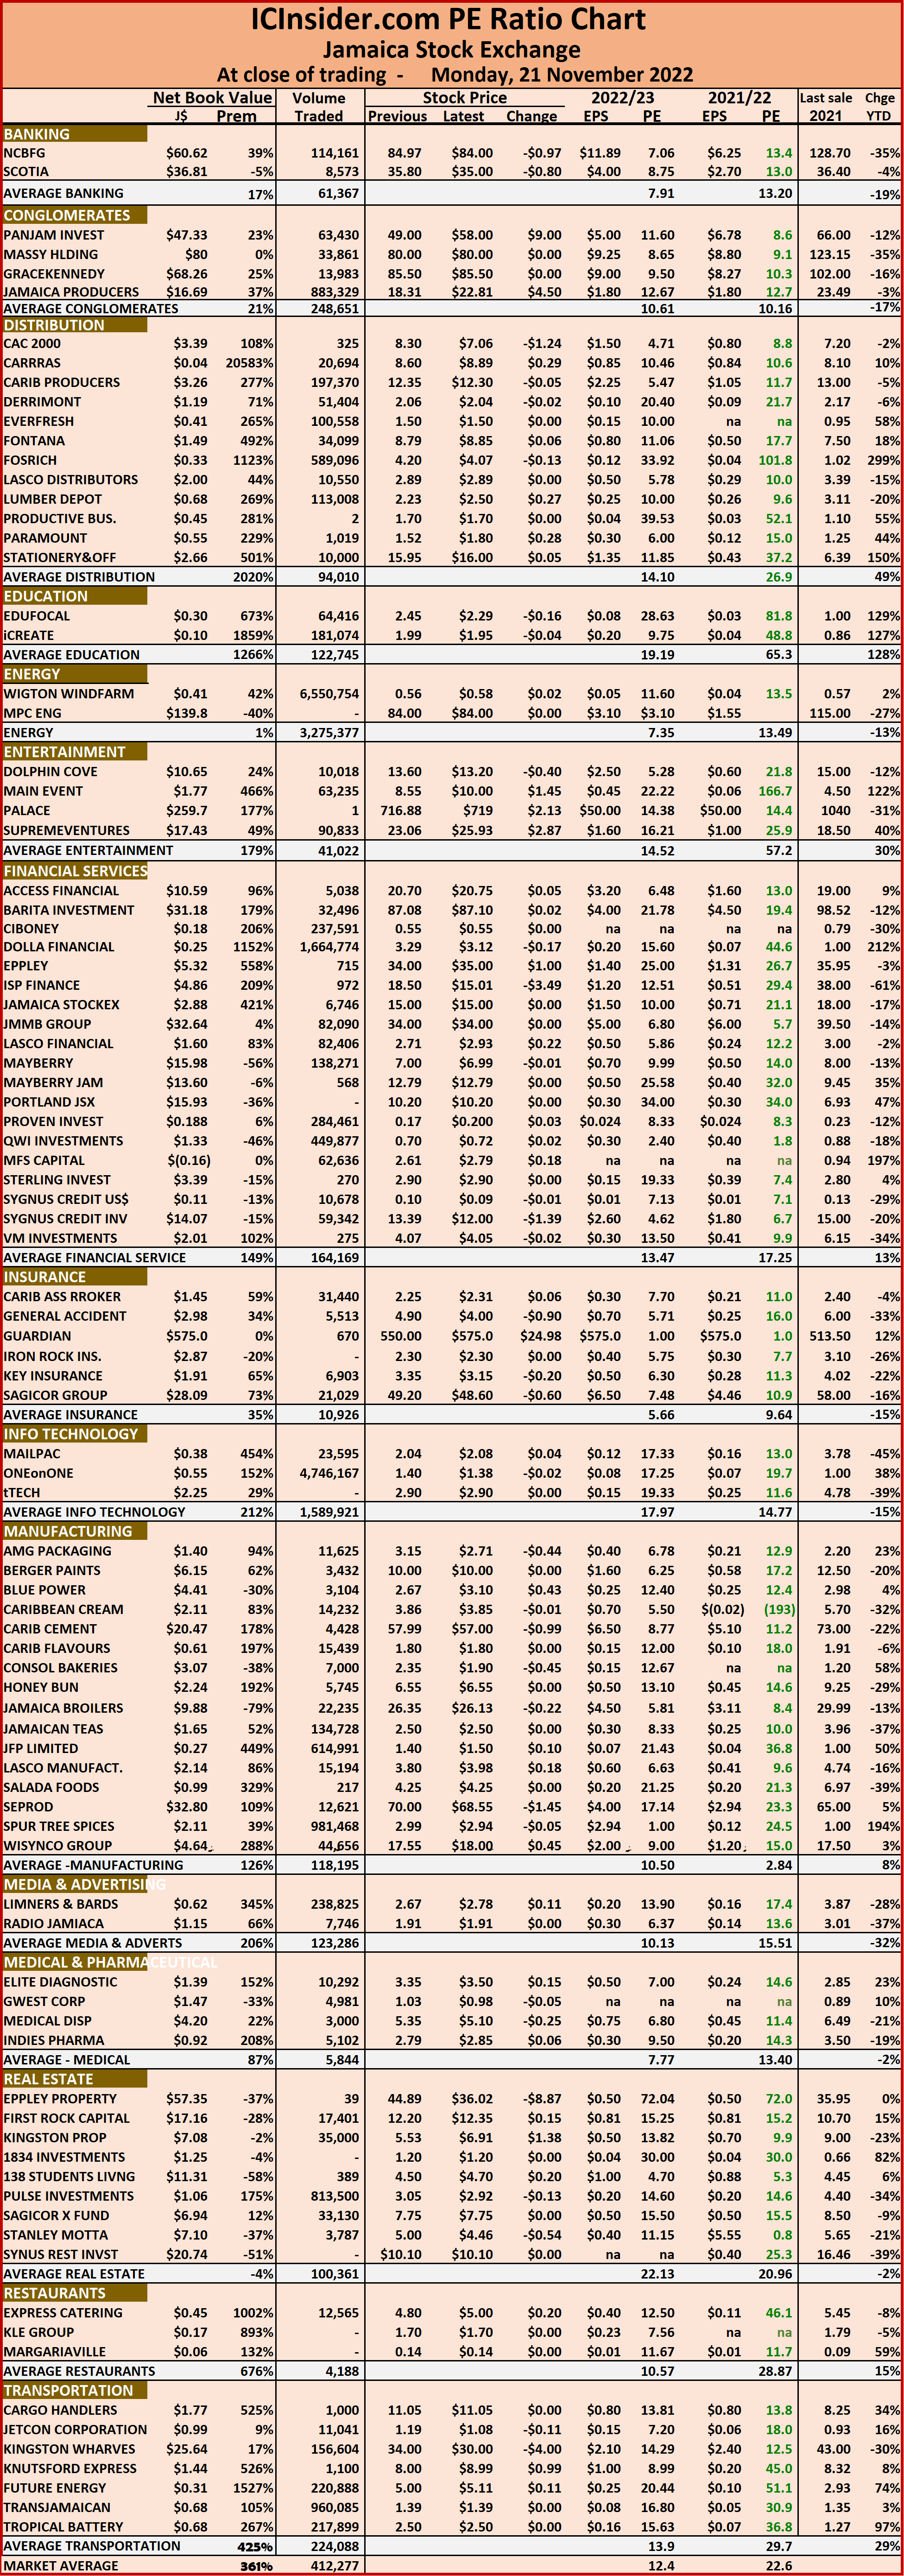 The net asset value of each company is reported as a guide to assess the value of stocks based on this measure quickly. The chart also shows daily changes in stock prices and the percentage year to date price movement based on the last traded prices. Dividends payable and yields for each company are shown in the Main and Junior Markets’ daily report charts that show the closing volume for the bids and offers.
The EPS & PE ratios are based on 2021 and 2022 actual or projected earnings, excluding major one off items. The PE Ratio is the most popular measure used to determine the value of stocks.
PanJam & JPG push Jamaica Stock Exchange
IPO jitters continue to hit Jamaican stocks
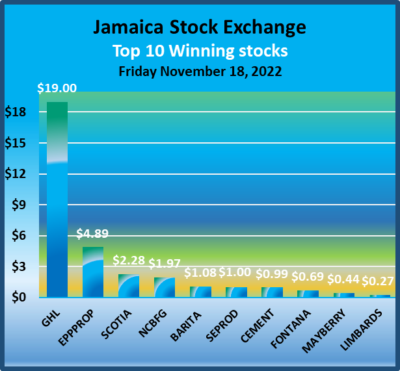
Investors put pressure on the prices of Jamaica Stock Exchange stocks on Friday as they seek funds to enter the latest IPO to hit the market, leading to an across the board decline in all three of the exchanges operated by the Jamaica Stock Exchange. The extent of the pullback shows up in the Combined Market index that is down 3,742.91 points in closing at 348,394.02.
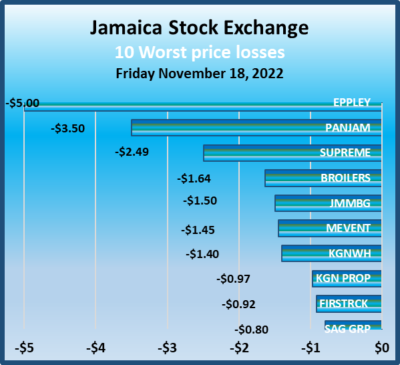 At the close, the JSE Main Index dropped 3,408.56 points in closing at 335,377.18, the Junior Market Index dropped 61.65 points to 3,871.96 while the All Jamaica Composite Index shed 2,975.20 points to 380,361.84 and the JSE US dollar market surged 29.58 points to end at 227.27.
Trading ended, with 18,045,996 shares changing hands, for $116.96 million, versus $261.96 million, with 46,225,825 shares traded in all markets on the previous day. The JSE USD market ended with the value of stocks traded amounting to US$22,001 from US$6,828 Thursday.
The market’s PE ratio ended at 22.3 based on 2021-22 earnings and 12.2 times those for 2022-23 at the close of trading.
Investors need pertinent information to successfully navigate many investment options in the local stock market. The ICInsider.com PE ratio chart and the more detailed daily report charts provide investors with regularly updated information to help decision-making.
 Investors should use the chart to help make rational investment decisions by investing in stocks close to the average for the sector and not going too far from it unless there are compelling reasons to do so. This approach helps to remove emotions from investment decisions and put in on fundamentals while at the same time not being too far from the majority of investors. Investors who buy when the price of a stock is close to the average will find that they are not inclined to overpay for a stock.
The ICInsider.com PE Ratio chart covers all ordinary shares on the Jamaica Stock Exchange. It shows companies grouped on an industry basis, allowing easy comparisons between the same sector companies and the overall market.
The net asset value of each company is reported as a guide to assess the value of stocks based on this measure quickly. 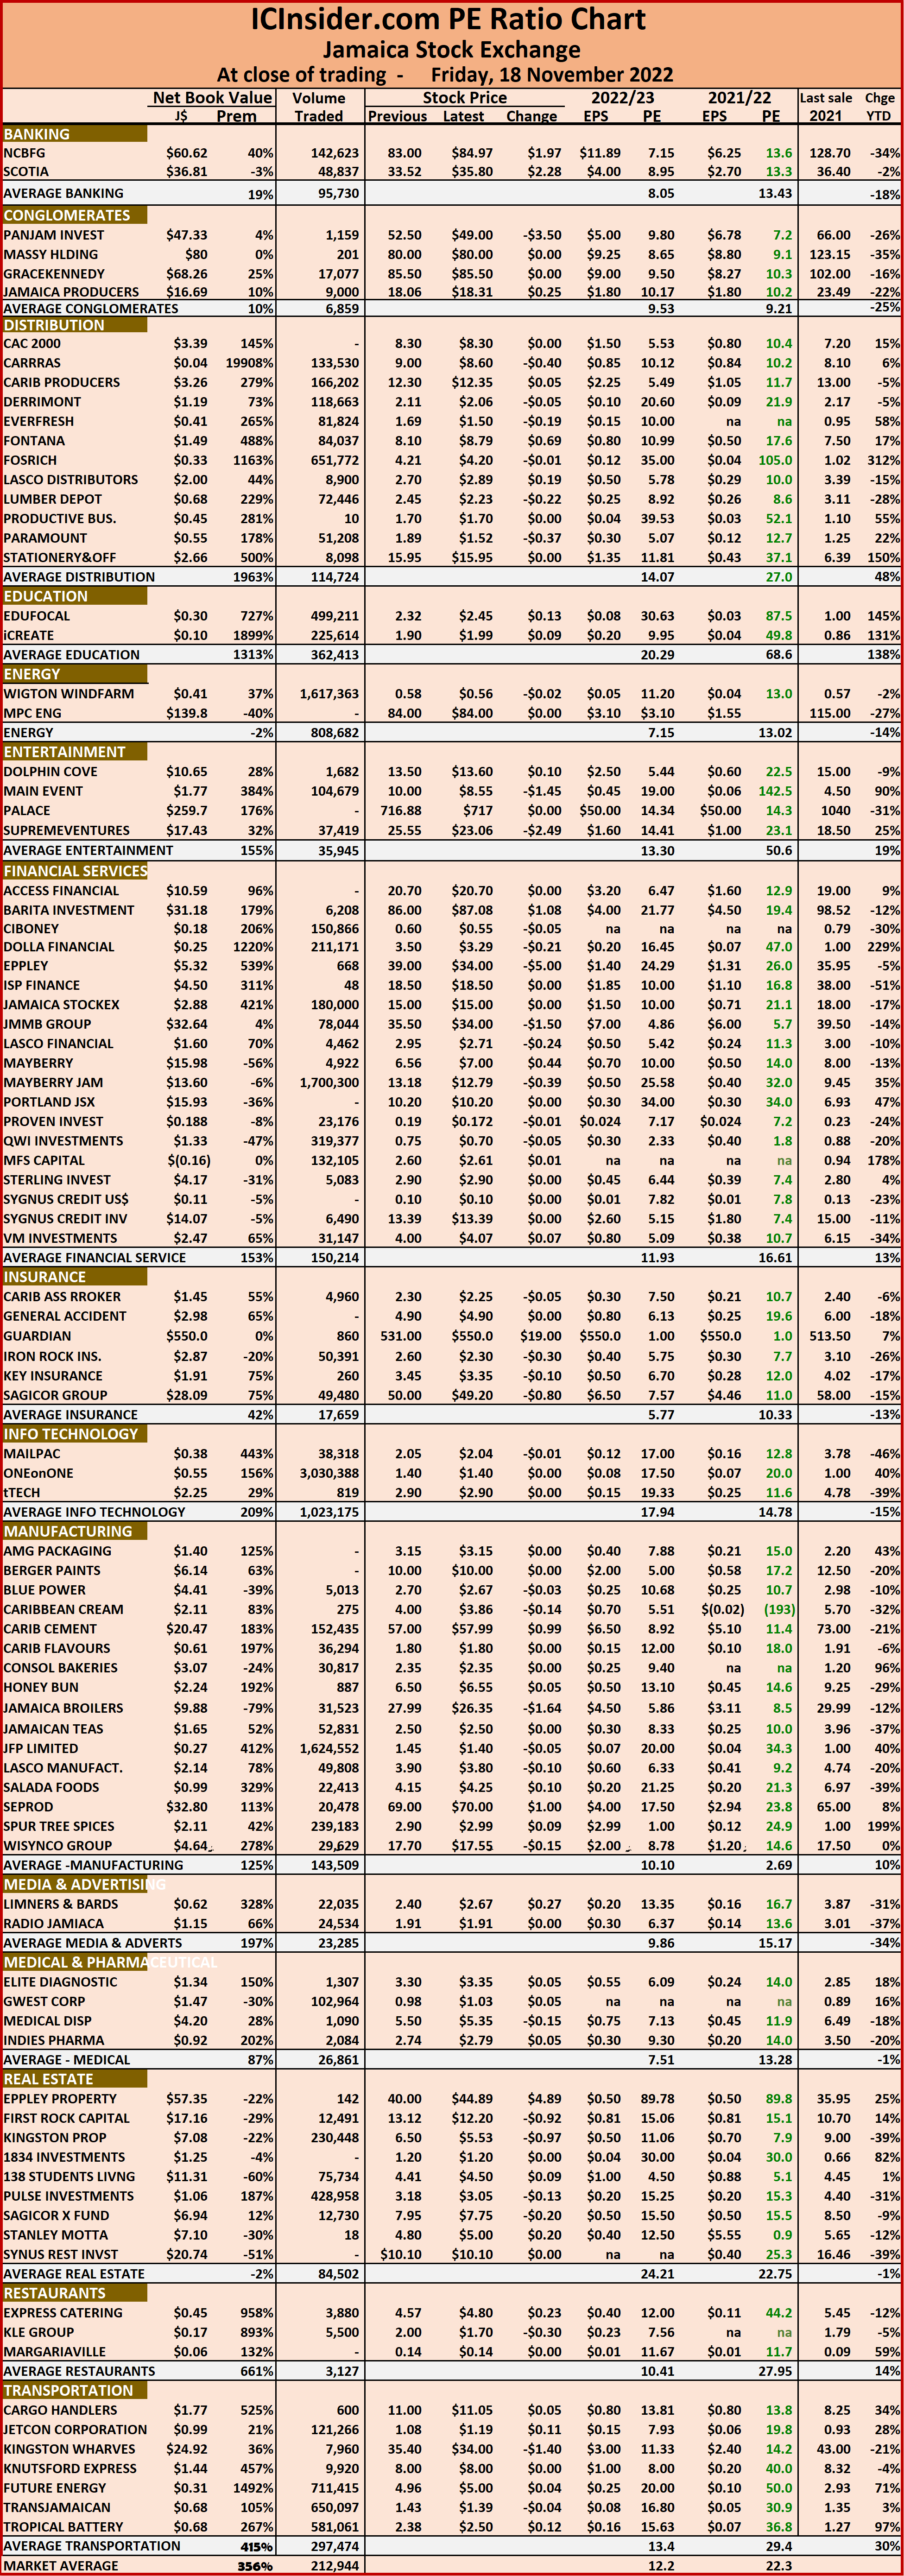 The chart also shows daily changes in stock prices and the percentage year to date price movement based on the last traded prices. Dividends payable and yields for each company are shown in the Main and Junior Markets’ daily report charts that show the closing volume for the bids and offers.
The EPS & PE ratios are based on 2021 and 2022 actual or projected earnings, excluding major one off items. The PE Ratio is the most popular measure used to determine the value of stocks.
JSE Main Market rose on Wednesday
The Jamaica Stock Exchange Main Market enjoyed a modest bounce on Wednesday but the Junior Market and the JSE USD Market slipped at the close, the slippage was inadequate to prevent the Combined Market indices from closing 1,181.10 points higher at 357,060.31.
 At the end of trading, the JSE Main Index rose 1,525.74 points to 343,681.10, the Junior Market Index dropped 26.95 points to 3,972.26, while the All Jamaica Composite Index shed 453.12 points to 389,396.40 and the JSE US dollar market dipped 2.60 points to end at 242.80.
Trading ended, with 31,805,998 shares changing hands, for $124.6 million, versus $145.33 million, with 21,069,831 shares traded in all markets on the previous day. The JSE USD market ended with the value of stocks traded amounting to US$1,384 from US$65,957 on Tuesday.
The market’s PE ratio ended at 23.8. Based on 2021-22 earnings and 12.6 times those for 2022-23 at the close of trading.
Investors need pertinent information to successfully navigate many investment options in the local stock market. The ICInsider.com PE ratio chart and the more detailed daily report charts provide investors with regularly updated information to help decision-making.

Palace actually declined $75.12.
Investors should use the chart to help make rational investment decisions by investing in stocks close to the average for the sector and not going too far from it unless there are compelling reasons to do so. This approach helps to remove emotions from investment decisions and put in on fundamentals while at the same time not being too far from the majority of investors. Investors who buy when the price of a stock is close to the average will find that they are not inclined to overpay for a stock.
The ICInsider.com PE Ratio chart covers all ordinary shares on the Jamaica Stock Exchange. It shows companies grouped on an industry basis, allowing easy comparisons between the same sector companies and the overall market.
The net asset value of each company is reported as a guide to assess the value of stocks based on this measure quickly.  The chart also shows daily changes in stock prices and the percentage year to date price movement based on the last traded prices. Dividends payable and yields for each company are shown in the Main and Junior Markets’ daily report charts that show the closing volume for the bids and offers.
The EPS & PE ratios are based on 2021 and 2022 actual or projected earnings, excluding major one off items. The PE Ratio is the most popular measure used to determine the value of stocks.
JSE Main market falls others rise
The Jamaica Stock Exchange Main market declined on Tuesday but the Junior Market and the JSE USD Market popped higher modestly at the close and helped in supporting the Combined Market indices that only declined 307.58 points to 355,879.31.
 At the close of the market, the JSE Main Index dipped 570.04 points to 342,155.36, the Junior Market Index popped 24.82 points to close at 3,999.21 points while the All Jamaica Composite Index fell 629.97 points to 389,849.52 and the JSE US dollar market put on 1.32 points to end at 245.40.
Trading ended, with 21,069,831 shares changing hands, for $145.33 million, versus $116.16 million, with 20,808,065 shares traded in all markets on the previous day. The JSE USD market ended with the value of stocks traded amounting to US$65,957 from US$23,622 on Monday.
The market’s PE ratio ended at 23.7. Based on 2021-22 earnings and 12.6 times those for 2022-23 at the close of trading.
Investors need pertinent information to successfully navigate many investment options in the local stock market. The ICInsider.com PE ratio chart and the more detailed daily report charts provide investors with regularly updated information to help decision-making.
 Investors should use the chart to help make rational investment decisions by investing in stocks close to the average for the sector and not going too far from it unless there are compelling reasons to do so. This approach helps to remove emotions from investment decisions and put in on fundamentals while at the same time not being too far from the majority of investors. Investors who buy when the price of a stock is close to the average will find that they are not inclined to overpay for a stock.
The ICInsider.com PE Ratio chart covers all ordinary shares on the Jamaica Stock Exchange. It shows companies grouped on an industry basis, allowing easy comparisons between the same sector companies and the overall market.
The net asset value of each company is reported as a guide to assess the value of stocks based on this measure quickly.  The chart also shows daily changes in stock prices and the percentage year to date price movement based on the last traded prices. Dividends payable and yields for each company are shown in the Main and Junior Markets’ daily report charts that show the closing volume for the bids and offers.
The EPS & PE ratios are based on 2021 and 2022 actual or projected earnings, excluding major one off items. The PE Ratio is the most popular measure used to determine the value of stocks.
Fall for all JSE markets
All markets of the Jamaica Stock Exchange declined on Monday and ended with the Junior Market suffering a big decline and helping to lead the Combined Market indices into falling 1,300 points to 356,186.89.
 At the close of the market, the JSE Main Index slipped 1,347.77 points to 342,725.40, the Junior Market Index dropped 60.44 points to close at 3,974.39 points while the All Jamaica Composite Index fell 1,886.79 points to 390,479.49 and the JSE US dollar market slipped 3.43 points to end at 244.08.
Trading ended, with 20,808,065 shares changing hands, for $116.16 million, versus $173.17 million, with 32,031,909 shares traded in all markets on the previous day. The JSE USD market ended with the value of stocks traded amounting to US$23,622 from US$17,809 on Friday.
The market’s PE ratio ended at 23.3. Based on 2021-22 earnings and 12.6 times those for 2022-23 at the close of trading.
Investors need pertinent information to successfully navigate many investment options in the local stock market. The ICInsider.com PE ratio chart and the more detailed daily report charts provide investors with regularly updated information to help decision-making.
 Investors should use the chart to help make rational investment decisions by investing in stocks close to the average for the sector and not going too far from it unless there are compelling reasons to do so. This approach helps to remove emotions from investment decisions and put in on fundamentals while at the same time not being too far from the majority of investors. Investors who buy when the price of a stock is close to the average will find that they are not inclined to overpay for a stock.
The ICInsider.com PE Ratio chart covers all ordinary shares on the Jamaica Stock Exchange. It shows companies grouped on an industry basis, allowing easy comparisons between the same sector companies and the overall market.
The net asset value of each company is reported as a guide to assess the value of stocks based on this measure quickly.  The chart also shows daily changes in stock prices and the percentage year to date price movement based on the last traded prices. Dividends payable and yields for each company are shown in the Main and Junior Markets’ daily report charts that show the closing volume for the bids and offers.
The EPS & PE ratios are based on 2021 and 2022 actual or projected earnings, excluding major one off items. The PE Ratio is the most popular measure used to determine the value of stocks.
PBS pushes JSE USD markets flying
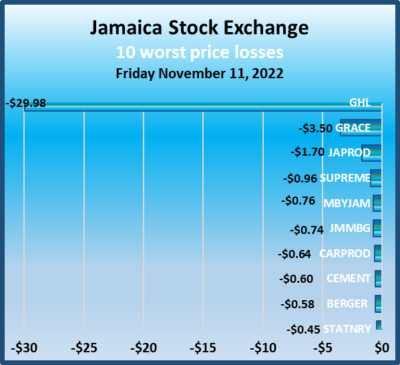
Productive Business Solutions (PBS) stock jumped 45 percent to a record US$2 on Friday from a close of US$1.38 on Thursday and resulted in an 18.5 percent surge in the market index to 247.51 points. The JSE Main Market ended with mixed results with mild slippage in the All Jamaica Composite and the Combined Market indices as the Junior Market suffered another decline as trading picked up on Thursday’s outturn.
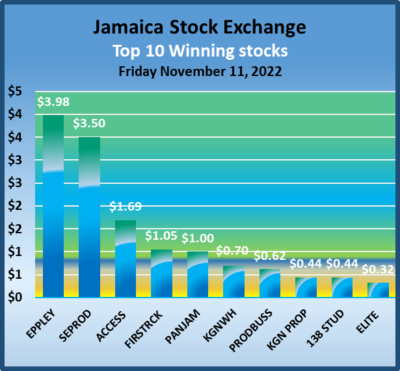 At the close of the market, the JSE Combined Market Index fell 70.38 points to 357,993.78, the JSE Main Index popped 156.36 points to 344,073.17, the Junior Market Index dropped 23.88 points to close at 4,034.83 points while the All Jamaica Composite Index fell 282.96 points to 392,366.28 and the JSE US dollar market jumped 38.74 points to end at 247.51.
Trading ended, with 32,031,909 shares changing hands, for a mere $173.17 million, versus $113.18 million, with 19,817,542 shares traded in all markets on the previous day. The JSE USD market ended with the value of stocks traded amounting to US$17,809 from US$16,127 on Thursday.
The market’s PE ratio ended at 23.8 based on 2021-22 earnings and 12.6 times those for 2022-23 at the close of trading.
Investors need pertinent information to successfully navigate many investment options in the local stock market. The ICInsider.com PE ratio chart and the more detailed daily report charts provide investors with regularly updated information to help decision-making.
 Investors should use the chart to help make rational investment decisions by investing in stocks close to the average for the sector and not going too far from it unless there are compelling reasons to do so. This approach helps to remove emotions from investment decisions and put in on fundamentals while at the same time not being too far from the majority of investors. Investors who buy when the price of a stock is close to the average will find that they are not inclined to overpay for a stock.
The ICInsider.com PE Ratio chart covers all ordinary shares on the Jamaica Stock Exchange. It shows companies grouped on an industry basis, allowing easy comparisons between the same sector companies and the overall market.
The net asset value of each company is reported as a guide to assess the value of stocks based on this measure quickly. 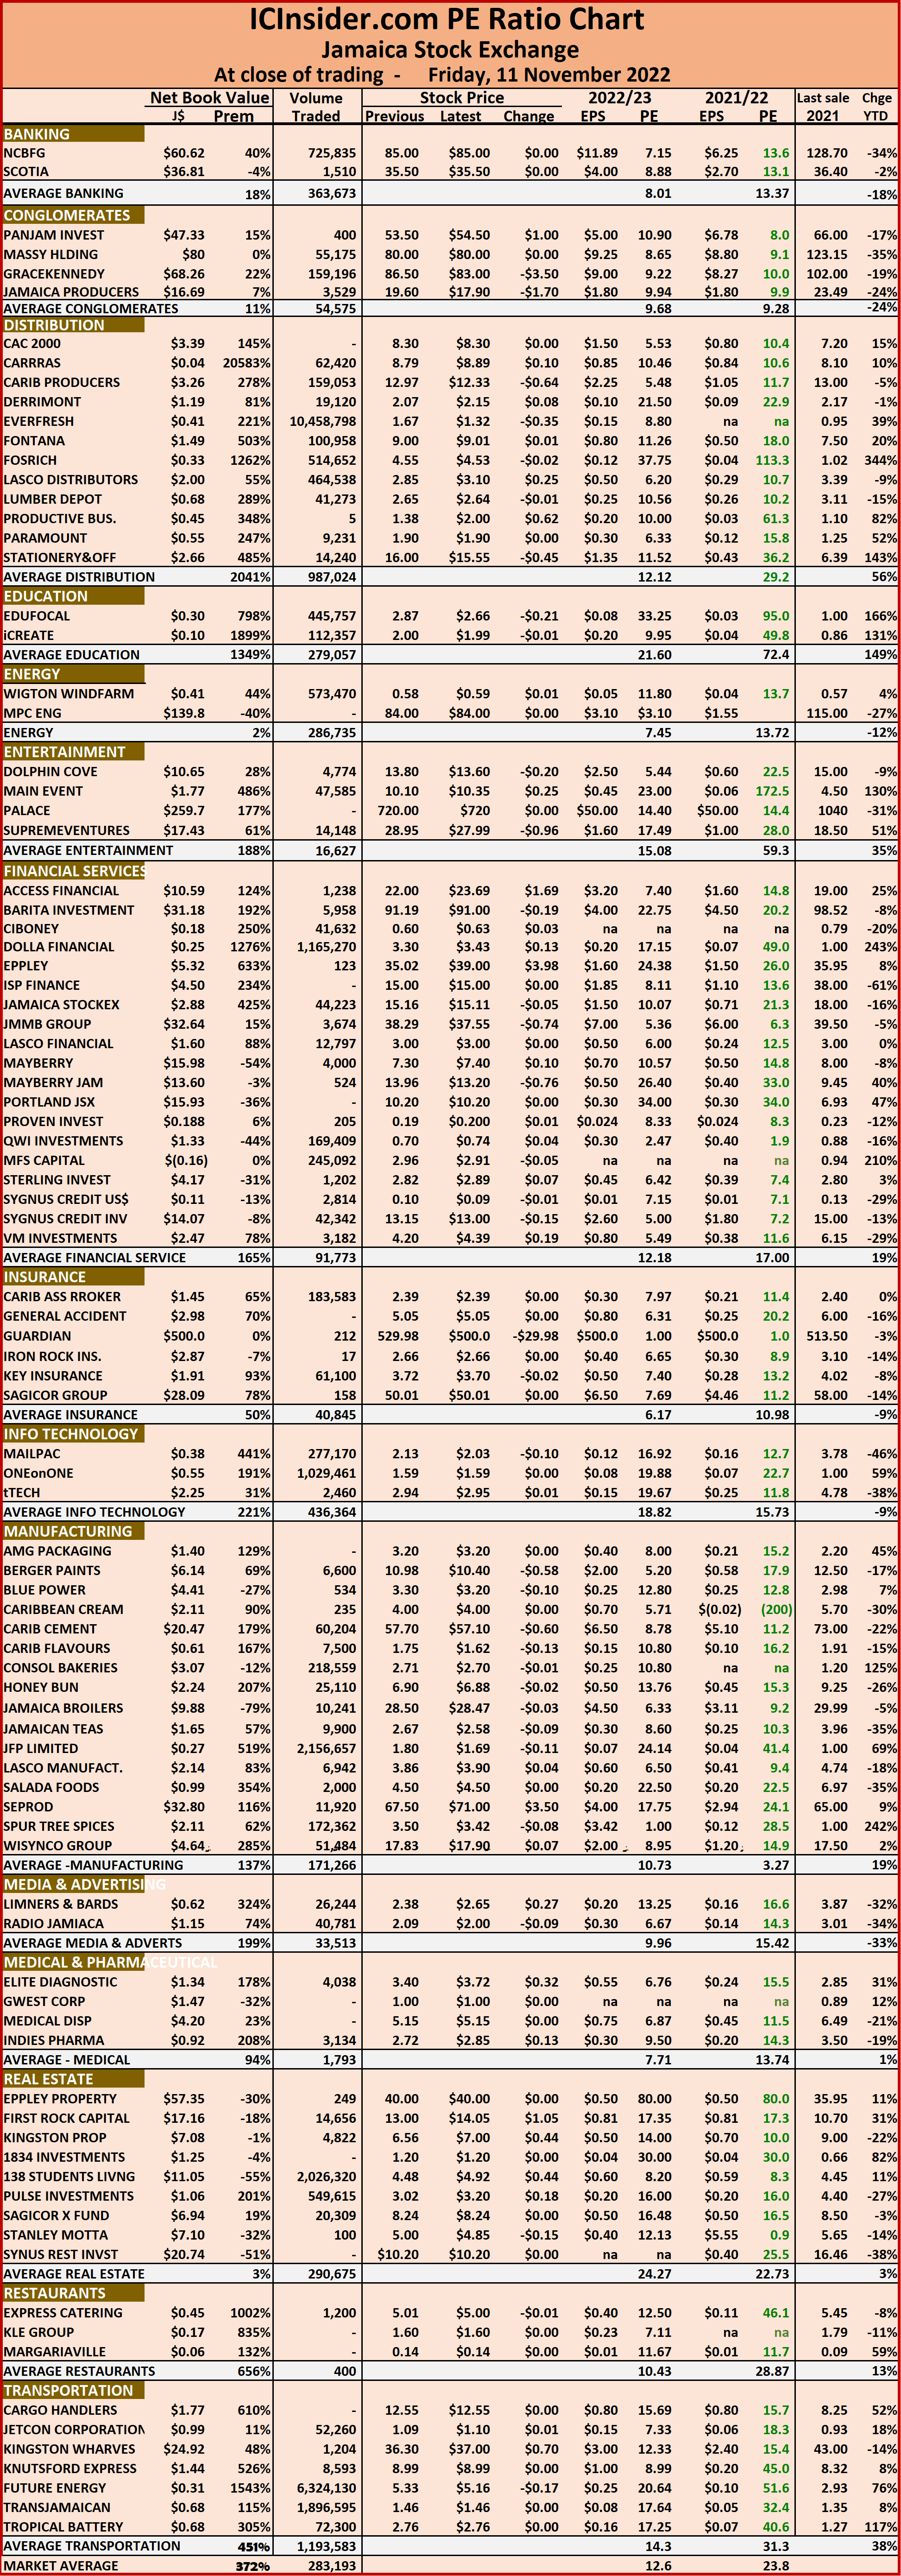 The chart also shows daily changes in stock prices and the percentage year to date price movement based on the last traded prices. Dividends payable and yields for each company are shown in the Main and Junior Markets’ daily report charts that show the closing volume for the bids and offers.
The EPS & PE ratios are based on 2021 and 2022 actual or projected earnings, excluding major one off items. The PE Ratio is the most popular measure used to determine the value of stocks.
JSE markets rise with subdued trades
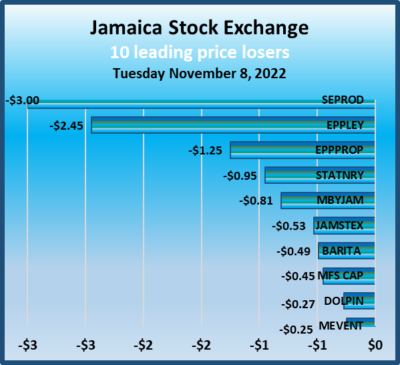
The JSE US dollar market slipped on Wednesday but the Junior Market and the Main Market rose moderately on Wednesday, leading the JSE Combined Market Index rising 1,947.50 points to close at 362,021.32 after trading levels vastly fewer shares than on Tuesday.
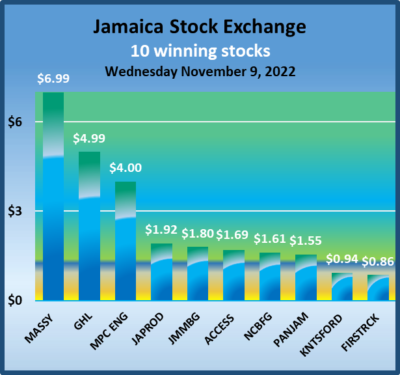 The JSE Main Index fell 1,996.92 points to 347,690.00, the Junior Market Index popped 9.05 points to close at 4,106.41 points while the All Jamaica Composite Index rose 1,893.91 points to 394,931.18 and the JSE US dollar market lost 4.13 points to end at 205.27.
Trading ended, with only 10,130,062 shares changing hands, for a mere $35.44 million, versus $152.3 million, with 26,137,175 shares traded in all markets on the previous day. The JSE USD market ended with the value of stocks traded amounting to US$18,378 from US$5,593 on Tuesday.
The market’s PE ratio ended at 23.9 based on 2021-22 earnings and 12.7 times those for 2022-23 at the close of trading.
Investors need pertinent information to successfully navigate many investment options in the local stock market. The ICInsider.com PE ratio chart and the more detailed daily report charts provide investors with regularly updated information to help decision-making.
 Investors should use the chart to help make rational investment decisions by investing in stocks close to the average for the sector and not going too far from it unless there are compelling reasons to do so. This approach helps to remove emotions from investment decisions and put in on fundamentals while at the same time not being too far from the majority of investors. Investors who buy when the price of a stock is close to the average will find that they are not inclined to overpay for a stock.
The ICInsider.com PE Ratio chart covers all ordinary shares on the Jamaica Stock Exchange. It shows companies grouped on an industry basis, allowing easy comparisons between the same sector companies and the overall market.
The net asset value of each company is reported as a guide to assess the value of stocks based on this measure quickly. 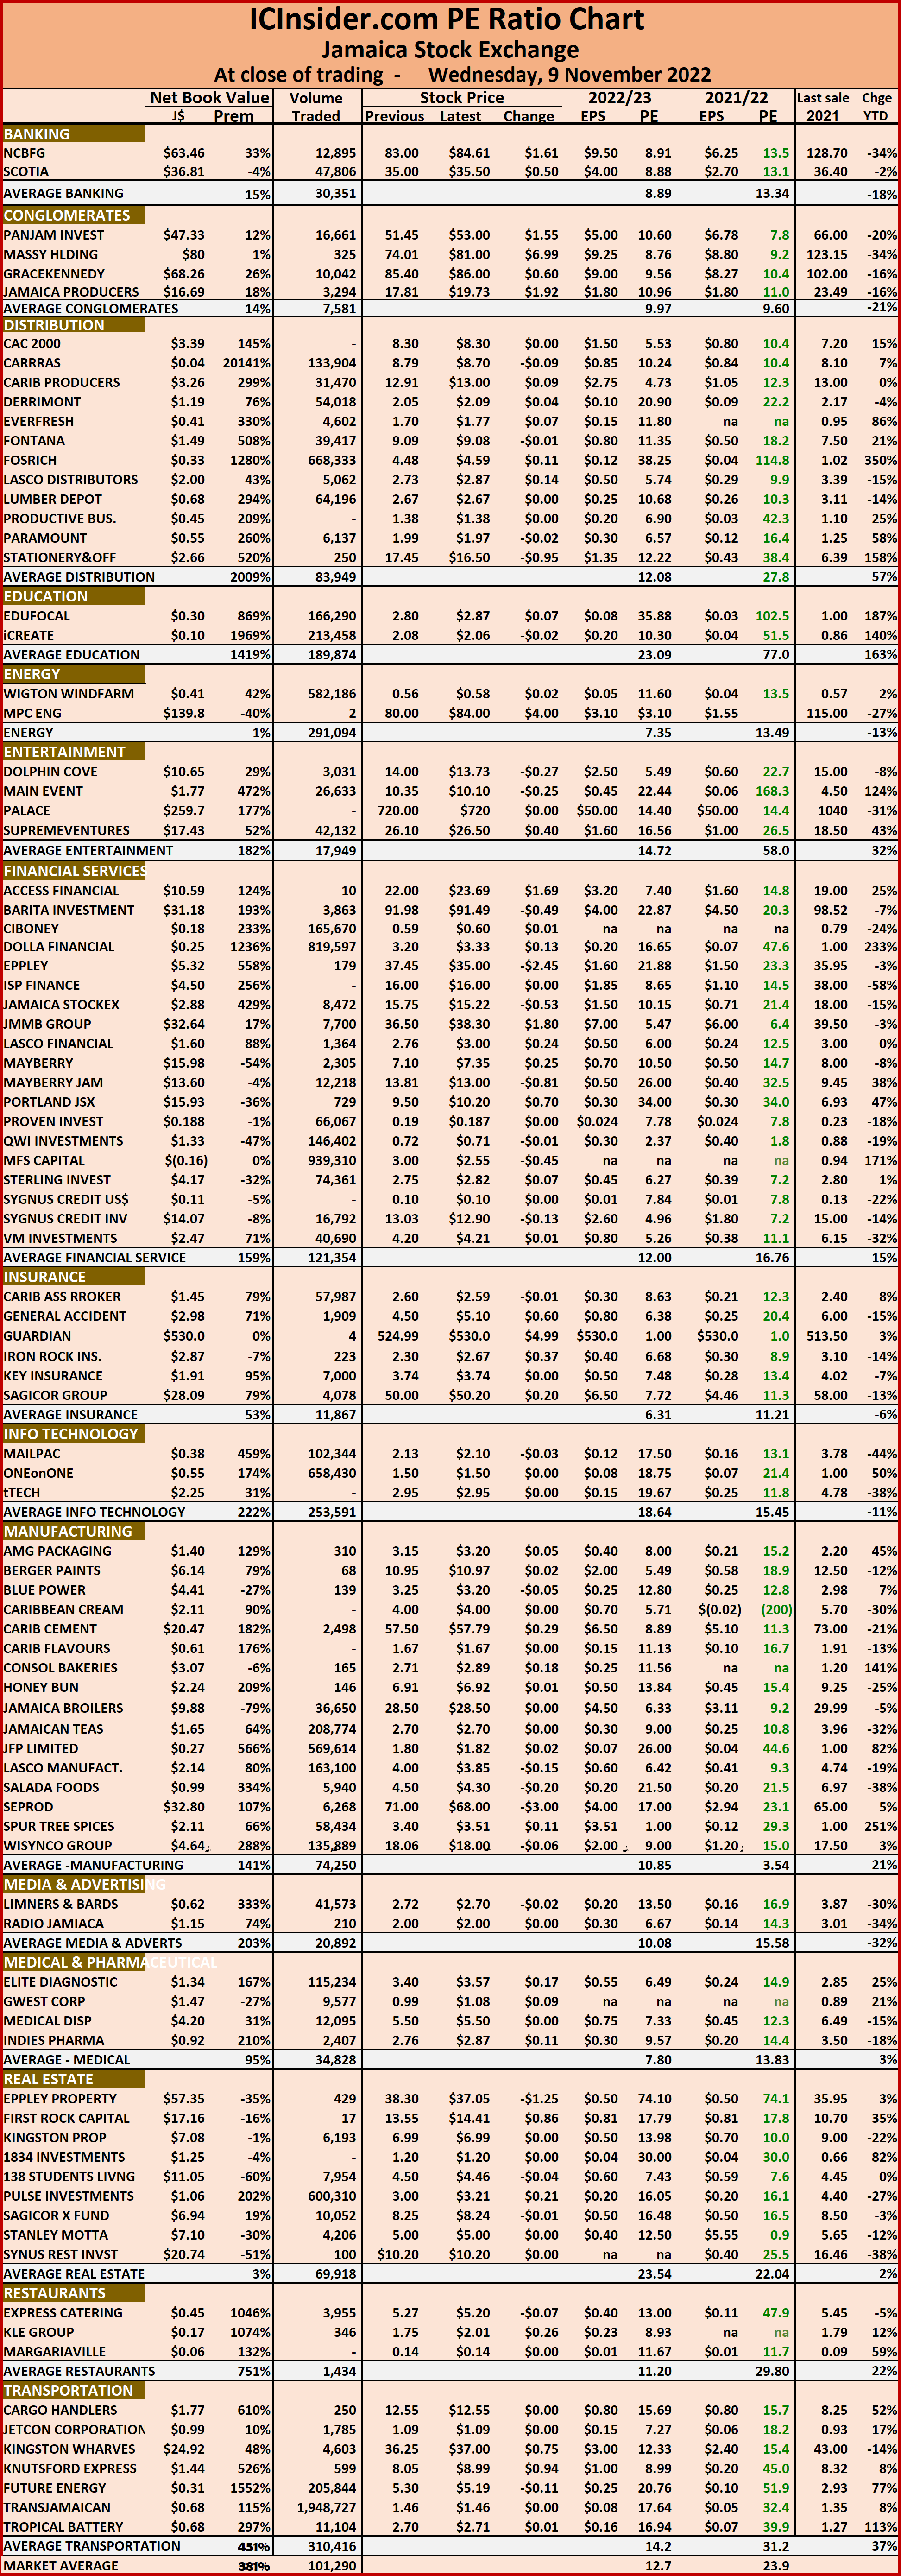 The chart also shows daily changes in stock prices and the percentage year to date price movement based on the last traded prices. Dividends payable and yields for each company are shown in the Main and Junior Markets’ daily report charts that show the closing volume for the bids and offers.
The EPS & PE ratios are based on 2021 and 2022 actual or projected earnings, excluding major one off items. The PE Ratio is the most popular measure used to determine the value of stocks.
Falling stocks hit JSE Main Market
Junior Market rose moderately on Tuesday, following gains on Monday but the Main Market suffered further by adding to Monday’s losses, leading the JSE Combined Market Index to fall 1,214.75 points to close at 360,073.82, with trading picking up over Monday’s outcome.
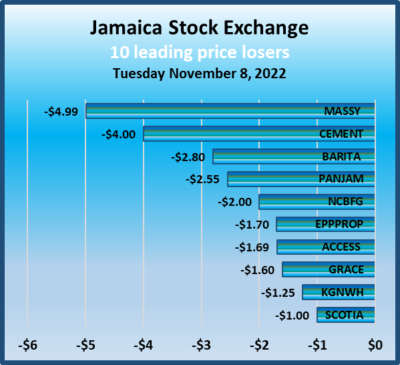
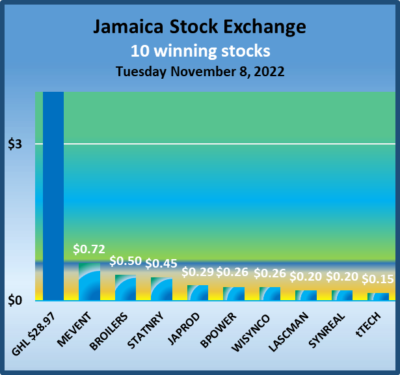 Guardian Holdings jumped $28.97 but was unable to hold off big losses in a series of stocks in the Main Market with nine falling by a dollar or more. The JSE Main Index fell 1,329.63 points to 345,693.08, the Junior Market Index popped 3.02 points to close at 4,097.36 points while the All Jamaica Composite Index lost 3,612.99 points to end at 393,037.27 and the JSE US dollar market lost 1.32 points to end at 209.40.
Trading ended, with 26,137,175 shares changing hands, for $152.3 million, versus $91.7 million, with 23,971,628 shares traded in all markets on the previous day. The JSE USD market ended with the value of stocks traded amounting to US$5,593 from US$29,031 on Monday.
The market’s PE ratio ended at 23.7 based on 2021-22 earnings and 12.6 times those for 2022-23 at the close of trading.
 Investors need pertinent information to successfully navigate many investment options in the local stock market. The ICInsider.com PE ratio chart and the more detailed daily report charts provide investors with regularly updated information to help decision-making.
Investors should use the chart to help make rational investment decisions by investing in stocks close to the average for the sector and not going too far from it unless there are compelling reasons to do so. This approach helps to remove emotions from investment decisions and put in on fundamentals while at the same time not being too far from the majority of investors. Investors who buy when the price of a stock is close to the average will find that they are not inclined to overpay for a stock.
The ICInsider.com PE Ratio chart covers all ordinary shares on the Jamaica Stock Exchange. It shows companies grouped on an industry basis, allowing easy comparisons between the same sector companies and the overall market.
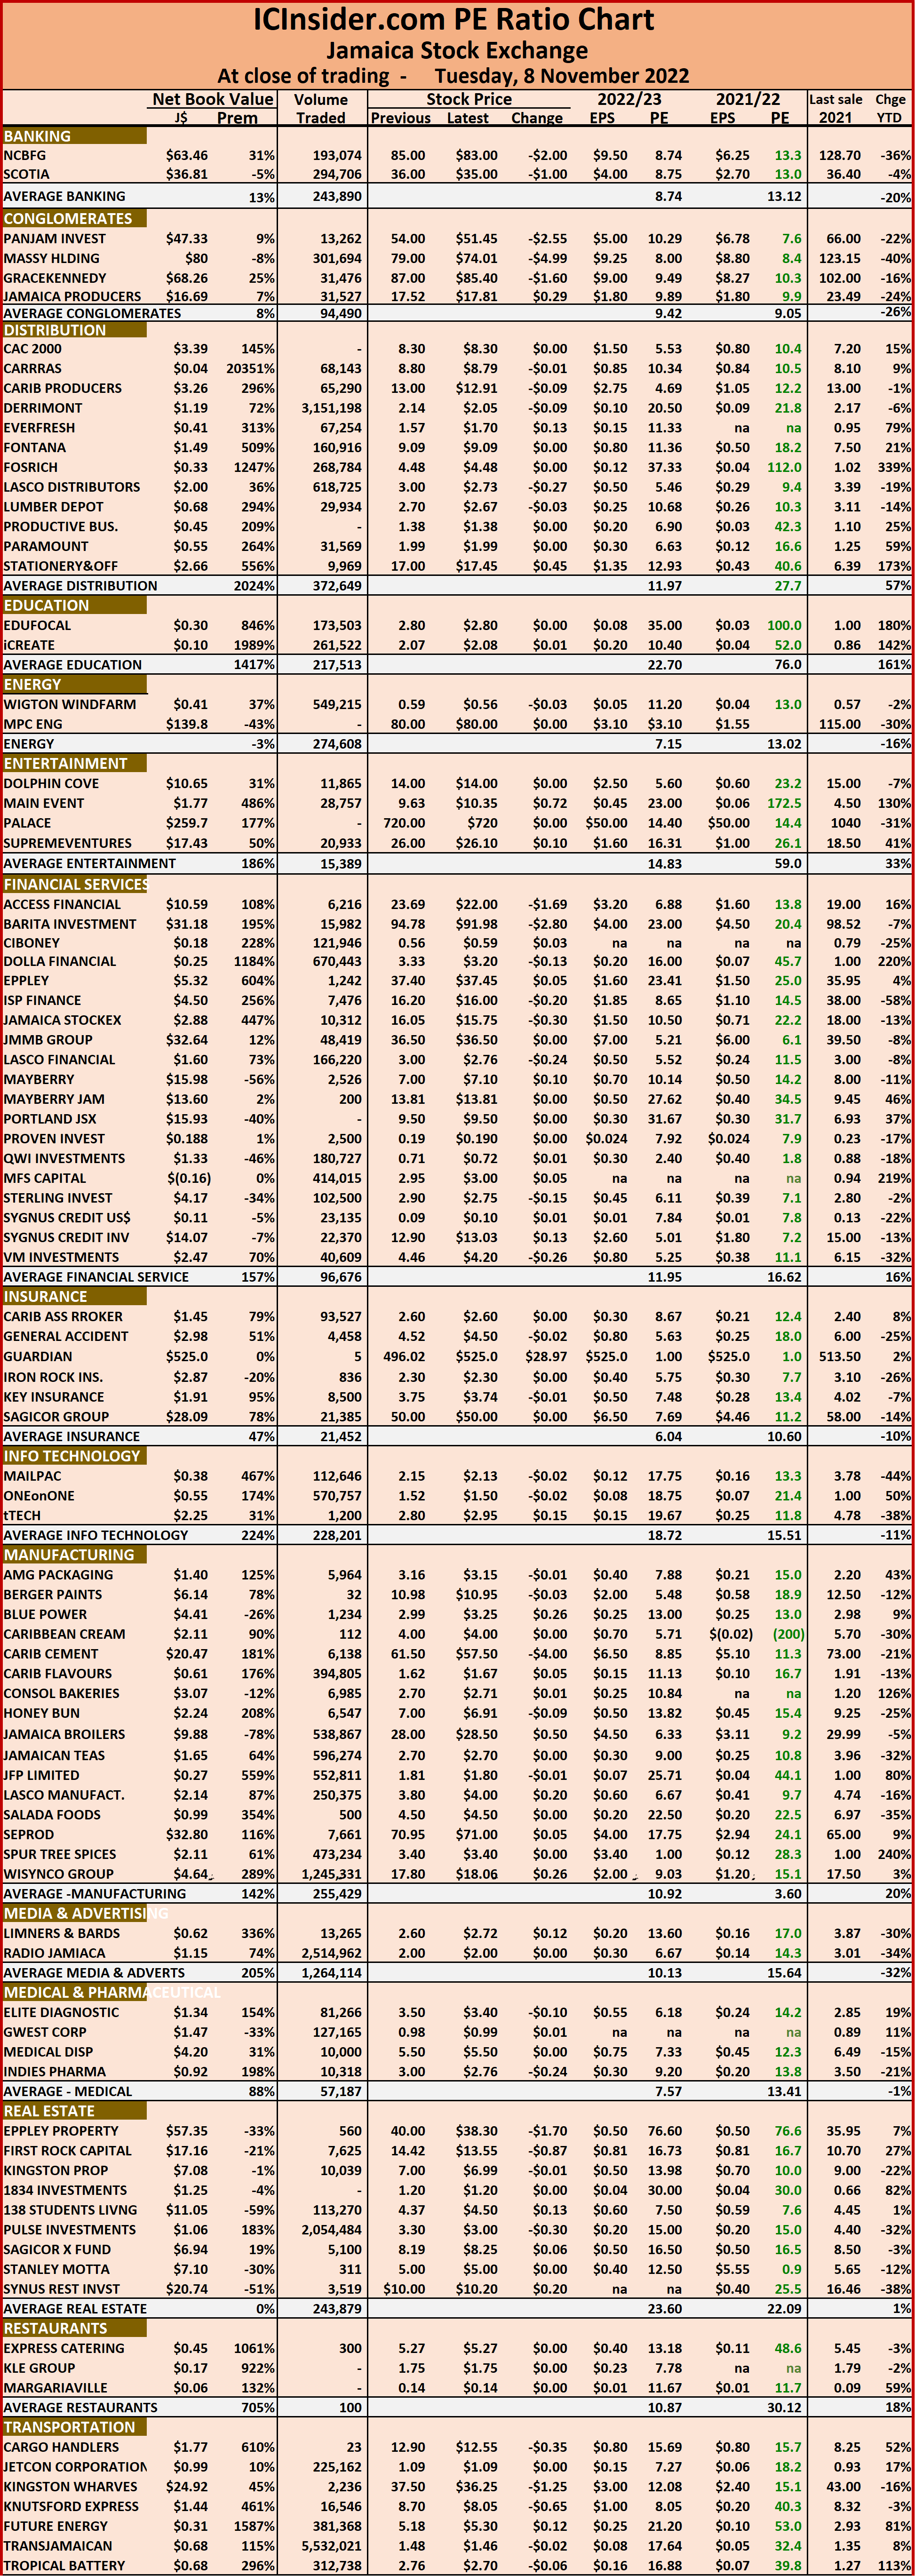 The net asset value of each company is reported as a guide to assess the value of stocks based on this measure quickly. The chart also shows daily changes in stock prices and the percentage year to date price movement based on the last traded prices. Dividends payable and yields for each company are shown in the Main and Junior Markets’ daily report charts that show the closing volume for the bids and offers.
The EPS & PE ratios are based on 2021 and 2022 actual or projected earnings, excluding major one off items. The PE Ratio is the most popular measure used to determine the value of stocks.
JSE Main Market falls Juniors rise
The Main and US dollar markets of the Jamaica Stock Exchange dropped Monday, but the Junior Market popped modestly higher and the trading ended with the JSE Combined Market Index falling 1,798.84 points to close at 361,288.57 after Guardian Holding gave back Friday’s gains of $22.98.
 The JSE Main Index fell 2,127.45 points to 347,022.71, the Junior Market Index rallied 20.80 points to close at 4,094.34 points while the All Jamaica Composite Index lost 1,302.79 points to 396,650.26 and the JSE US dollar market lost 3.24 points to end at 210.72.
Trading ended, with 23,971,628 shares changing hands, for $91.7 million, versus $116.96 million, with 38,896,157 shares traded in all markets on the previous day. The JSE USD market ended with the value of stocks traded amounting to US$29,031 from US$57,624 on Friday.
The market’s PE ratio ended at 23.7 based on 2021-22 earnings and 12.6 times those for 2022-23 at the close of trading. Investors need pertinent information to successfully navigate many investment options in the local stock market. The ICInsider.com PE ratio chart and the more detailed daily report charts provide investors with regularly updated information to help decision-making.
Investors should use the chart to help make rational investment decisions by investing in stocks close to the average for the sector and not going too far from it unless there are compelling reasons to do so. This approach helps to remove emotions from investment decisions and put in on fundamentals while at the same time not being too far from the majority of investors. Investors who buy when the price of a stock is close to the average will find that they are not inclined to overpay for a stock.
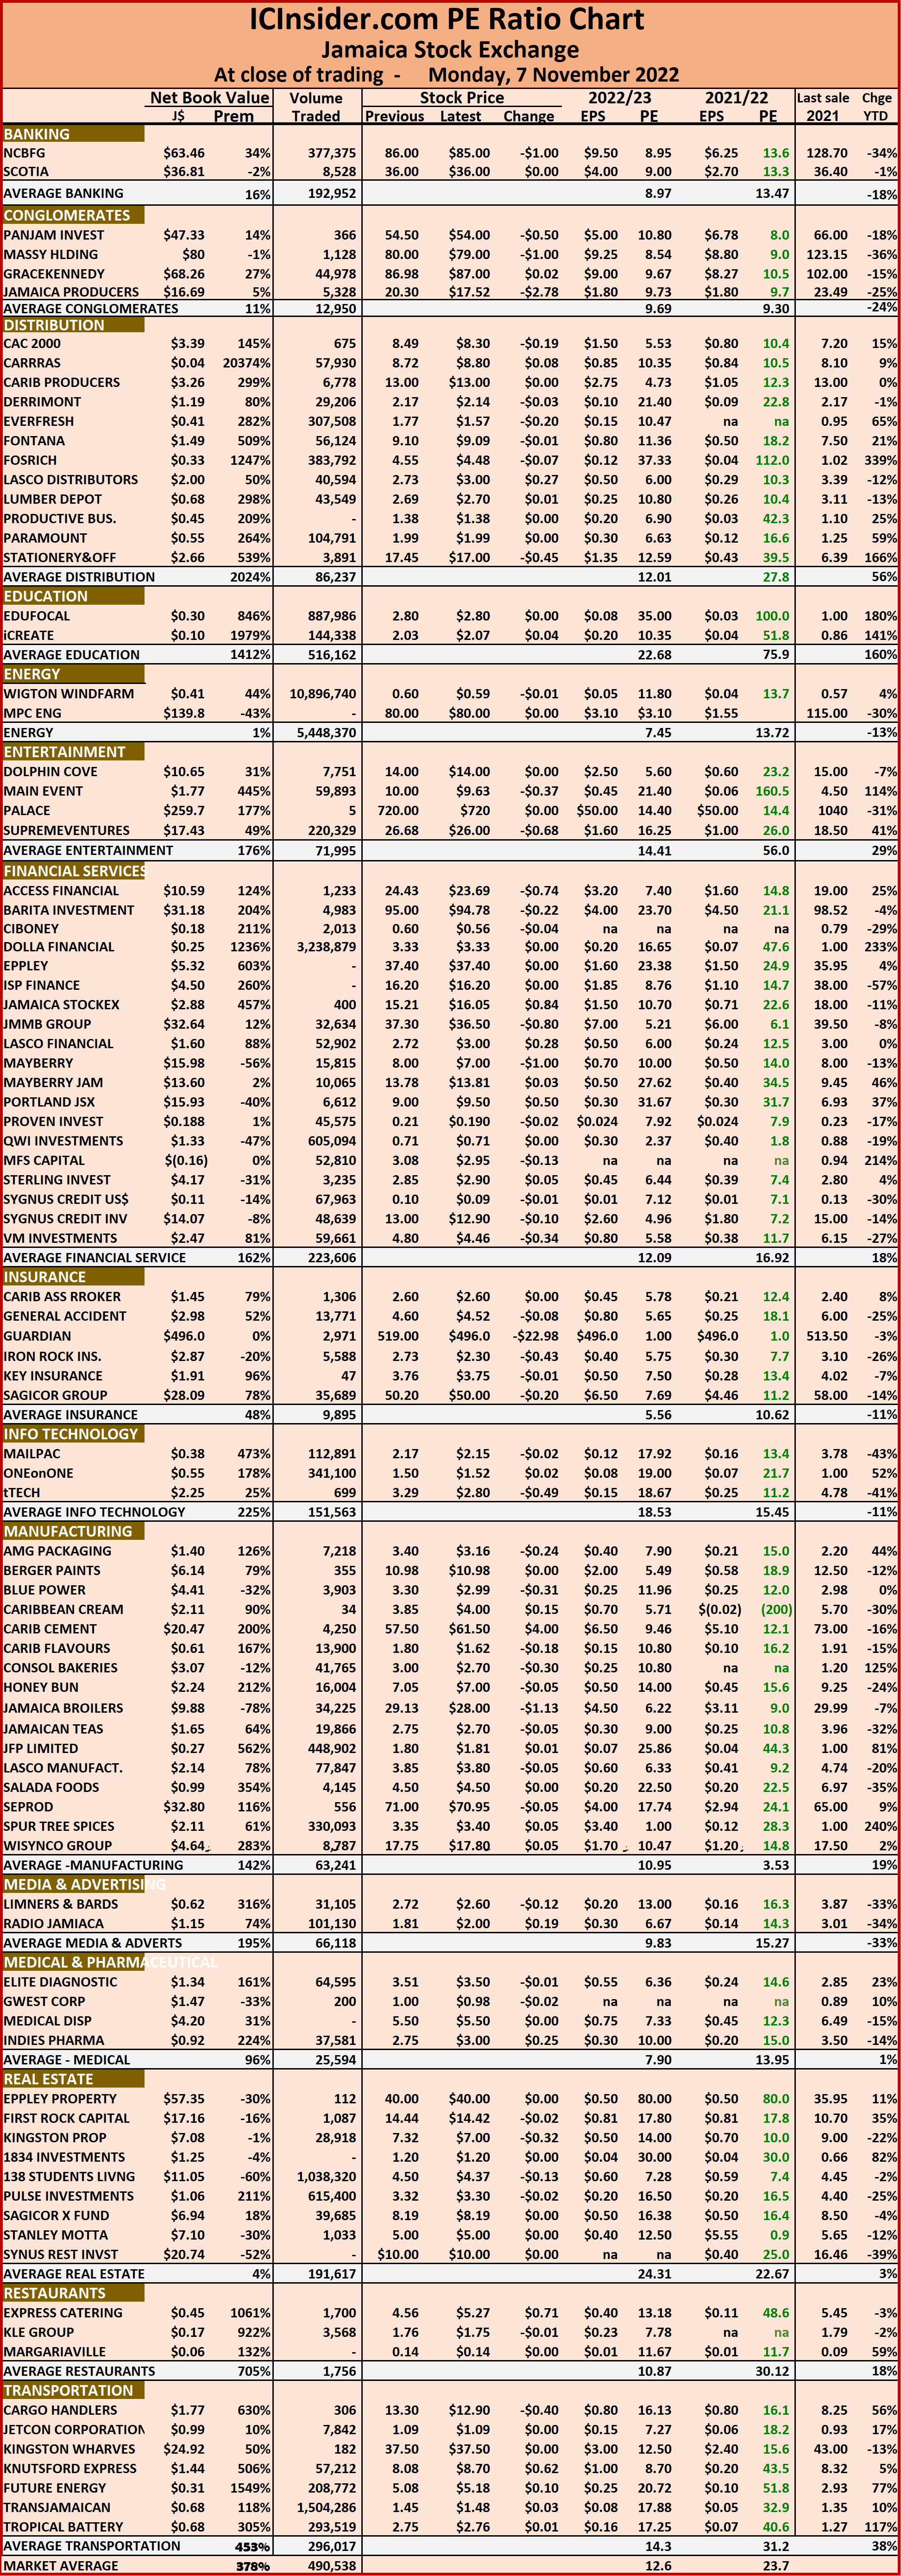 The ICInsider.com PE Ratio chart covers all ordinary shares on the Jamaica Stock Exchange. It shows companies grouped on an industry basis, allowing easy comparisons between the same sector companies and the overall market.
The net asset value of each company is reported as a guide to assess the value of stocks based on this measure quickly. The chart also shows daily changes in stock prices and the percentage year to date price movement based on the last traded prices. Dividends payable and yields for each company are shown in the Main and Junior Markets’ daily report charts that show the closing volume for the bids and offers.
The EPS & PE ratios are based on 2021 and 2022 actual or projected earnings, excluding major one off items. The PE Ratio is the most popular measure used to determine the value of stocks.
JSE markets pull back on Thursday
All three markets of the Jamaica Stock Exchange closed lower on Thursday as the market failed to carry on from Wednesday’s mild rally. In the end, the JSE Combined Market Index fell 1,729.65 points to close at 359,170.16.
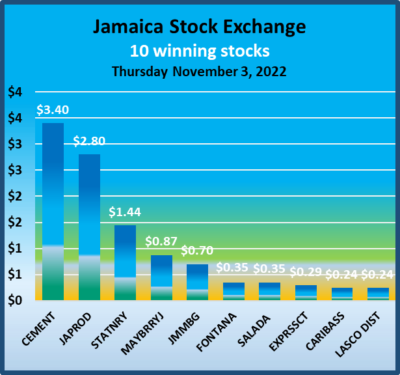 The JSE Main Index dropped 1,738.67 points to 344,902.91, the Junior Market Index slipped 11.63 points to close at 4,079.10 points while the All Jamaica Composite Index dropped 2,217.91 points to 394,298.42 and the JSE US dollar market shed 1.19points to 212.57.
Trading ended, with 19,656,102 shares changing hands, for $76.2 million, down from $69.8 million, with 10,651,504 shares traded in all markets on the previous day. The JSE USD market ended with the value of stocks traded amounting to US$29,911 from US$60,952 on Wednesday.
The market’s PE ratio ended at 23.9 based on 2021-22 earnings and 12.8 times those for 2022-23 at the close of trading.
Investors need pertinent information to successfully navigate many investment options in the local stock market. The ICInsider.com PE ratio chart and the more detailed daily report charts provide investors with regularly updated information to help decision-making.
Investors should use the chart to help make rational investment decisions by investing in stocks close to the average for the sector and not going too far from it unless there are compelling reasons to do so. This approach helps to remove emotions from investment decisions and put in on fundamentals while at the same time not being too far from the majority of investors. Investors who buy when the price of a stock is close to the average will find that they are not inclined to overpay for a stock.
The ICInsider.com PE Ratio chart covers all ordinary shares on the Jamaica Stock Exchange. It shows companies grouped on an industry basis, allowing easy comparisons between the same sector companies and the overall market.
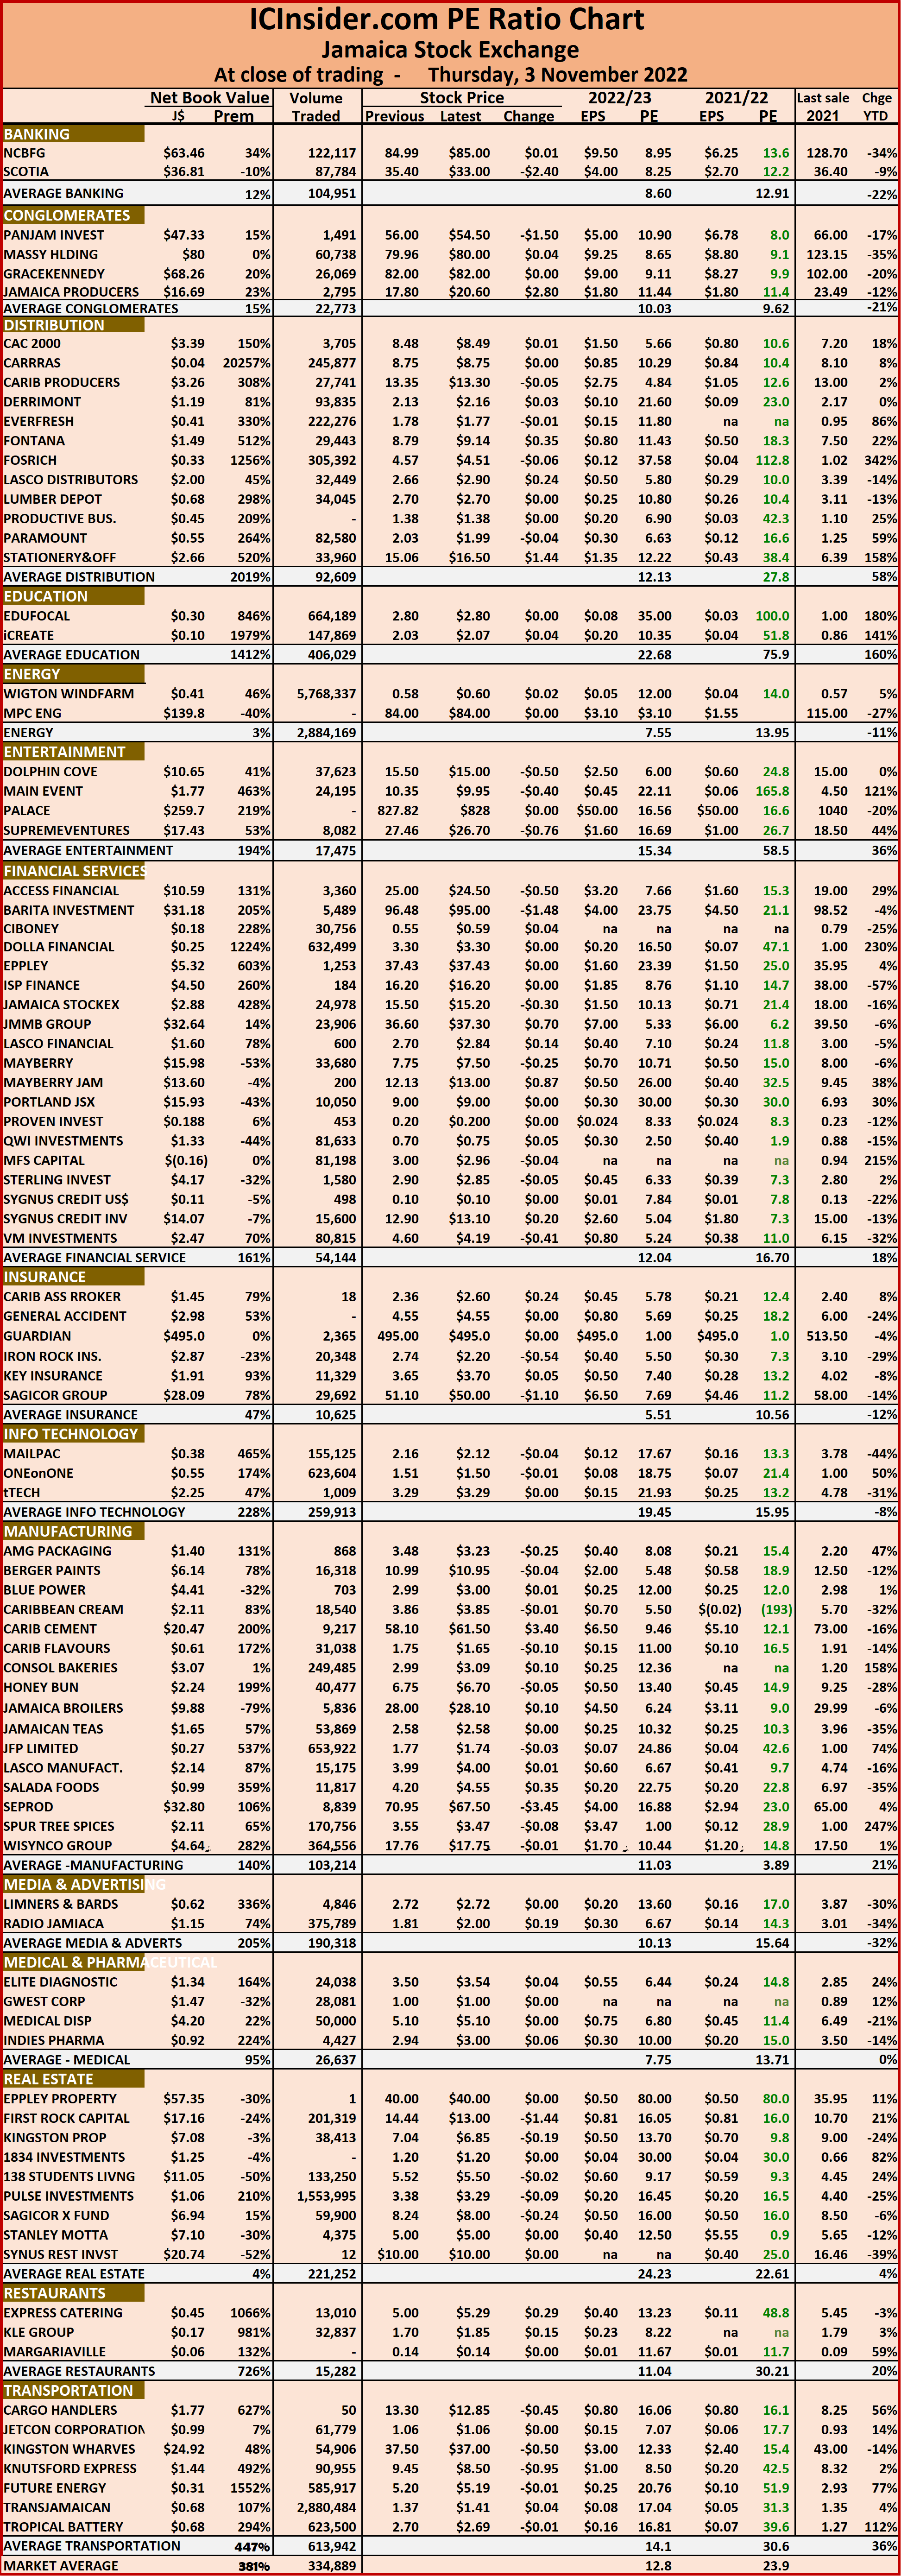 The net asset value of each company is reported as a guide to quickly assess the value of stocks based on this measure. The chart also shows daily changes in stock prices and the percentage year to date price movement based on the last traded prices. Dividends payable and yields for each company are shown in the Main and Junior Markets’ daily report charts that show the closing volume for the bids and offers.
The EPS & PE ratios are based on 2021 and 2022 actual or projected earnings, excluding major one off items. The PE Ratio is the most popular measure used to determine the value of stocks.