Productive Business Solutions (PBS) stock jumped 45 percent to a record US$2 on Friday from a close of US$1.38 on Thursday and resulted in an 18.5 percent surge in the market index to 247.51 points. The JSE Main Market ended with mixed results with mild slippage in the All Jamaica Composite and the Combined Market indices as the Junior Market suffered another decline as trading picked up on Thursday’s outturn.
 At the close of the market, the JSE Combined Market Index fell 70.38 points to 357,993.78, the JSE Main Index popped 156.36 points to 344,073.17, the Junior Market Index dropped 23.88 points to close at 4,034.83 points while the All Jamaica Composite Index fell 282.96 points to 392,366.28 and the JSE US dollar market jumped 38.74 points to end at 247.51.
Trading ended, with 32,031,909 shares changing hands, for a mere $173.17 million, versus $113.18 million, with 19,817,542 shares traded in all markets on the previous day. The JSE USD market ended with the value of stocks traded amounting to US$17,809 from US$16,127 on Thursday.
The market’s PE ratio ended at 23.8 based on 2021-22 earnings and 12.6 times those for 2022-23 at the close of trading.
Investors need pertinent information to successfully navigate many investment options in the local stock market. The ICInsider.com PE ratio chart and the more detailed daily report charts provide investors with regularly updated information to help decision-making.
 Investors should use the chart to help make rational investment decisions by investing in stocks close to the average for the sector and not going too far from it unless there are compelling reasons to do so. This approach helps to remove emotions from investment decisions and put in on fundamentals while at the same time not being too far from the majority of investors. Investors who buy when the price of a stock is close to the average will find that they are not inclined to overpay for a stock.
The ICInsider.com PE Ratio chart covers all ordinary shares on the Jamaica Stock Exchange. It shows companies grouped on an industry basis, allowing easy comparisons between the same sector companies and the overall market.
The net asset value of each company is reported as a guide to assess the value of stocks based on this measure quickly. 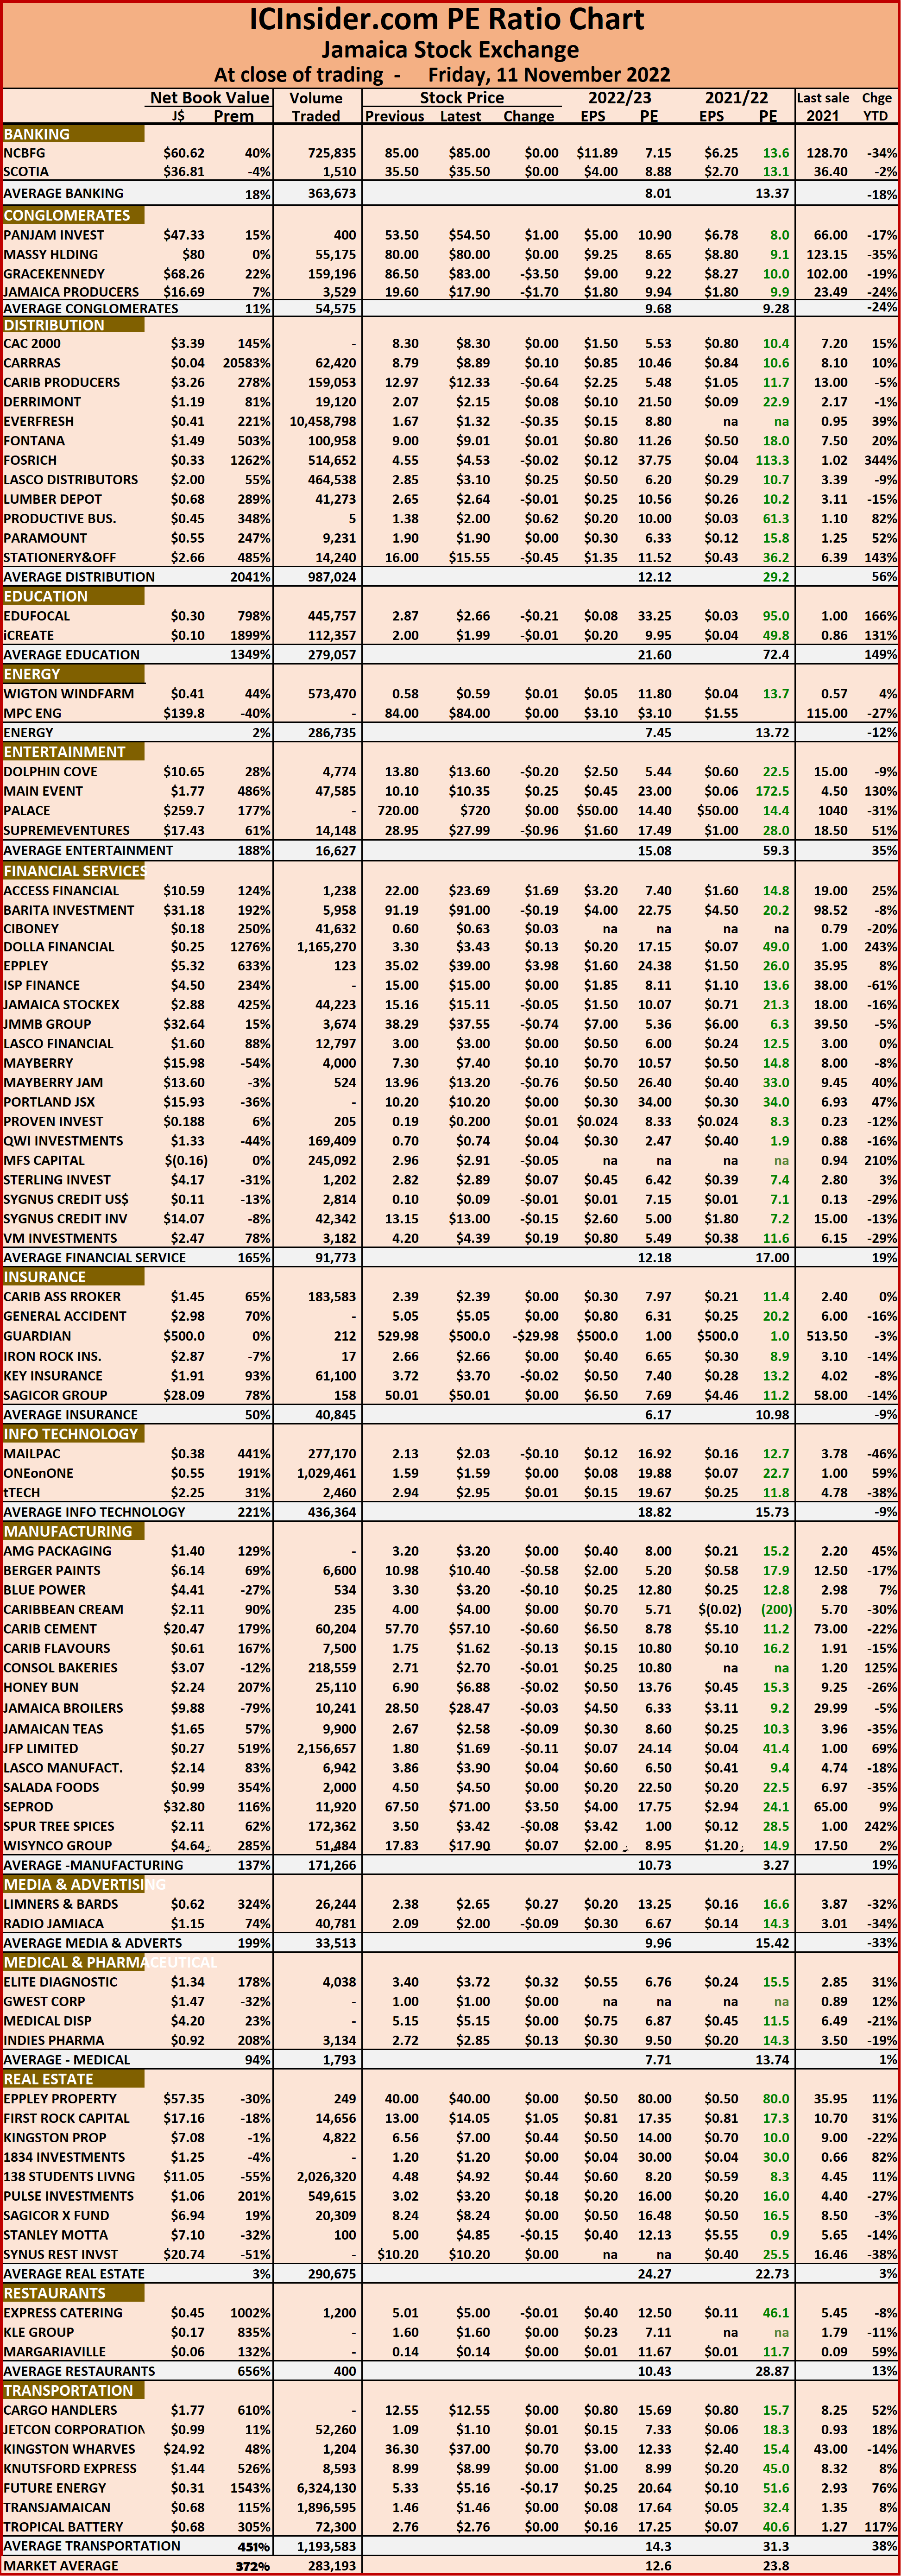 The chart also shows daily changes in stock prices and the percentage year to date price movement based on the last traded prices. Dividends payable and yields for each company are shown in the Main and Junior Markets’ daily report charts that show the closing volume for the bids and offers.
The EPS & PE ratios are based on 2021 and 2022 actual or projected earnings, excluding major one off items. The PE Ratio is the most popular measure used to determine the value of stocks.
PBS pushes JSE USD markets flying
November 11, 2022 by


