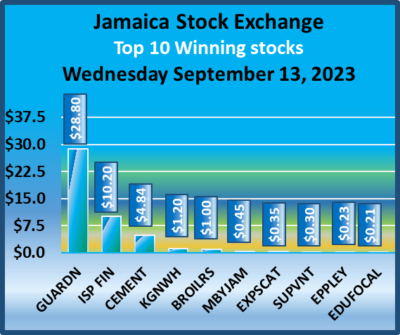
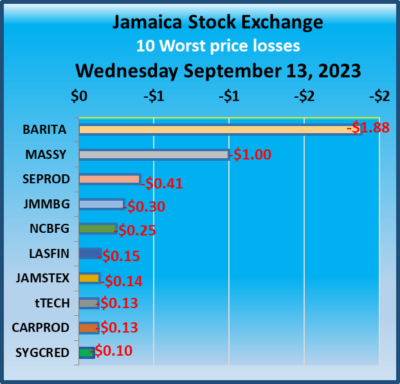
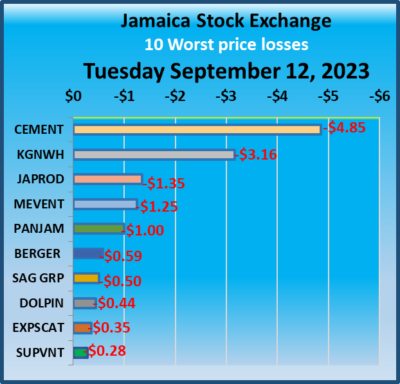
Guardian Holdings jumped $28.80 and the Junior Market ISP Finance surged $10.20, while Caribbean Cement recovered $4.84 lost on Tuesday and Barita Investments fell $1.88 and Massy Holdings $1 on a day of low trading and declines in most market indices.
 At the close, the JSE Combined Market Index shed 1,259.01 points to end at 329,392.48, the All Jamaican Composite Index shed 107.59 points to close at 350,523.65, the JSE Main Index lost 1,264.18 points to end at 316,046.21, the Junior Market Index slipped 8.68 points to 3,768.86, while the JSE USD Market Index rallied 4.15 points to 244.57.
At the close, a total of 8,767,985 shares were traded in all three markets, compared with 9,714,042 stock units on Tuesday. The value of stocks traded on the Junior and Main markets ended at just $40 million, down from $67.7 million on Tuesday. Trading on the JSE USD market rose above that on Tuesday and ended with investors trading 246,487 shares for US$10,039 from 1,397,026 units at US$71,601 on Tuesday.
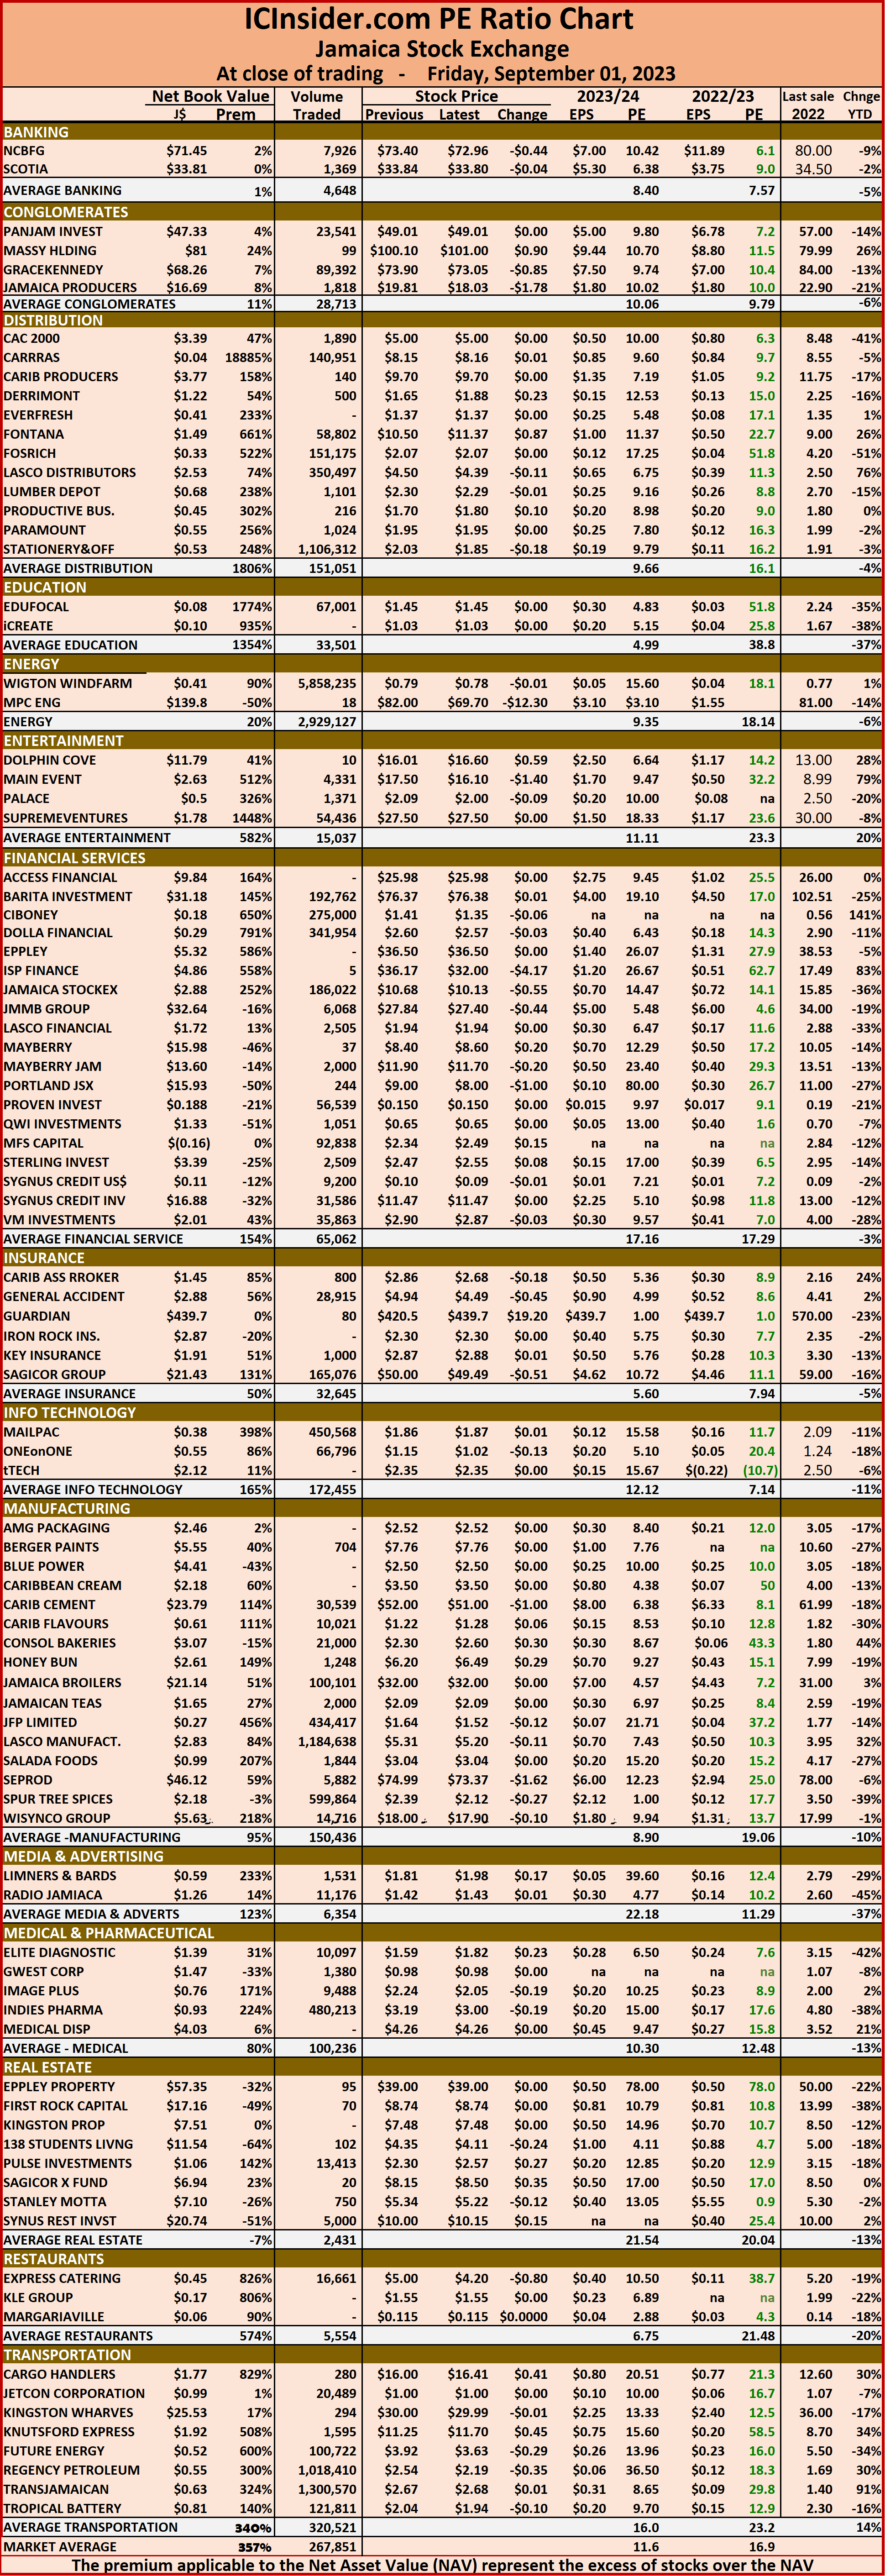
The market’s PE ratio, the most popular measure used to determine the value of stocks ended at 19.9 on 2022-23 earnings and 11.1 times those for 2023-24 at the close of trading. ICInsider.com PE ratio chart and the more detailed daily report charts provide investors with regularly updated information to help decision-making.
 The PE ratio chart covers all ordinary shares on the Jamaica Stock Exchange, with companies grouped by industry, for easy comparison between the same sector companies and the overall market. The EPS & PE ratios are based on 2023 and 2024 actual or projected earnings, excluding major one off items.
Investors need pertinent information to successfully navigate numerous investment options in the local stock market. The ICInsider.com PE ratio chart and the more detailed daily report charts provide investors with regularly updated information to help decision-making.
Investors should use the chart to help make rational decisions when investing in stocks close to the average for the sector and not going too far from it unless there are compelling reasons to do so. This approach helps to remove emotions from investment decisions and place them on fundamentals while at the same time not being too far from the majority of investors. Investors who buy when the price of a stock is close to the average will find that they are not inclined to overpay for a stock.
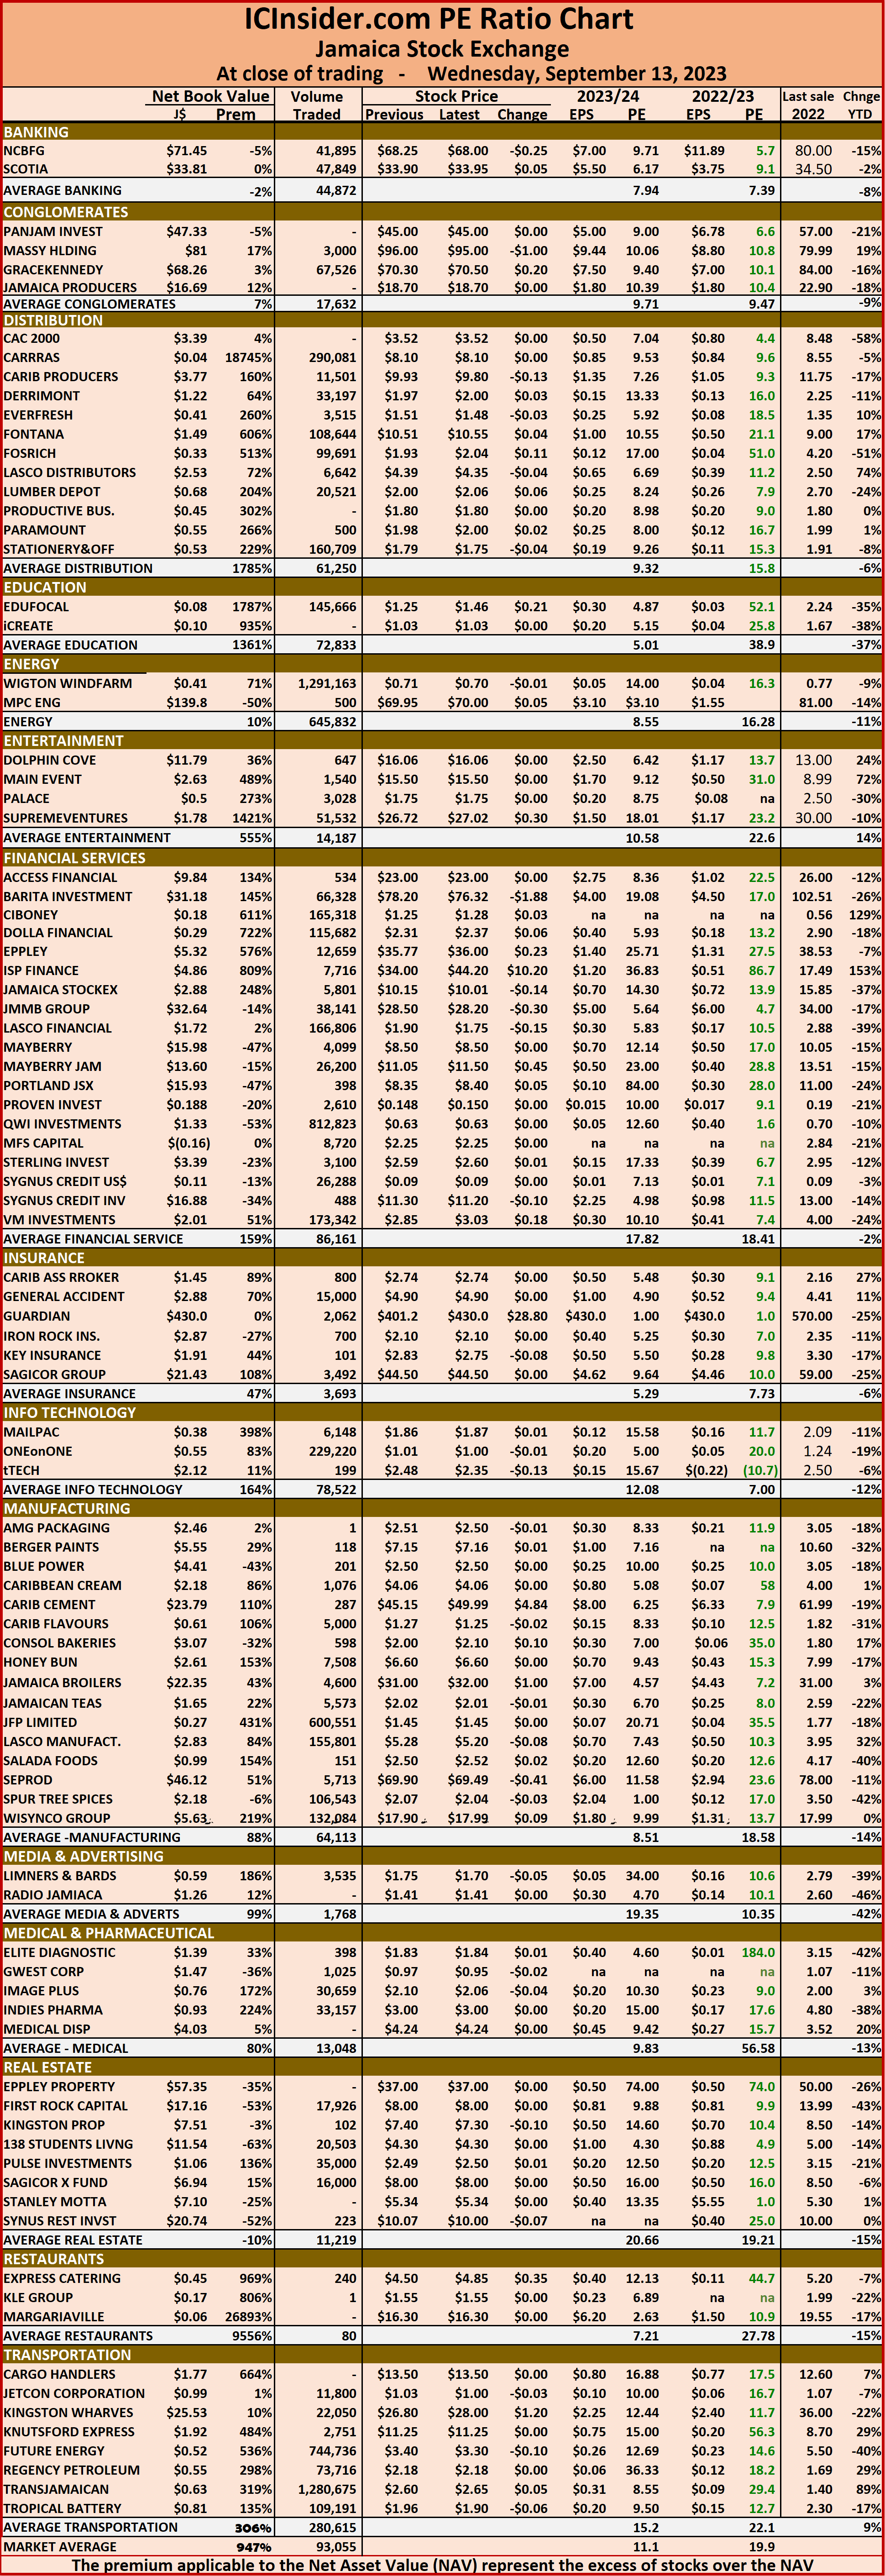 The net asset value of each company is reported as a guide to assess the value of stocks based on this measure quickly. The chart also shows daily changes in stock prices and the percentage year to date price movement based on the last traded prices.
Dividends paid or payable and yields for each company are shown in the Main and Junior Markets’ daily report charts along with the closing volume pertaining to the highest bid and the lowest offer for each company.
 At the close, the JSE Combined Market Index shed 470.27 points to close at 330,651.49, the All Jamaican Composite Index dropped 1,710.44 points to finish at 350,631.24, the JSE Main Index skidded 526.78 points to end at 317,310.39, the Junior Market Index popped 2.32 points to 3,777.54, while the JSE USD Market Index dipped 4.28 points to finish at 240.42.
 The PE ratio chart covers all ordinary shares on the Jamaica Stock Exchange, with companies grouped by industry, allowing for easy comparisons between the same sector companies and the overall market. The EPS & PE ratios are based on 2023 and 2024 actual or projected earnings, excluding major one off items.
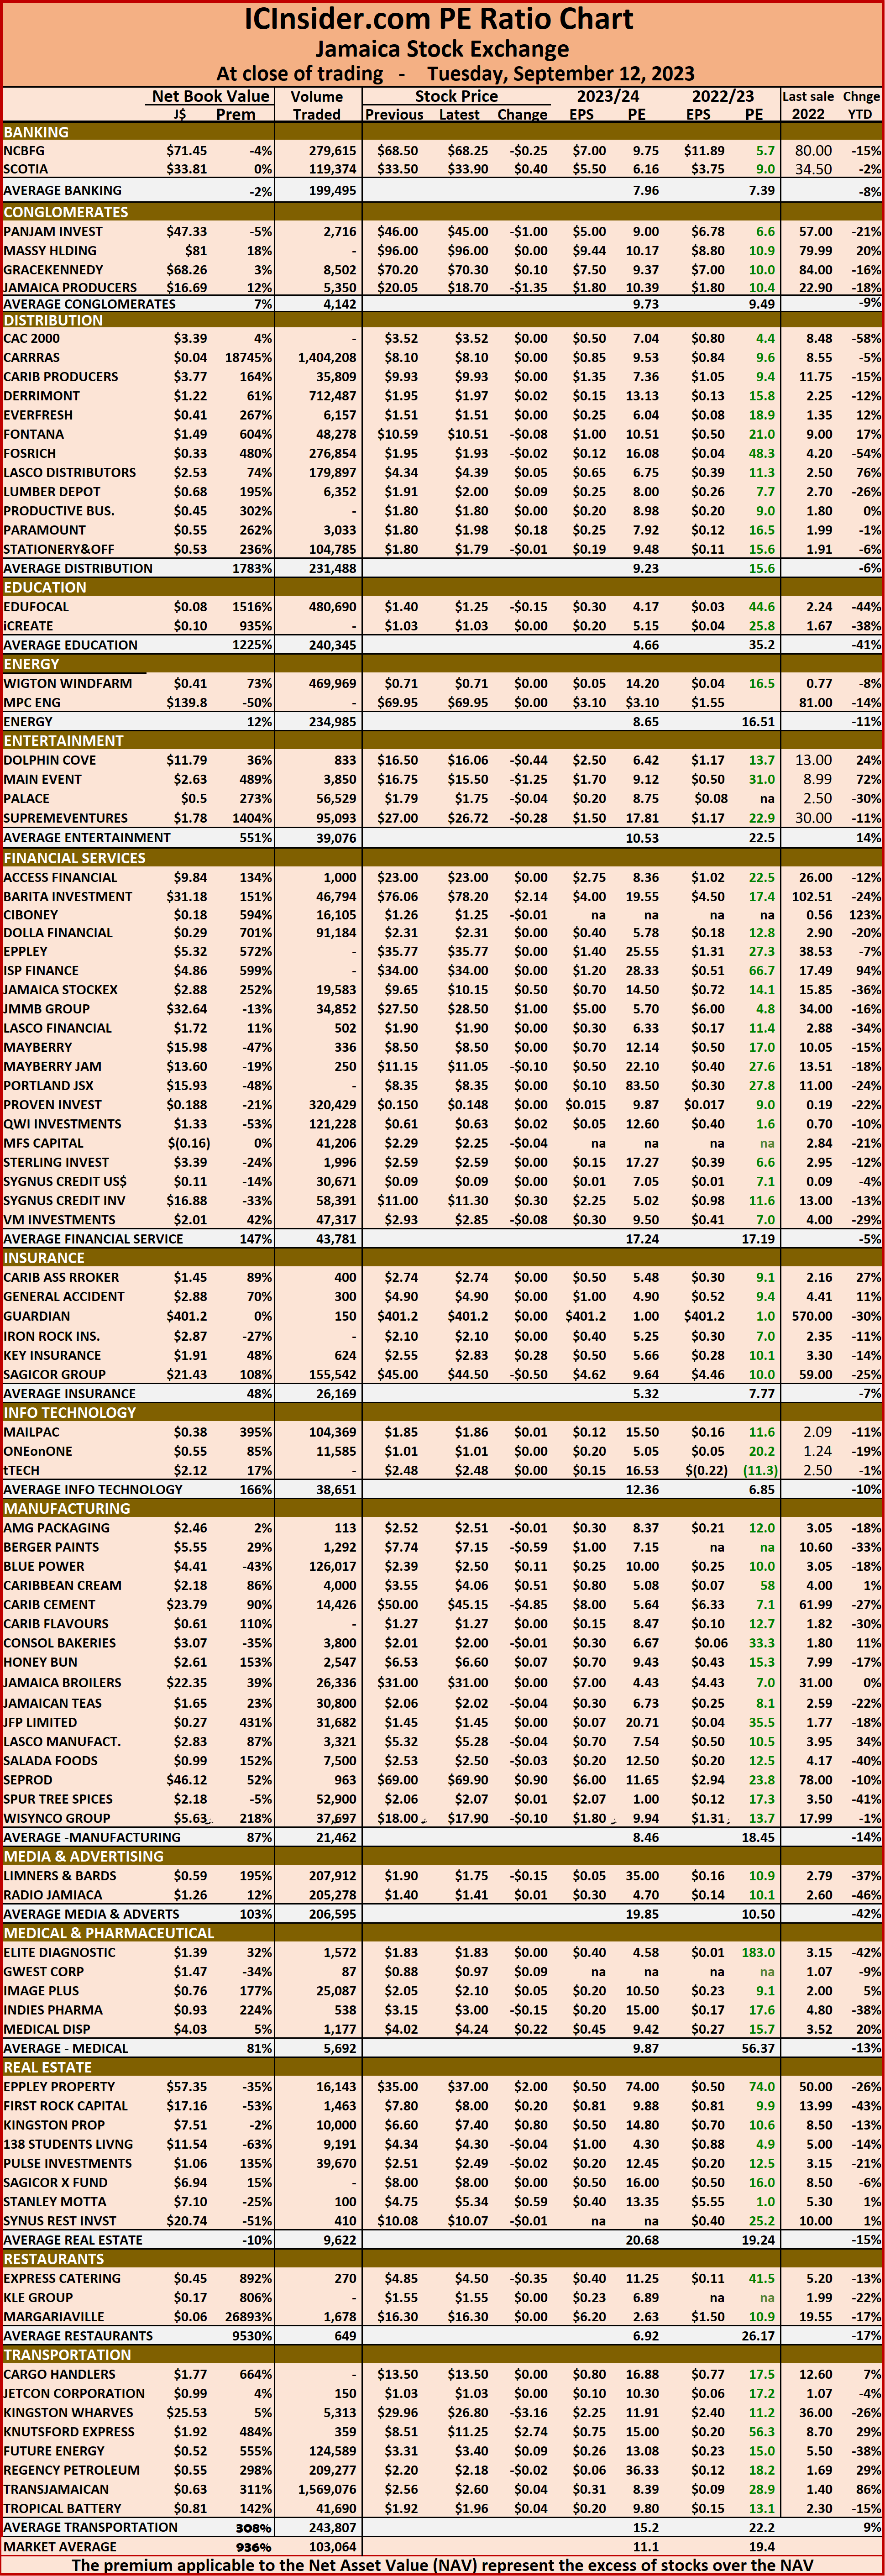 The net asset value of each company is reported as a guide to assess the value of stocks based on this measure quickly. The chart also shows daily changes in stock prices and the percentage year to date price movement based on the last traded prices.
 Trading closed with the JSE Combined Market Index dropping 2,501.16 points to end at 331,121.76, the All Jamaican Composite Index rose 672.31 points to 352,341.68, the JSE Main Index dived 2,517.03 points to finish at 317,837.17, the Junior Market Index fell 16.66 points to finish at 3,775.22 while the JSE USD Market Index rallied 2.11 points to finish at 244.70.
 The PE ratio chart covers all ordinary shares on the Jamaica Stock Exchange, with companies grouped by industry, allowing for easy comparisons between the same sector companies and the overall market. The EPS & PE ratios are based on 2023 and 2024 actual or projected earnings, excluding major one off items.
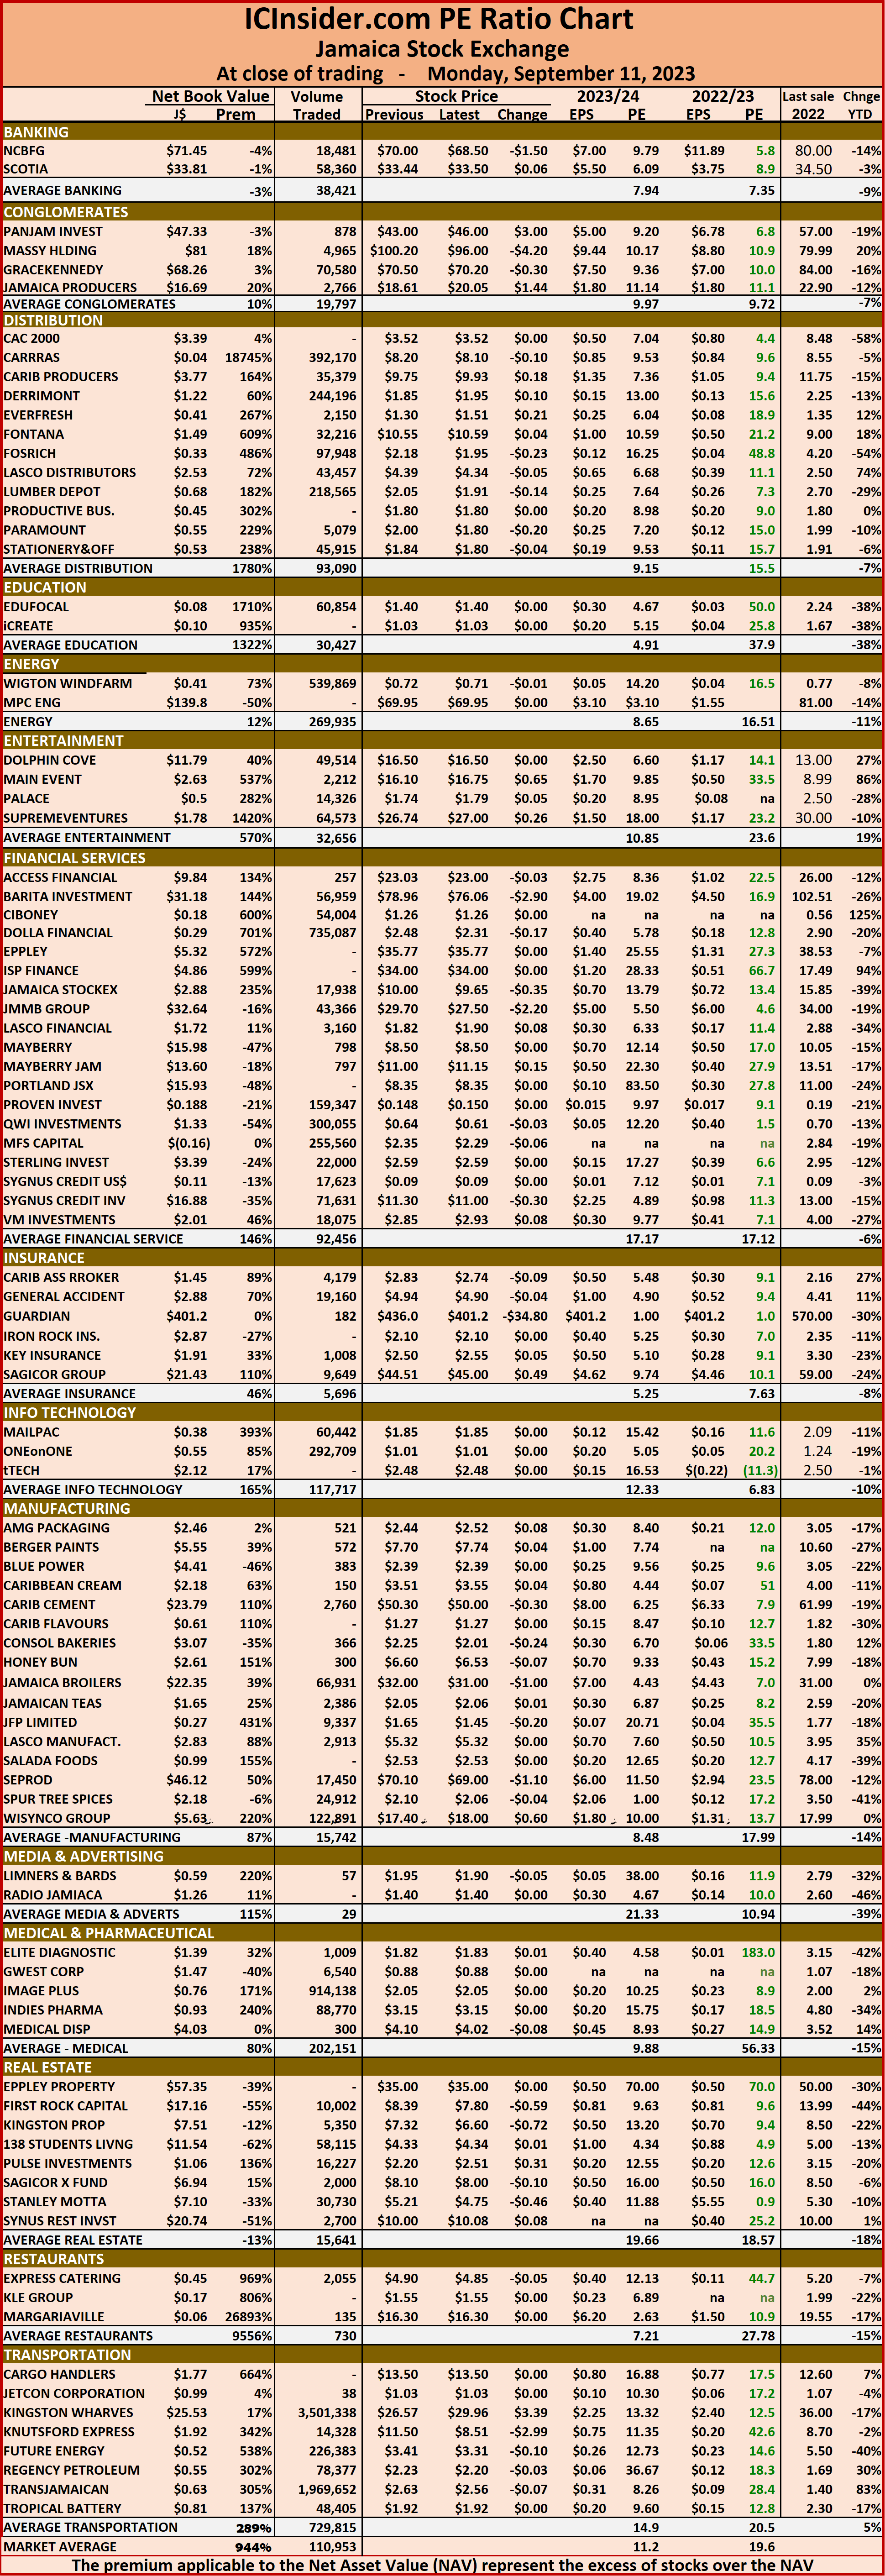 The net asset value of each company is reported as a guide to assess the value of stocks based on this measure quickly. The chart also shows daily changes in stock prices and the percentage year to date price movement based on the last traded prices.
 Elite Diagnostics had a bad fiscal year to June, with a loss of $1.7 million in the June quarter and a profit of only $2.8 million for the year, down from $49 million in 2022. With finance cost jumping to $47 million from $27 million the previous year while depreciation climbed by $41 million to $148 million. ICInsider.com expect revenues to keep on climbing at a above average rate and for cost to increase at a slower pace and deliver an attractive profit which is projected at 40 cents for the year. Recent history suggests that forecasts can be derailed by unforeseen developments, but the stock is worth while looking at as a medium term investment that is undervalued relative to potential.
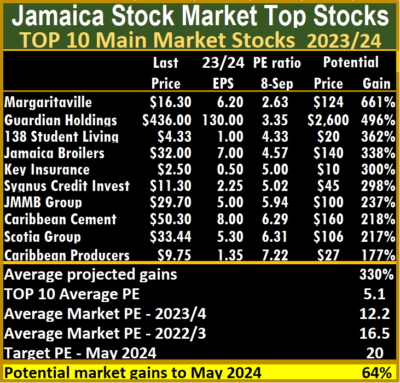 The Junior Market ICTOP10 closed the week with General Accident rising 10 percent to $4.94, followed by Caribbean Assurance Brokers, up 6 percent to $2.83 as Iron Rock Insurance dropped 9 percent to $2.10 and Everything Fresh dipped 5 percent to $1.30.
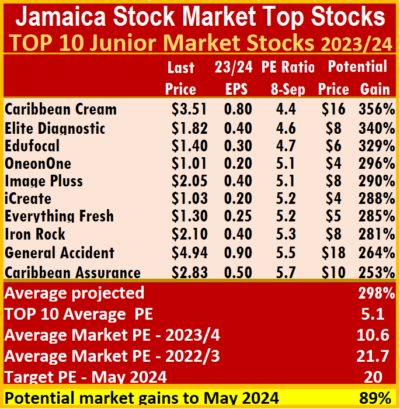 The markets are not in a bullish state but there continue to be cases of slow upward movements in some prices as investors respond to some recent attractive results leading them to quietly nibble away at a number of stocks, gradually reducing the supply of a number of them that are attractively priced. The list includes stocks such as Access Financial, AMG Packaging, Everything Fresh, Dolphin Cove, Caribbean Cream, Caribbean Assurance Brokers, Lasco Distributors and Lasco Manufacturing, Main Event and Transjamaican Highway.
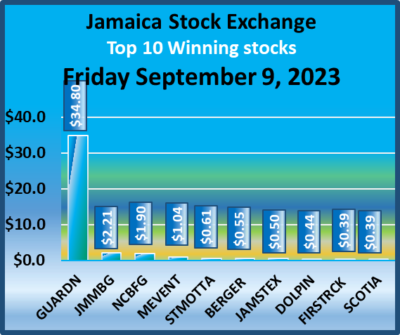 At the close, the JSE Combined Market Index popped 1,615.58 points to end trading at 333,622.92, the All Jamaican Composite Index shed 490.45 points to finish at 351,669.37, the JSE Main Index gained 1,820.33 points to settle at 320,354.20, following gains in Guardian Holdings’ shares, the Junior Market Index shed 9.06 points to conclude trading at 3,791.88, while the JSE USD Market Index rallied 1.43 points to finish at 242.59.
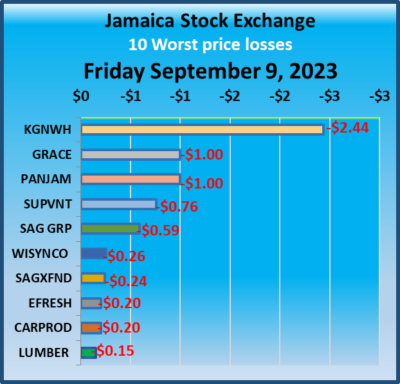 Trading on the JSE USD market rose above Thursday and ended with investors exchanging 198,322 shares for US$20,612 from 110,725 units at US$10,600 on Thursday.
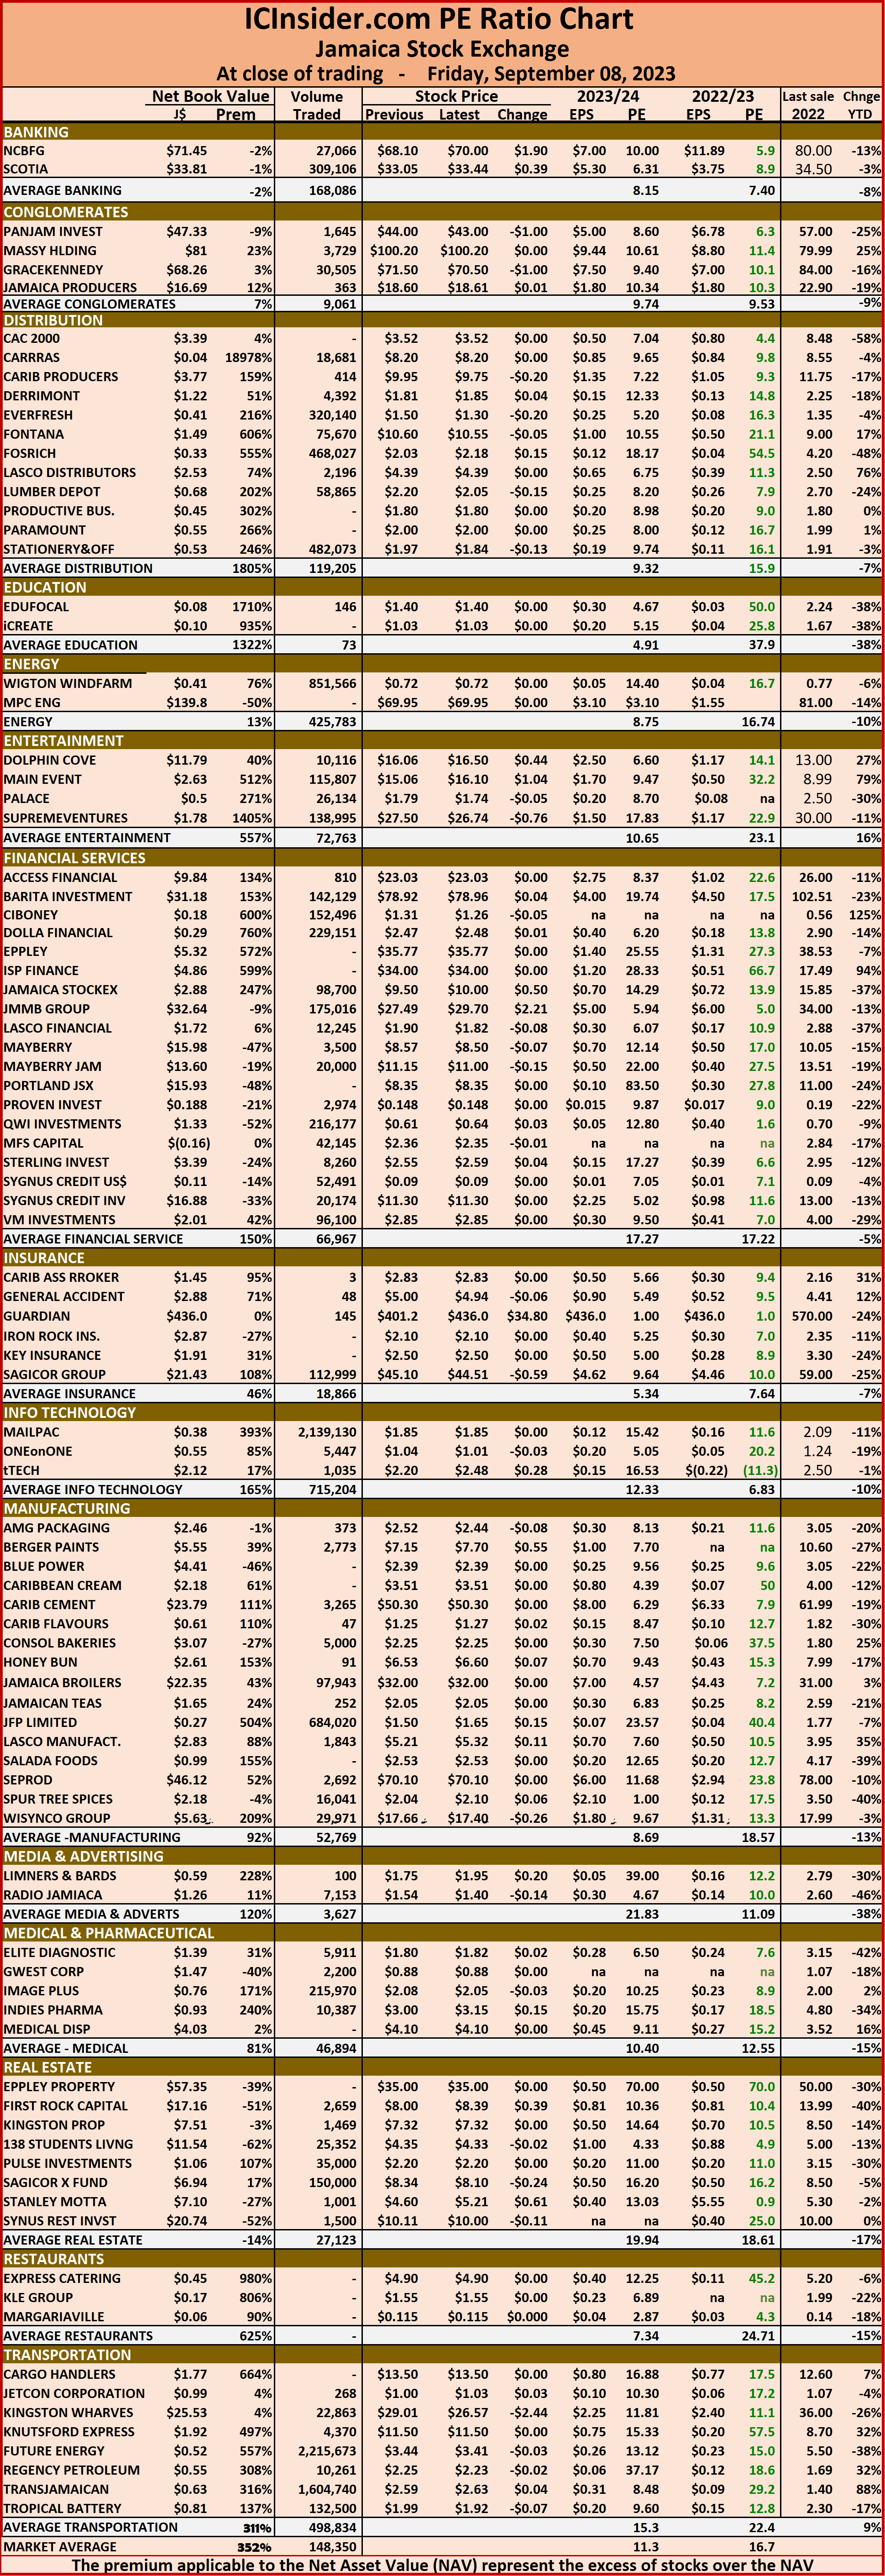 The net asset value of each company is reported as a guide to assess the value of stocks based on this measure quickly. The chart also shows daily changes in stock prices and the percentage year to date price movement based on the last traded prices.
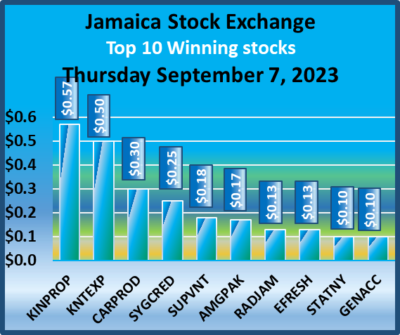 At the close, the JSE Combined Market Index shed 517.56 points to end at 332,007.34, the All Jamaican Composite Index dropped 1,632.39 points to end at 352,159.82, the JSE Main Index skidded 707.07 points to 318,533.87, the Junior Market Index popped 16.62 points to 3,800.94, while the JSE USD Market Index rallied 1.60 points to 240.93.
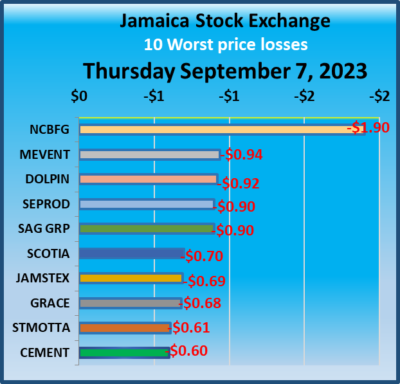 The market’s PE ratio, the most popular measure used to determine the value of stocks ended at 16.6 on 2022-23 earnings and 11.1 times those for 2023-24 at the close of trading. ICInsider.com PE ratio chart and the more detailed daily report charts provide investors with regularly updated information to help decision-making.
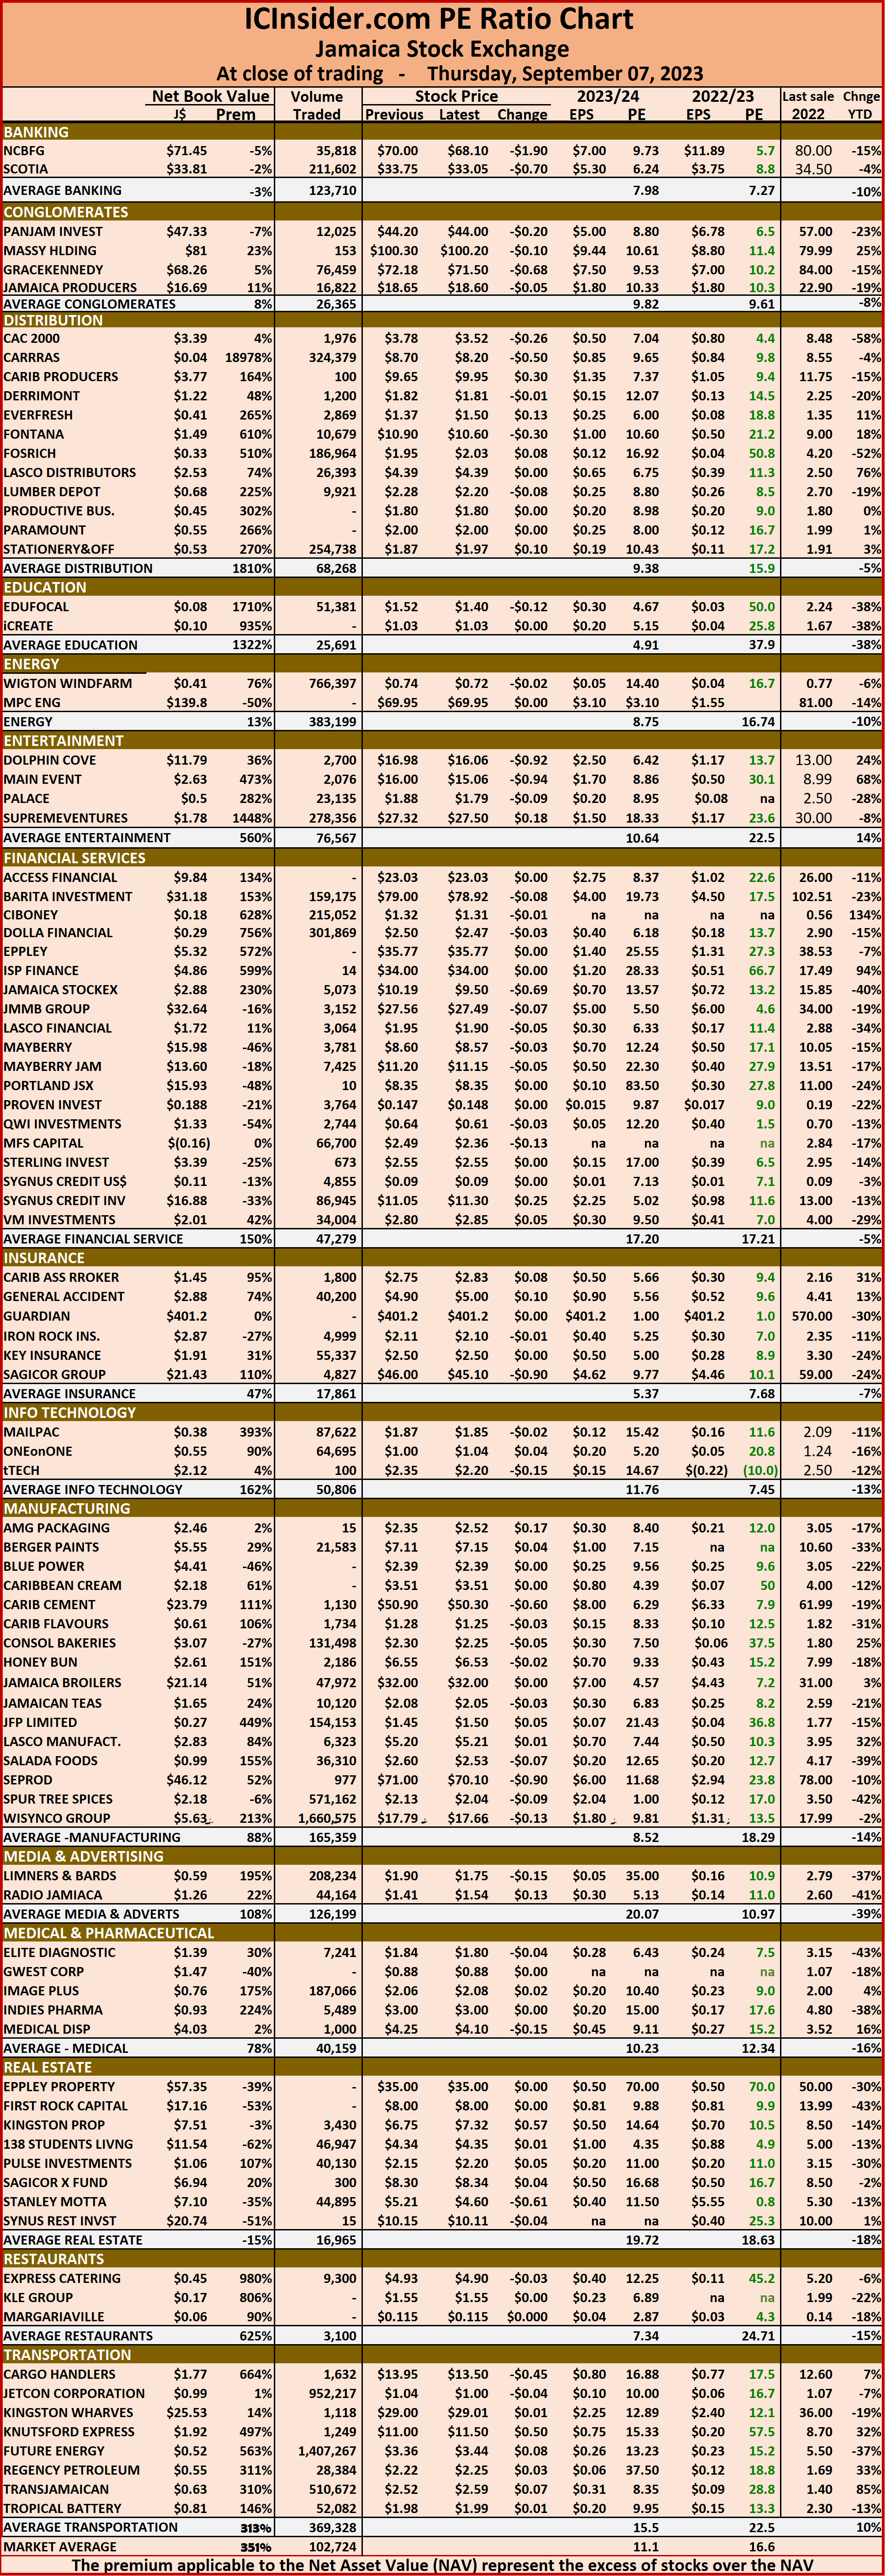 The net asset value of each company is reported as a guide to assess the value of stocks based on this measure quickly. The chart also shows daily changes in stock prices and the percentage year to date price movement based on the last traded prices.
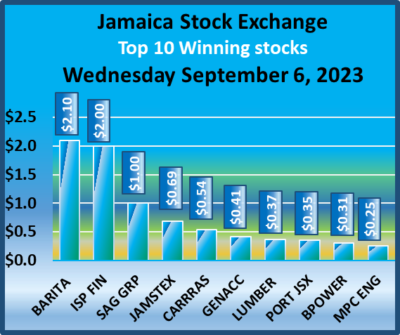 At the close, the JSE Combined Market Index shed 3,399.58 points to finish trading at 332,51.90, the All Jamaican Composite Index fell 1,333.01 points to 353,792.21, the JSE Main Index dropped 2,522.83 points to end trading at 319,240.94, the Junior Market Index skidded 114.23 points to 3,784.32 and the JSE USD Market Index dipped 4.04 points to 239.22.
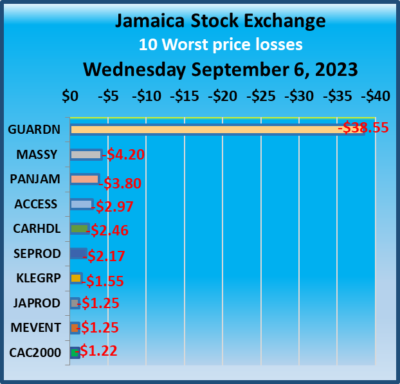 The market’s PE ratio, the most popular measure used to determine the value of stocks ended at 16.8 on 2022-23 earnings and 11.2 times those for 2023-24 at the close of trading. The ICInsider.com PE ratio chart and the more detailed daily report charts provide investors with regularly updated information to help decision-making.
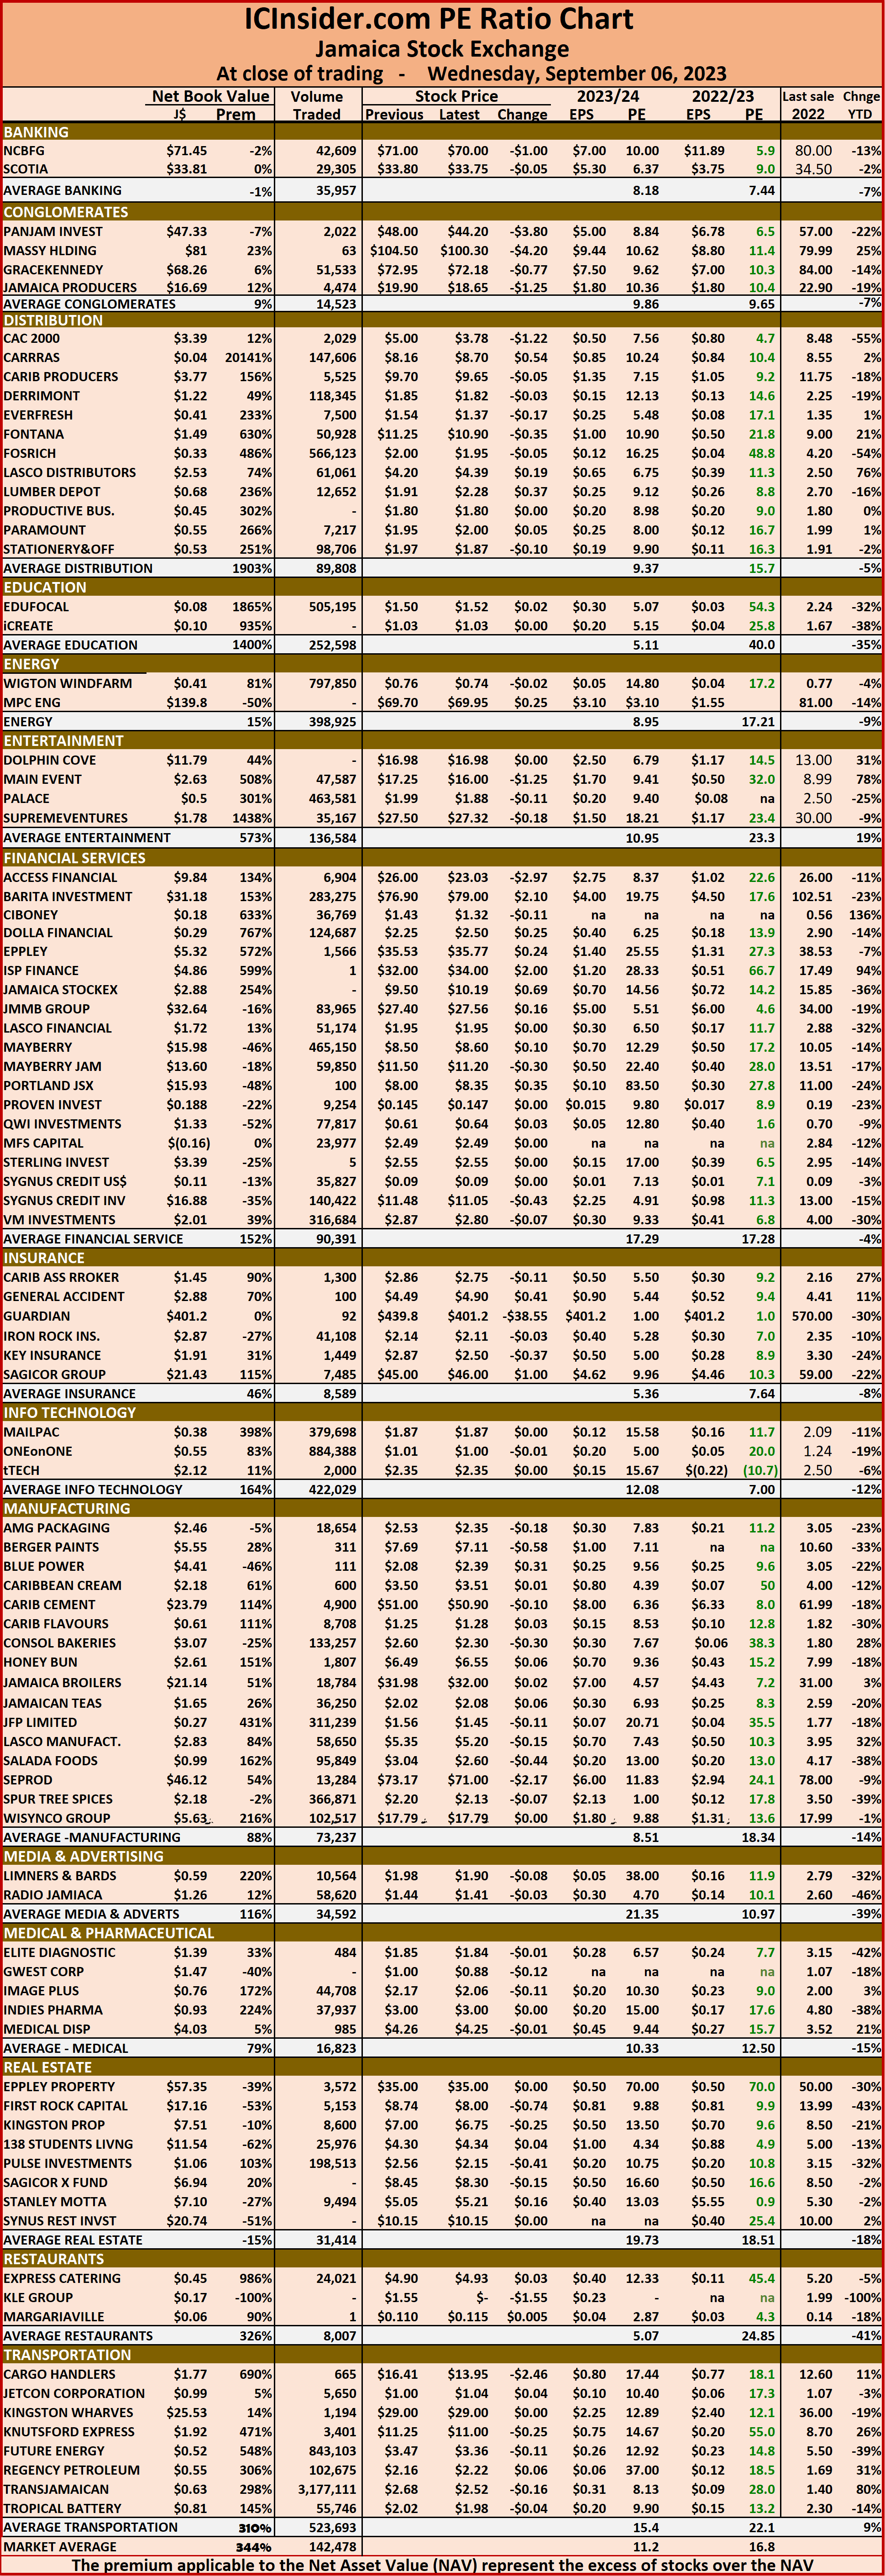 The net asset value of each company is reported as a guide to assess the value of stocks based on this measure quickly. The chart also shows daily changes in stock prices and the percentage year to date price movement based on the last traded prices.
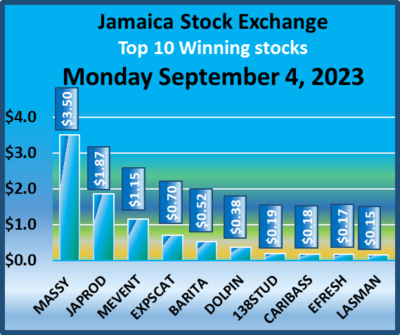 At the close, the JSE Combined Market Index fell 715.28 points to 337,481.66, the All Jamaican Composite Index shed 2,686.65 points to 355,637.89, the JSE Main Indexdeclined 938.68 points to 323,698.87, the Junior Market Index rallied 17.54 points to 3,872.50 and the JSE USD Market Index rose 0.32 points to 245.46.
 The PE ratio chart covers all ordinary shares on the Jamaica Stock Exchange. It shows companies grouped by industry, allowing for easy comparisons between the same sector companies and the overall market. The EPS & PE ratios are based on 2023 and 2024 actual or projected earnings, excluding major one off items.
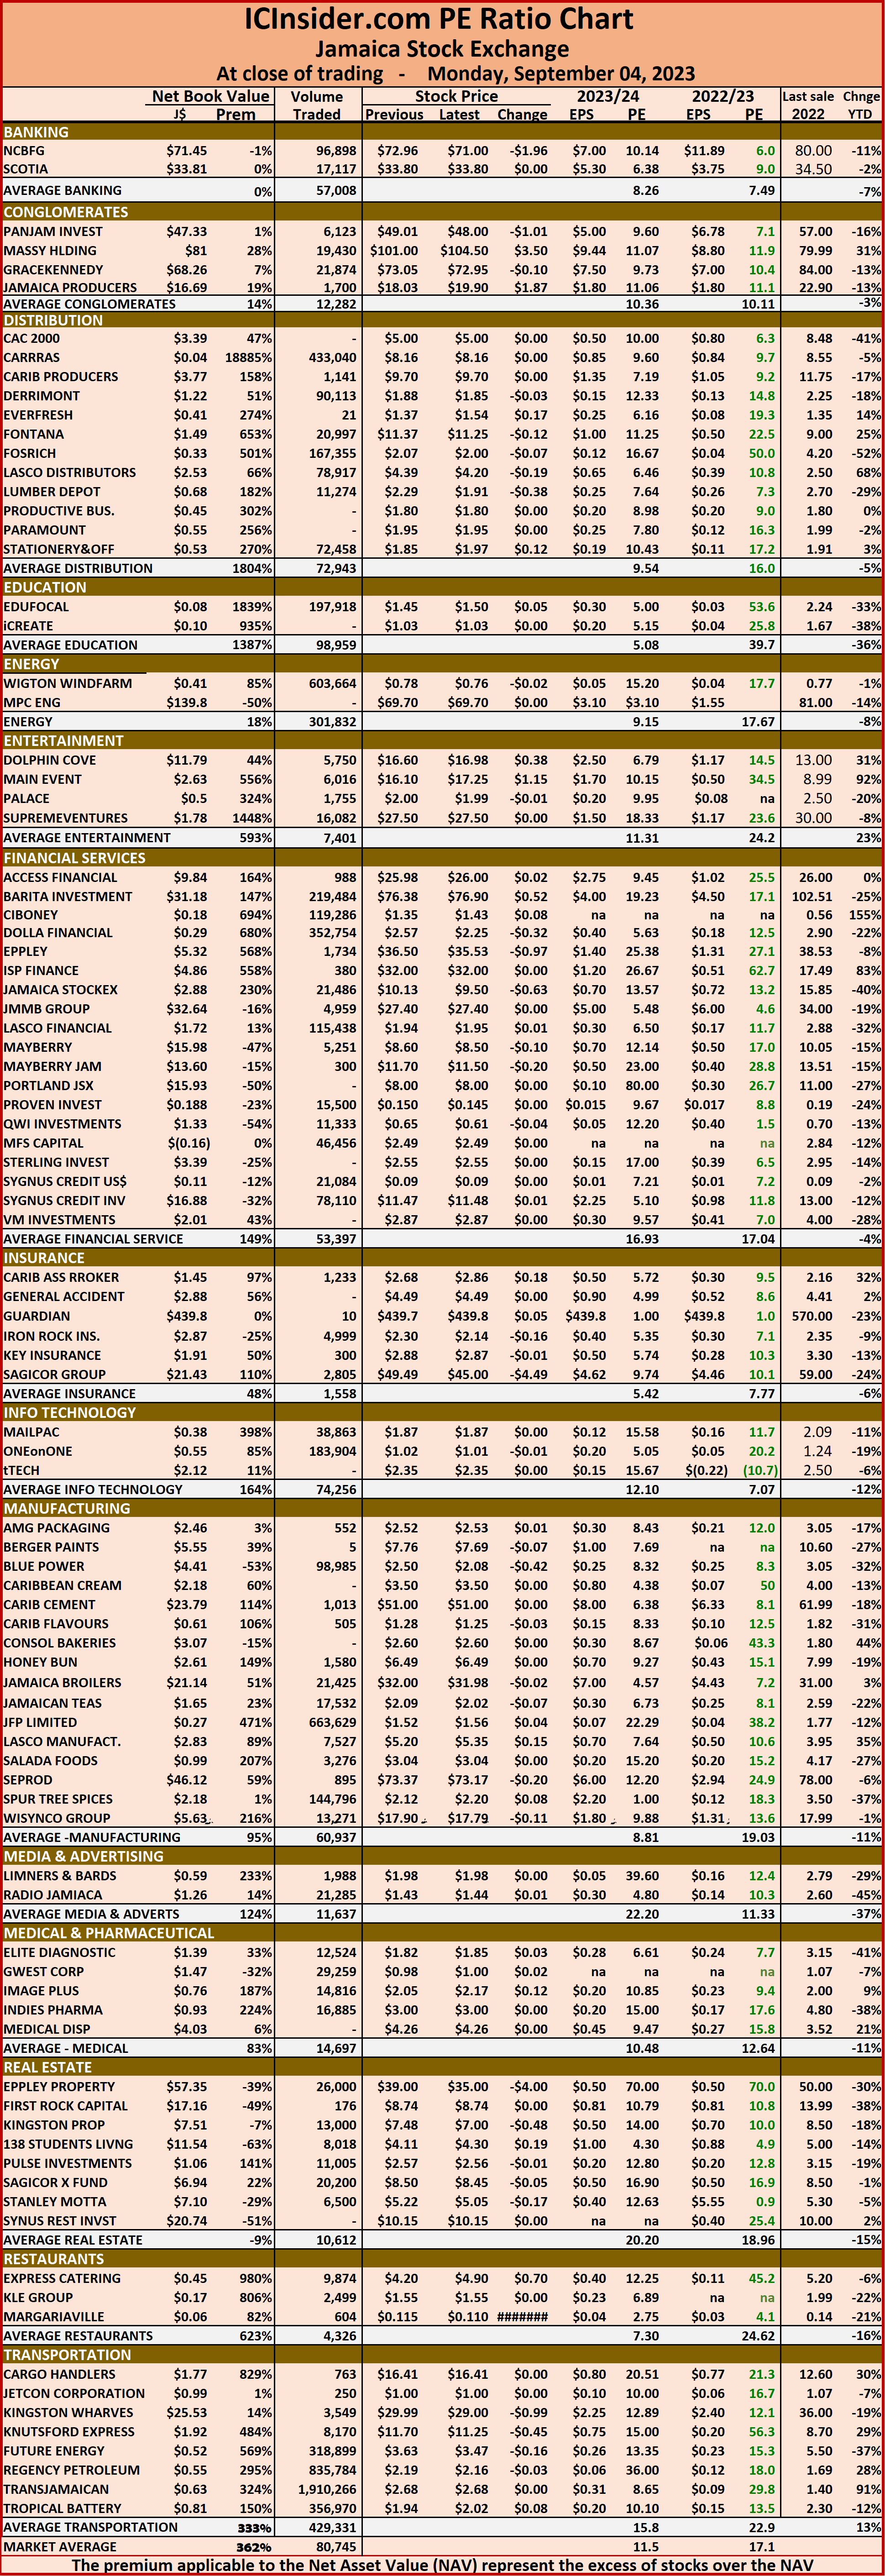 The net asset value of each company is reported as a guide to assess the value of stocks based on this measure quickly. The chart also shows daily changes in stock prices and the percentage year to date price movement based on the last traded prices.
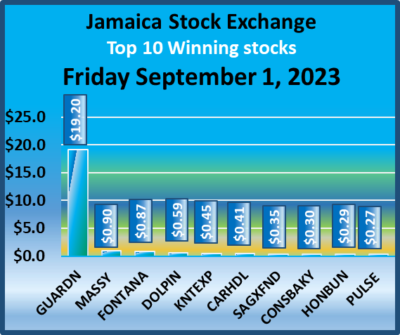 At the close, the JSE Combined Market Index rallied 2,118.43 points to 338,196.94, the All Jamaican Composite Index jumped 3,500.76 points to 358,324.54, the JSE Main Index climbed 2,905.75 points to 324,637.55, the Junior Market Index dropped 64.77 points to 3,854.96 while the JSE USD Market Index rose 5.31 points to end at 245.14.
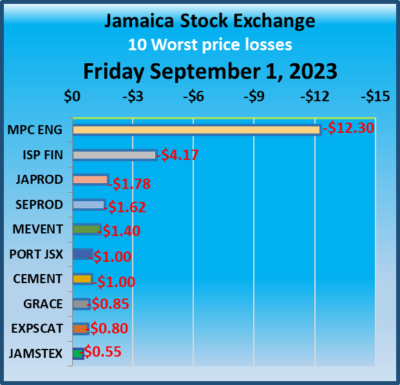 The market’s PE ratio, the most popular measure used to determine the value of stocks ended at 16.9 on 2022-23 earnings and 11.6 times those for 2023-24 at the close of trading. ICInsider.com PE ratio chart and the more detailed daily report charts provide investors with regularly updated information to help decision-making.
 The net asset value of each company is reported as a guide to assess the value of stocks based on this measure quickly. The chart also shows daily changes in stock prices and the percentage year to date price movement based on the last traded prices.
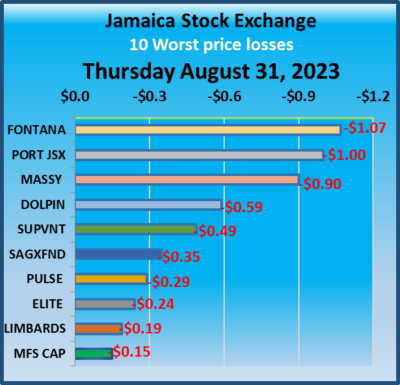
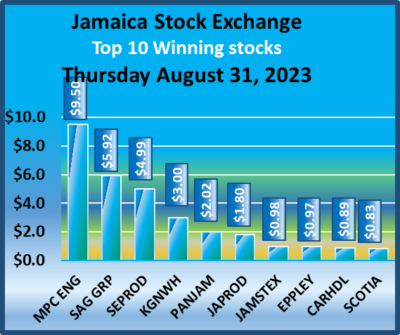 At the close, the JSE Combined Market Index climbed 3,120.24 points to close at 336,078.51, the All Jamaican Composite Index rose 3,802.79 points to 354,823.78, the JSE Main Index popped 2,577.57 points to 321,731.80, the Junior Market Index jumped by 78.13 points to settle at 3,919.73, while the JSE USD Market Index rose 1.37 points to conclude trading at 239.83.
 The market’s PE ratio, the most popular measure used to determine the value of stocks ended at 17.3 on 2022-23 earnings and 11.7 times those for 2023-24 at the close of trading. ICInsider.com PE ratio chart and the more detailed daily report charts provide investors with regularly updated information to help decision-making.
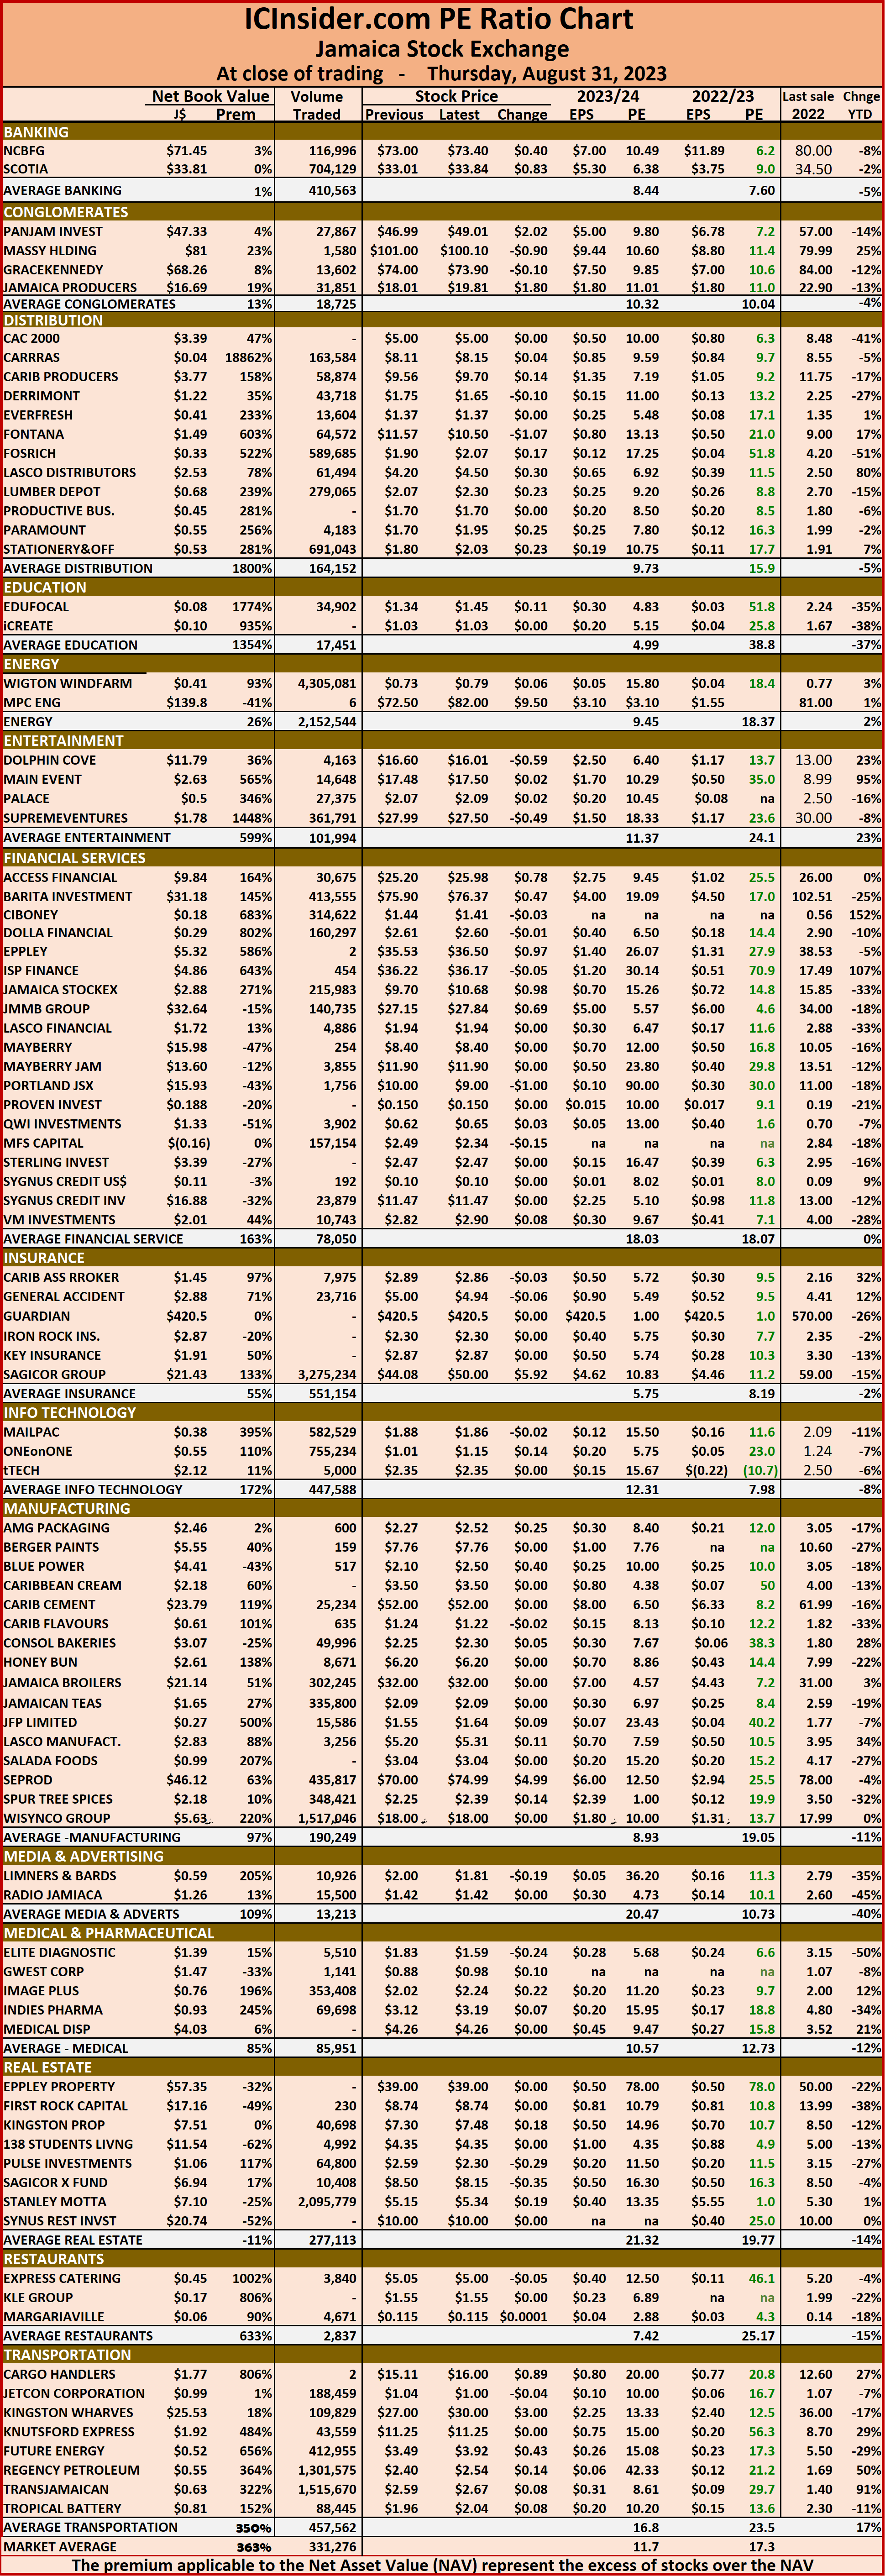 Investors should use the chart to help make rational decisions when investing in stocks close to the average for the sector and not going too far from it unless there are compelling reasons to do so. This approach helps to remove emotions from investment decisions and place them on fundamentals while at the same time not being too far from the majority of investors. Investors who buy when the price of a stock is close to the average will find that they are not inclined to overpay for a stock.