The Junior and the JSE USD markets recorded modest gains at the close of trading on Thursday but the Main Market slipped, with the volume of stocks traded falling but with a higher value than on Wednesday.
 At the close, the JSE Combined Market Index shed 517.56 points to end at 332,007.34, the All Jamaican Composite Index dropped 1,632.39 points to end at 352,159.82, the JSE Main Index skidded 707.07 points to 318,533.87, the Junior Market Index popped 16.62 points to 3,800.94, while the JSE USD Market Index rallied 1.60 points to 240.93.
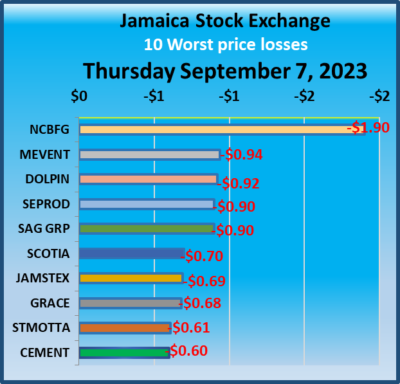
Trading of Preference shares ended, with Jamaica Public Service 7% jumping $14 to $55.
Investors traded 15,640,731 shares in all three markets, versus 17,990,028 stocks on Tuesday. The value of stocks traded on the Junior and Main markets ended at $95.7 million, up from $80.25 million on Wednesday. Trading on the JSE USD market rose above that on Wednesday and ended with investors exchanging 110,725 shares for US$10,600 from 1,090,681 units at US$25,542 on Wednesday.
 The market’s PE ratio, the most popular measure used to determine the value of stocks ended at 16.6 on 2022-23 earnings and 11.1 times those for 2023-24 at the close of trading. ICInsider.com PE ratio chart and the more detailed daily report charts provide investors with regularly updated information to help decision-making.
The PE ratio chart covers all ordinary shares on the Jamaica Stock Exchange and shows companies grouped by industry, allowing for easy comparisons between the same sector companies and the overall market. The EPS & PE ratios are based on 2023 and 2024 actual or projected earnings, excluding major one off items.
Investors need pertinent information to successfully navigate numerous investment options in the local stock market. The ICInsider.com PE ratio chart and the more detailed daily report charts provide investors with regularly updated information to help decision-making.
Investors should use the chart to help make rational decisions when investing in stocks close to the average for the sector and not going too far from it unless there are compelling reasons to do so. This approach helps to remove emotions from investment decisions and place them on fundamentals while at the same time not being too far from the majority of investors. Investors who buy when the price of a stock is close to the average will find that they are not inclined to overpay for a stock.
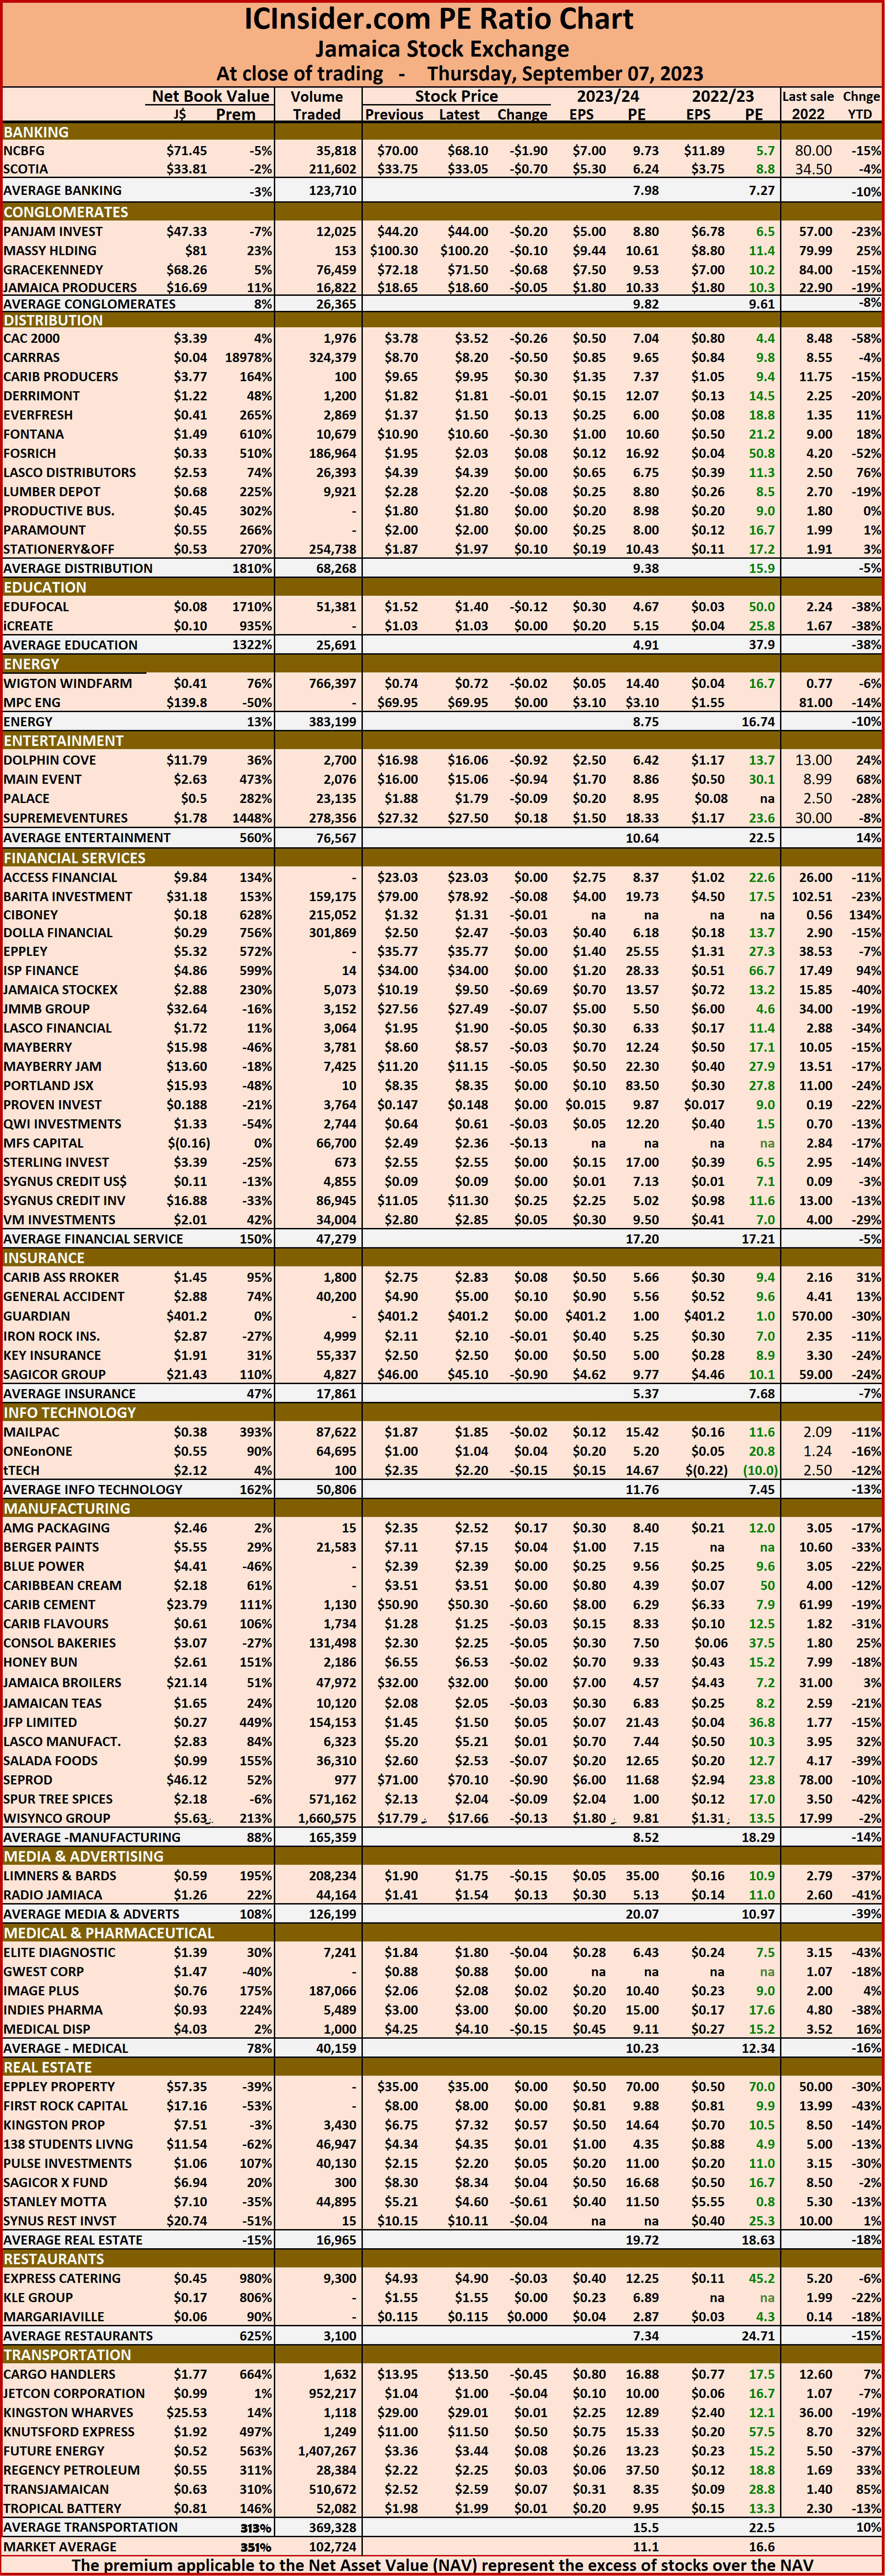 The net asset value of each company is reported as a guide to assess the value of stocks based on this measure quickly. The chart also shows daily changes in stock prices and the percentage year to date price movement based on the last traded prices.
Dividends paid or payable and yields for each company are shown in the Main and Junior Markets’ daily report charts along with the closing volume pertaining to the highest bid and the lowest offer for each company.
Mild movements in JSE Markets
September 7, 2023 by IC Insider.com
Filed Under: Feature Stories, JSE Combined, Stock Market Tagged With: Daily Trading, Emerging market, Jamaica Stock Exchange, Jamaica Stock Exchange Combined Index, Jamaican stocks, JPS, JSE Main Index, junior market, Junior Market index, Net asset Value of Jamaican stocks, PE Ratio of Jamaican stocks, Trading Activity
About IC Insider.com


