
Mr. Larren Peart of Blue Dot
Mr. Jackson, when you and I spoke yesterday (last Sunday), I told you to send me an email and we would respond officially. I also told you that the poll wasn’t finished and that there was no doubt an explanation to your question, but you have gone ahead and published analysis comparing apples to grapes.
(IC Insider.com had put the following questions to Mr. Larren Peart orally and by Whatsapp, “only approximately 50% persons voted in the 2016 general elections but your polling data says 75% did. How does this affect the poll finding to the questions asked in the polls? What could have caused such a huge variance? In addition, the poll findings suggest that 75 percent of registered voters would vote in the upcoming elections but that is far from what happened in recent elections.)
Mr. Peart continues, I also maintain that you have no grounds to discredit the conduct of our poll if the findings are consistent with other polls conducted by more established practitioners, which you have alluded to in said article. So why then single out Bluedot?
Here is our response. I trust that after reading it you will retract or reword your article. The respondent sample comprised only of persons who indicated that they intend to vote in the next general election or that they are undecided about voting. The results do not reflect the views of persons who reported that they do not intend to vote. The poll therefore only reports the views of persons who are likely or considering showing up at the polls when the next general election is held.

Pollster Bill Johnson
The poll results are not intended to be basis for calculating voter turnout as the sample does not include non-voters. It would, therefore, be incorrect to compare these findings to voter-turnout statistics as the underlying bases cannot be equated. The base for voter turnout statistics is the entire enumerated population. The base for the poll reflects only the enumerated population with the intention to vote.
On the point of focusing only on marginal seats – The sample was stratified, using appropriate quotas, to mirror the constituency distribution of the electorate, such that if a constituency accounts for 3% of the electorate, it also accounted for 3% of the final sample. As such, there is no skew towards any constituency, marginal or otherwise.
And a final point, I also read the articles hyperlinked to Bill Johnson’s and Don Anderson’s names in the article, you also harshly criticize the credibility of those polls and obviously have a bias against the conduct of polls. It is apparent to me, from reading all three articles, that anything short of a complete census of the electorate would leave you convinced.
In other words, to simplify it the first question asks if they intended to vote as a qualifying question or a screener then of those who said yes they intend to vote, we asked if they voted. Therefore, your analysis is flawed sir. It’s two separate bases.
You should have waited for us to respond. Now you have sullied our brand. Please address this soonest. Thanks.
Editor’s comments: Persons are entitled to their opinions, but that does not change the facts. The most critical issue is that if only 25 percent of persons voted for the JLP and PNP at the last election, there should not be a massive difference between persons saying they voted for the JLP compared to the PNP. There is a vast difference between both with the polls saying that the JLP supporters had 15 percentage points more votes or 38 percent more than voted at the last elections and the PNP just six percentage points or a 24 percent difference. Maybe Mr. Peart and staff should read other articles that IC Insider wrote on polls including that of the Trinidad last general elections in 2015 and some of his views may change.
 That is not far from the February polls done by
 In the past, both the Anderson and Johnson polls showed, upwards of 60 percent persons polled indicated they would turn out at the polls, but the actual numbers have fallen well short. A lot of the difference may be due to surveys concentrating on marginal voting areas than the so-called garrison seats where voter turnout is much lower than the rest of the country.
 The latest poll findings by

 Investors wanting to enjoy stock market-like gains with reduced risk have several options, but paying attention to past performance can make a big difference between ordinary or excellent returns.
 Sagicor Investments’ Sigma Equity Fund with, growth of 31.31 percent and sits at number 3 for 2019 to date but that is lower than the 36.47 percent at the similar point in 2018. VM’s Wealth Classic Equity Growth portfolio is the fourth-best performing Fund in 2019 with a gain of 29.78 percent and is significantly up on the 16.42 percent increase in the 2018 period. NCB’s E Fund is next with 29.26 percent for 2019, a huge turnaround compared to last year’s mere 2.96 percent gain.


 In 2017 and 2018 the central bank had regular weekly scheduled interventions in the market from August to October and November, but there has been none in 2019 after
 The PNP rise united and one PNP team are in a desert and seeing a massive mirage but tell their supporters that the prize is at hand, nothing could be further from the truth, as they can’t tell them of the Tsunami ahead.

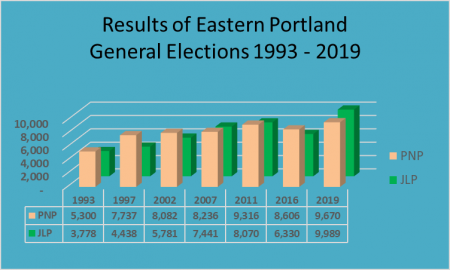 Looked at differently, he picked up just 354 votes more than in the 2011 elections or only 3.8 percent more. On a net basis, he garnered only approximately 25 percent of new voters, while Vaz got 75 percent. This is consistent with a pattern seen island wide since 1993 and is one that is not likely to change, anytime soon.
 2016 elections, when the votes by the party sank by a hefty 22 percent and well against the national trend. The trend since the 1993 elections, suggests that the natural growth in party support should have seen them polling over 9,700 votes, just below the numbers she got in the latest polls.


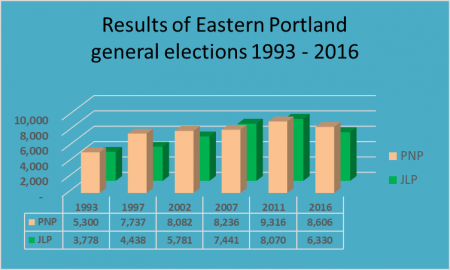 flaws in the date reported on. The numbers for Crawford at 53 percent and Vaz at 27 percent will not happen. That would result in a 80 percent voter turn-out, assuming that none of those persons who did not respond to the pollster, in fact vote. If the assumption is that no more than 60 percent of the electorate will vote then the turn out will be approximately 21,000. A 53 percent take would result in the PNP garnering 11,100 votes with the JLP having just under 10,000. The historical voting pattern suggests that Crawford is very unlikely to pick up that level of support. A 53 to 27 percent support for both parties would result in the winner getting 66 percent of the votes and the loser 34 percent and would represent a massive swing to the PNP of 8 percent and signal major trouble for the JLP and a solidification of Peter Phillips as head of the PNP. When all the issues are factored in, it looks like the support for the PNP is no more than 33 percent or just over 11,000 electorates if the turn out can rise to 60 percent, which is consistent with the results of the last two General elections.
 more than they gained in 2016.