West Indies Petroleum was listed on the exchange, with no trading in the stock, but with heavy interest to buy, on a day when investors were in a sombre mood on the Jamaica Stock Exchange Main Market on Tuesday, trading just one stock with more than one million units. Trading ended with an exchange of 87 percent fewer shares with a 90 percent lower value than on Monday, with trading in 60 securities compared with 59 on Monday, and ended with prices of 20 rising, 25 declining and 15 ending unchanged, with the market indices rising appreciably at the close.
 The market closed with 6,387,421 shares trading for $69,616,031, down sharply from 48,215,187 stock units at $679,567,514 on Monday.
Trading averaged 106,457 shares at $1,160,267, below the 817,207 stock units at $11,518,093 on Monday and for the month to date, an average of 268,534 units at $2,860,415, less than 279,139 shares at $2,971,657 on the prior day and November that closed with an average of 279,326 stock units at $1,890,583.
Transjamaican Highway led trading with 1.13 million shares for 17.6 percent of total volume followed by Carreras ended with 665,503 units for 10.4 percent of the day’s trade and NCB Financial with 546,278 stocks for 8.6 percent of the volume traded.
The All Jamaican Composite Index increased 4,232.38 points to 360,442.24, the JSE Main Index gained 2,108.73 points to settle at 312,972.62 and the JSE Financial Index rose 0.75 points to 63.39. At the close, the Investor’s Choice bid-offer indicator shows eight stocks ending with bids higher than their last selling prices and four with lower offers.
The Main Market ended trading with an average PE Ratio of 13. 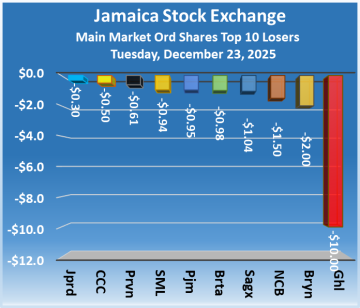 The JSE Main and the USD Market PE ratios are based on last traded prices and earnings forecasts by ICInsider.com for companies with the financial year ending around August 2026.
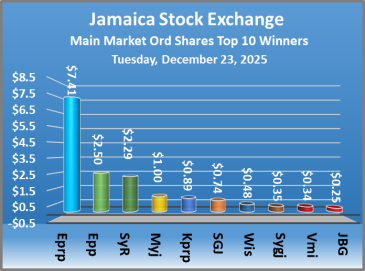
At the close, AS Bryden skidded $2 and ended at $28 as investors exchanged 7,606 shares, Barita Investments lost 98 cents to end at $70 in trading 8,362 stocks, Caribbean Cement dropped 50 cents in closing at $114, crossing the exchange 19,900 shares. Eppley increased $2.50 to finish at $33.50 with traders dealing in 9,444 stock units, Eppley Caribbean Property Fund climbed $7.41 to end at $46.99 clearing the market with 518 units, Guardian Holdings sank $10 to close at $335 with investors trading 11,644 stocks. Kingston Properties rose 89 cents to $9.06 after an exchange of 941 shares, Mayberry Jamaican Equities advanced $1 and ended at $8.42 with investors trading 5,786 stock units, NCB Financial shed $1.50 to close at $40 in an exchange of 546,278 units. Pan Jamaica sank 95 cents to end at $48 with investors swapping 1,674 stocks,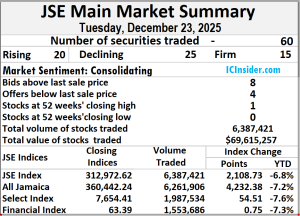 Sagicor Real Estate Fund declined $1.04 in closing at $6.86 with an exchange of 18,285 units, Scotia Group popped 74 cents to finish at $55.10 passed through the market 13,072 shares. Stanley Motta fell 94 cents to $6.20 closed at 9,862 stock units, Sygnus Real Estate Finance rallied $2.29 in closing at $12.79 with investors dealing in 4,101 shares and Wisynco Group gained 48 cents to end at $19.68, trading 22,957 stocks.
In the preference segment, Jamaica Public Service 7% popped $5.40 and ended at $41.42 crossing the market 12 units, Productive Business Solutions 10.5% slipped $95 to close at $1055 after an exchange of 120 stock units and Sygnus Credit Investments C10.5% climbed $15 to finish at $101 crossing the market 15,355 shares. Prices of securities trading are those for the last transaction of each stock unless otherwise stated.
 At the close of the market, the JSE Combined Market Index climbed 2,124.07 points to end trading at 322,986.16, the All Jamaican Composite Index jumped 4,232.38 points to finish at 360,442.24, the JSE Main Index rallied 2,108.73 points to 312,972.62, the Junior Market Index popped 14.95 points to end at 3,308.45 and the JSE USD Market Index slipped 5.58 points to 198.61.
 The market’s PE ratio, the most popular measure used to value stocks, ended at 14.1 based on 2025-26 earnings and 15.1 computed on 2024 historical earnings, excluding any major one time income or expense. The ICInsider.com PE ratio chart and the more detailed daily charts provide investors with information that is regularly updated to help decision-making.
 Investors can use this measure in assessing stock values. The chart also shows daily changes in stock prices and the percentage year to date price movement based on the last traded prices. Dividends that are paid or are due to be paid and yields for each company are shown in the Main and Junior Markets’ daily report charts, along with the closing volume of the highest bid and the lowest offer for each company.