Trading dropped 92 percent on the Jamaica Stock Exchange US Dollar Market on Friday, with both the volume and value of stocks traded declining 92 percent compared to trading on Thursday. The market activity ended with an exchange of six securities, compared with five on Thursday, with prices of three rising and three ending unchanged.
 The market closed with an exchange of 26,534 shares for US$1,226 with a slide from 339,923 stocks at US$14,918 on Thursday.
The average trade of 4,422 shares ended with an average value of US$204 a decrease from 67,985 stocks at US$2,984 on Thursday, with a month to date average of 29,147 units at US$1,844 and is well aligned with 30,508 stocks at US$1,934 on the previous day and October that closed with an average of 35,022 units for US$2,855.
The US Denominated Equities Index gained 0.25 points to end at 199.67. The Investor’s Choice bid-offer indicator shows four stocks ending with bids higher than their last selling prices and none with a lower offer.
The PE Ratio, one of the most frequently used measures to determine appropriate stock values, averages 8.2. The PE ratio is computed by using the last traded price divided by projected earnings, computed by ICInsider.com for companies with the financial year ending around August 2026.
At the close of trading,  Margaritaville popped 1.2 cents to end at 9.2 US cents with 80 shares switching owners, Proven Investments remained at 10 US cents with investors swapping 6,190 units, Sterling Investments climbed 0.1 of a cent to close at 2 US cents with 497 stock units clearing the market. Sygnus Credit Investments ended at 7.01 US cents in trading of 30 shares, Sygnus Real Estate Finance USD share ended at 6.24 US cents after closing with an exchange of 37 stock units and Transjamaican Highway popped 0.01 of one cent to end at 2.97 US cents with 19,700 shares changing hands.
Prices of securities trading are those for the last transaction of each stock unless otherwise stated.
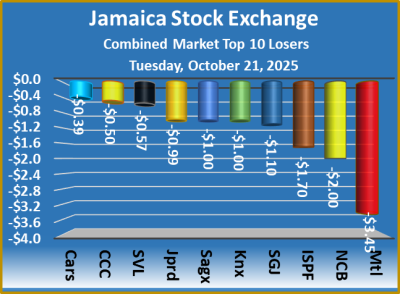
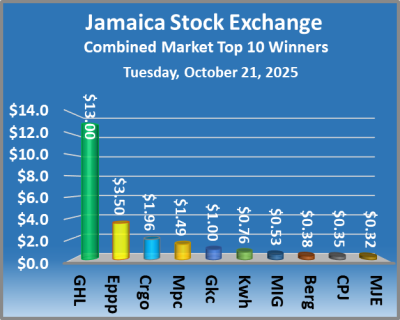 At the close of the market, the JSE Combined Market Index rose 17.35 points to 332,473.13, the All Jamaican Composite Index increased 16.66 points to 366,060.98, the JSE Main Index sank with a mere 50.92 points to 322,428.58. The Junior Market Index gained 9.31 points to settle at 3,370.51 and the JSE USD Market Index slipped 0.51 points to finish at 193.84.
 The PE ratio chart covers all ordinary shares listed on the Jamaica Stock Exchange, grouped by industry, allowing for easy comparisons within a sector and the overall market. The earnings per share (EPS) and PE ratios are based on 2024 and 2025 actual or projected earnings, excluding any major one time income or expense.
 The net asset value of each company is incorporated into the chart. Investors can use this measure in assessing stock values. The chart also shows daily changes in stock prices and the percentage year to date price movement based on the last traded prices. Dividends that are paid or are due to be paid and yields for each company are shown in the Main and Junior Markets’ daily report charts, along with the closing volume of the highest bid and the lowest offer for each company.
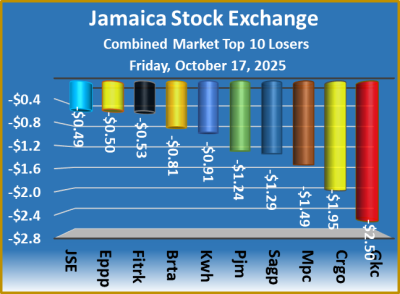
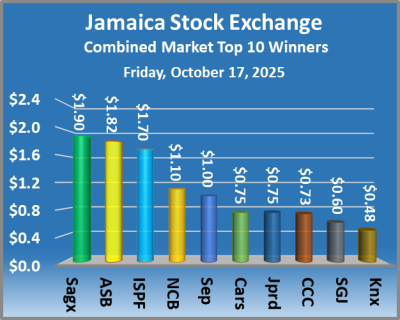 At the close of the market, the JSE Combined Market Index gained 788.72 points to end trading at 332,455.78, at the same time the All Jamaican Composite Index gained 497.57 points to settle at 366,044.32, the JSE Main Index climbed 880.49 points to wrap up trading at 322,479.50, the Junior Market Index slipped 7.59 points to end at 3,361.20 and the JSE USD Market Index rallied 2.26 points to 194.35.
 The ICInsider.com PE ratio chart and the other more detailed daily charts provide investors with regularly updated information to help decision-making. The PE ratio chart includes all ordinary shares that are listed on the Jamaica Stock Exchange, and grouped by industry, allowing for easy comparisons within a sector and the overall market. The earnings per share (EPS) and PE ratios are based on 2024 and 2025 actual or projected earnings, excluding any major one time income or expense.
 The net asset value of each company is incorporated into the chart. Investors can use this measure in assessing stock values. The chart also shows daily changes in stock prices and the percentage year to date price movement based on the last traded prices. Dividends that are paid or are due to be paid and yields for each company are shown in the Main and Junior Markets’ daily report charts, along with the closing volume of the highest bid and the lowest offer for each company.
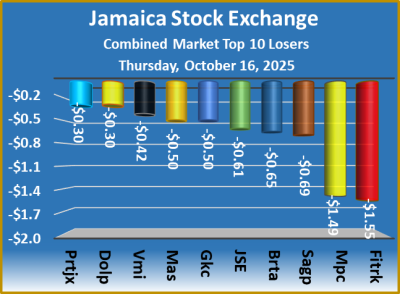
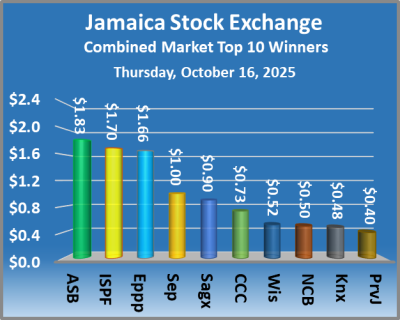 At the close of the market, the JSE Combined Market Index dropped 842.07 points to 331,667.06, the All Jamaican Composite Index lost 1,750.78 points to end at 365,546.75, the JSE Main Index skidded 930.58 points to wrap up trading at 321,599.01, the Junior Market Index popped 6.82 points to end at 3,368.79 and the JSE USD Market Index dipped 1.19 points to 192.09.
 The ICInsider.com PE ratio chart and the other, more detailed daily charts provide regularly updated information to help decision-making. The PE ratio chart covers all ordinary shares listed on the Jamaica Stock Exchange and grouped by industry, allowing for easy comparisons within a sector and the overall market. The earnings per share (EPS) and PE ratios are based on actual 2024 and projected 2025 earnings, excluding any major one time income or expense.
 The net asset value of each company is incorporated into the chart. Investors can use this measure in assessing stock values. The chart also shows daily changes in stock prices and the percentage year to date price movement based on the last traded prices. Dividends that are paid or are due to be paid and yields for each company are shown in the Main and Junior Markets’ daily report charts, along with the closing volume of the highest bid and the lowest offer for each company.
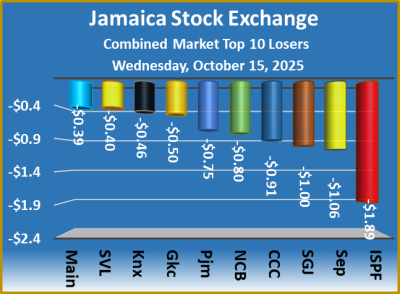
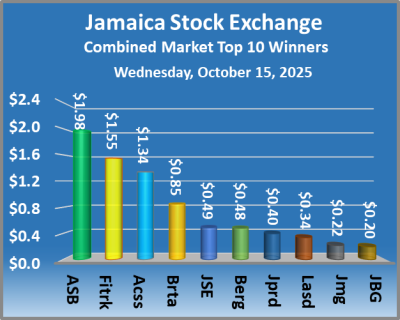 At the close of the market, the JSE Combined Market Index gained 282.39 points to 332,509.13, the All Jamaican Composite Index rallied 709.26 points to wrap up trading at 367,297.53, the JSE Main Index rallied 243.47 points to end at 322,529.59, the Junior Market Index increased a mere 6.96 points to finish at 3,361.97 and the JSE USD Market Index lost just 0.29 points to 193.28.
 The PE ratio chart covers all ordinary shares listed on the Jamaica Stock Exchange, grouped by industry, allowing for easy comparisons within sectors and the overall market. The earnings per share (EPS) and PE ratios are based on 2024 and 2025 actual or projected earnings, excluding any major one time income or expense.
 The chart also shows daily changes in stock prices and the percentage year to date price movement based on the last traded prices. Dividends that are paid or are due to be paid and yields for each company are shown in the Main and Junior Markets’ daily report charts, along with the closing volume of the highest bid and the lowest offer for each company.
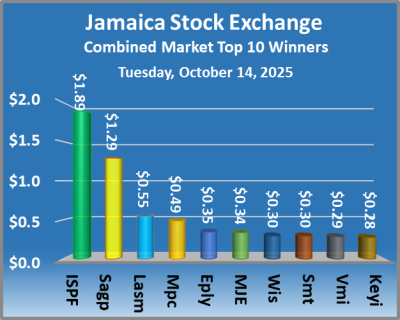 At the close of the market, the JSE Combined Market Index increased 543.37 points to 332,226.74, the All Jamaican Composite Index fell 809.11 points to 366,588.27, the JSE Main Index climbed 411.21 points to 322,286.12, the Junior Market Index popped 21.11 points to finish at 3,355.01 and the JSE USD Market Index gained 2.10 points to 193.57.
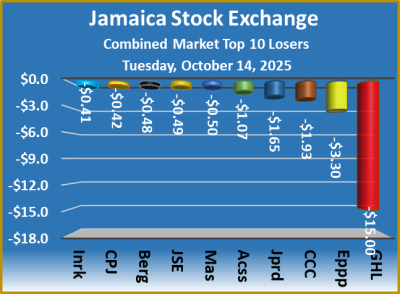 The PE ratio chart covers all ordinary shares listed on the Jamaica Stock Exchange, that are grouped by industry, allowing for easy comparisons within a sector and the overall market. The earnings per share (EPS) and PE ratios are based on 2024 and 2025 actual or projected earnings, excluding any major one time income or expense.
 The chart also shows daily changes in stock prices and the percentage year to date price movement based on the last traded prices. Dividends that are paid or are due to be paid and yields for each company are shown in the Main and Junior Markets’ daily report charts, along with the closing volume of the highest bid and the lowest offer for each company.
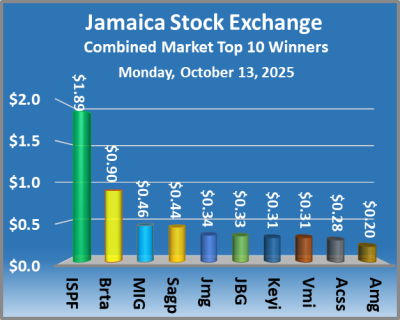 At the close of the market, the JSE Combined Market Index skidded 543.37 points to close at 31,683.37, the All Jamaican Composite Index rose 809.11 points to finish at 367,397.38, the JSE Main Index skidded 411.21 points to 321,874.91, the Junior Market Index dropped 21.11 points to 3,333.90 and the JSE USD Market Index slipped 2.10 points to settle at 191.47.
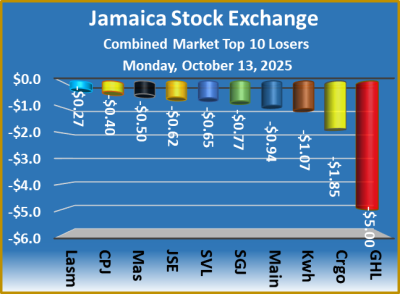 The market’s PE ratio, the most popular measure used to value stocks, ended at 13.3 based on 2025-26 earnings and 15 based on 2024 historical earnings. The ICInsider.com PE ratio chart and the other more detailed daily charts provide regularly updated information to help in investment decision-making. The PE ratio chart covers all ordinary shares that are listed on the Jamaica Stock Exchange, grouped by industry, allowing for easy comparisons within a sector and the overall market. The earnings per share (EPS) and PE ratios are based on 2024 and 2025 actual or projected earnings, excluding any major one time income or expense.
 The net asset value of each company is incorporated into the chart. Investors can use this measure in assessing stock values. The chart also shows daily changes in stock prices and the percentage year to date price movement based on the last traded prices. Dividends that are paid or are due to be paid and yields for each company are shown in the Main and Junior Markets’ daily report charts, along with the closing volume of the highest bid and the lowest offer for each company.
 The market closed with an exchange of a mere 16,150 shares for a measly US$433, with a plunge from 511,073 stocks at US$25,145 on Thursday.
 At the close of the market, Productive Business Solutions slipped 1 cent to finish at 73 US cents with a mere 3 shares being traded, Sygnus Credit Investments ended at 7.78 US cents with investors dealing in 58 units and Transjamaican Highway increased 0.09 of one cent to 2.64 US cents with 16,089 shares crossing the market.
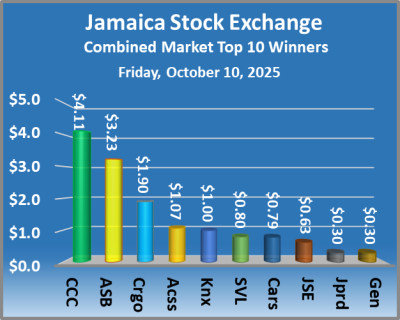 At the close of the market, the JSE Combined Market Index rose 293.56 points to 332,226.74, the All Jamaican Composite Index declined 878.07 points to wrap up trading at 366,588.27, the JSE Main Index gained 289.97 points to end at 322,286.12, the Junior Market Index popped 2.27 points to finish at 3,355.01 and the JSE USD Market Index rallied 4.77 points to finish at 193.57.
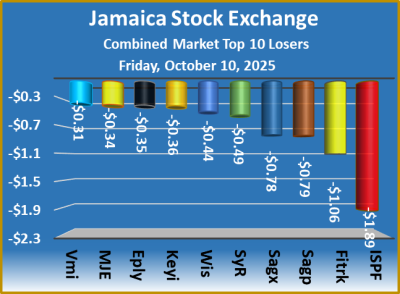 The market’s PE ratio, the most popular measure used to value stocks, ended at 13.2 based on 2025-26 earnings and .15 based on 2024-25 historical earnings. The ICInsider.com PE ratio chart and the other detailed daily charts provide on going updated information to help in decision-making. The PE ratio chart covers all of the ordinary shares listed on the Jamaica Stock Exchange, grouped by industry, allowing for easy comparisons within a sector and the overall market. The earnings per share (EPS) and PE ratios are based on 2024 and 2025 actual or projected earnings, excluding any major one time income or expense.
 The net asset value of each company is incorporated into the chart. Investors can use this measure in assessing stock values. The chart also shows daily changes in stock prices and the percentage year to date price movement based on the last traded prices. Dividends that are paid or are due to be paid and yields for each company are shown in the Main and Junior Markets’ daily report charts, along with the closing volume of the highest bid and the lowest offer for each company.
 The market closed with an exchange of 511,073 shares for US$25,145, jumping from 299,306 stocks at US$9,514 on Wednesday.
 Proven Investments remained at 10 US cents with 159,490 shares crossing the market, Sterling Investments slipped 0.1 of a cent to finish at 1.9 US cents with investors swapping 578 stock units, Sygnus Credit Investments ended at 7.78 US cents with 525 shares changing hands. Sygnus Real Estate Finance USD share gained 0.97 of a cent to 6.78 US cents in trading 3,279 units and Transjamaican Highway ended at 2.55 US cents after a transfer of 346,609 stocks.