Stock prices pulled back in trading on Wednesday as investors sought resources to buy into the latest IPO that is priced to bounce and opens on the 12 of this month. The decline in the market is a trend that has been evident in the past with IPOs. In the process all markets declined at the close of trading, with the JSE Combined Index a measure of the overall market, falling 3,124.50 points to 382,246.24.
 Trading ended with 16,659,338 shares changing hands with a value of $115.3 million, versus 19,491,705 shares in the overall market on the prior day, while the JSE USD market ended with the value of stocks traded at US$93,203.
At the close, the All Jamaican Composite Index dropped 3,995.89 points to 420,325.65, the JSE Main Index declined 3,019.85 points to close at 368.855.69 and the JSE USD market Index slipped 2.82 points to 206.27.
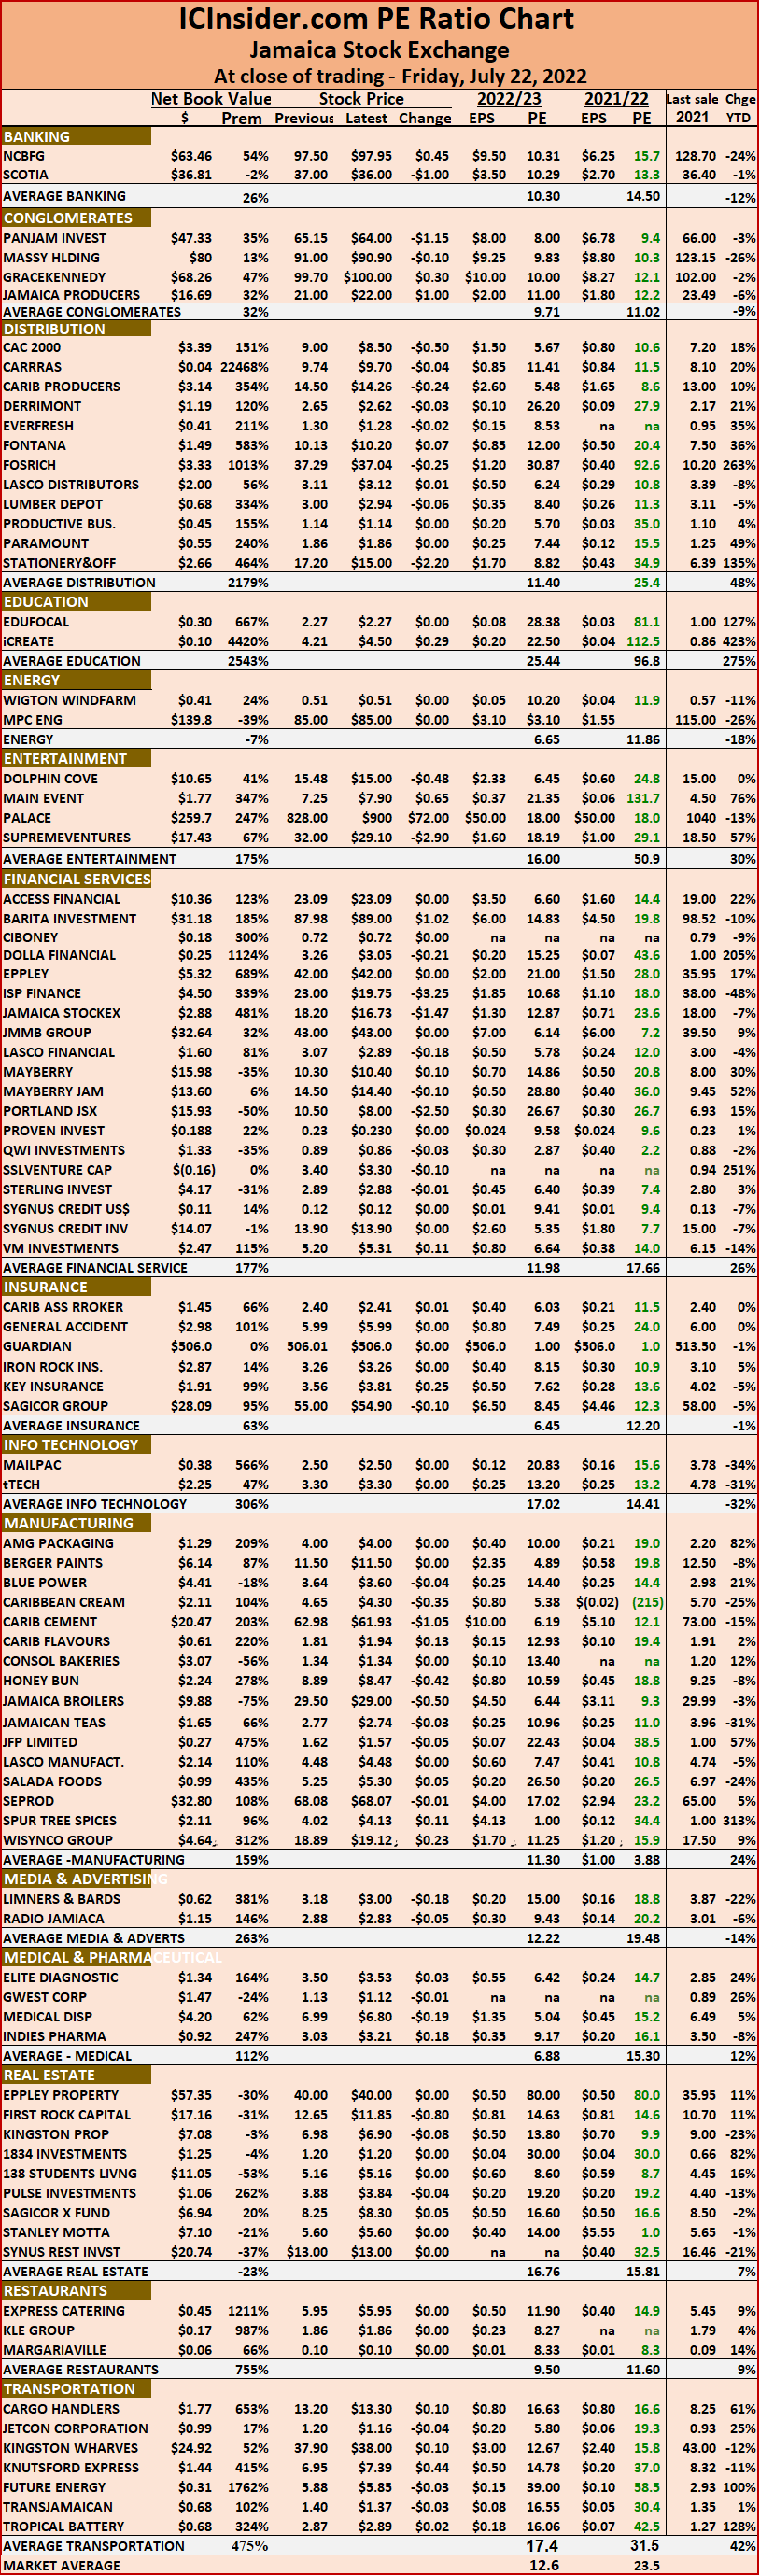
The market’s PE ratio ended at 23.2 based on 2021-22 earnings and 12.4 times those for 2022-23 at the close of trading.
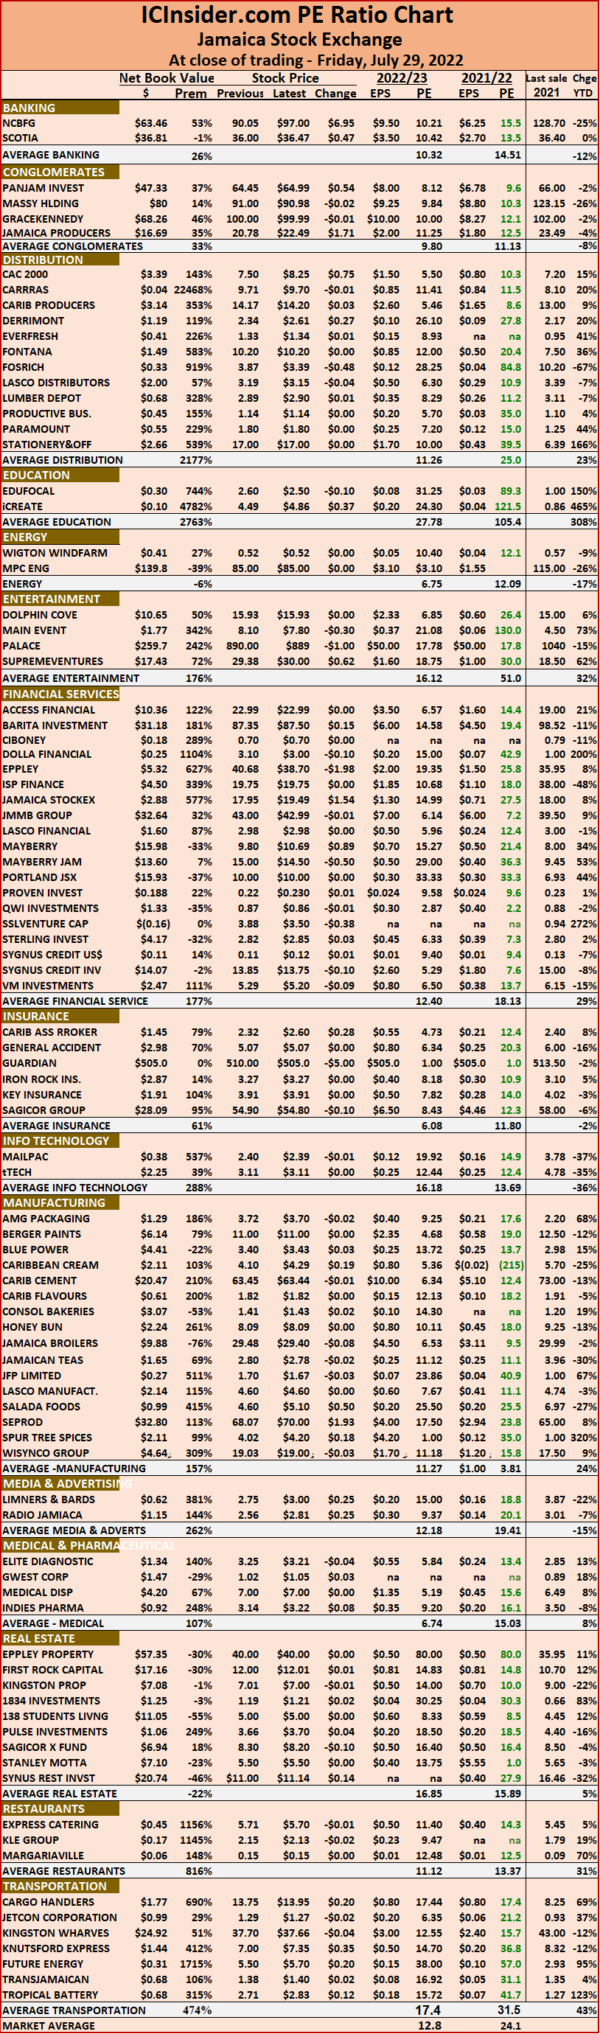
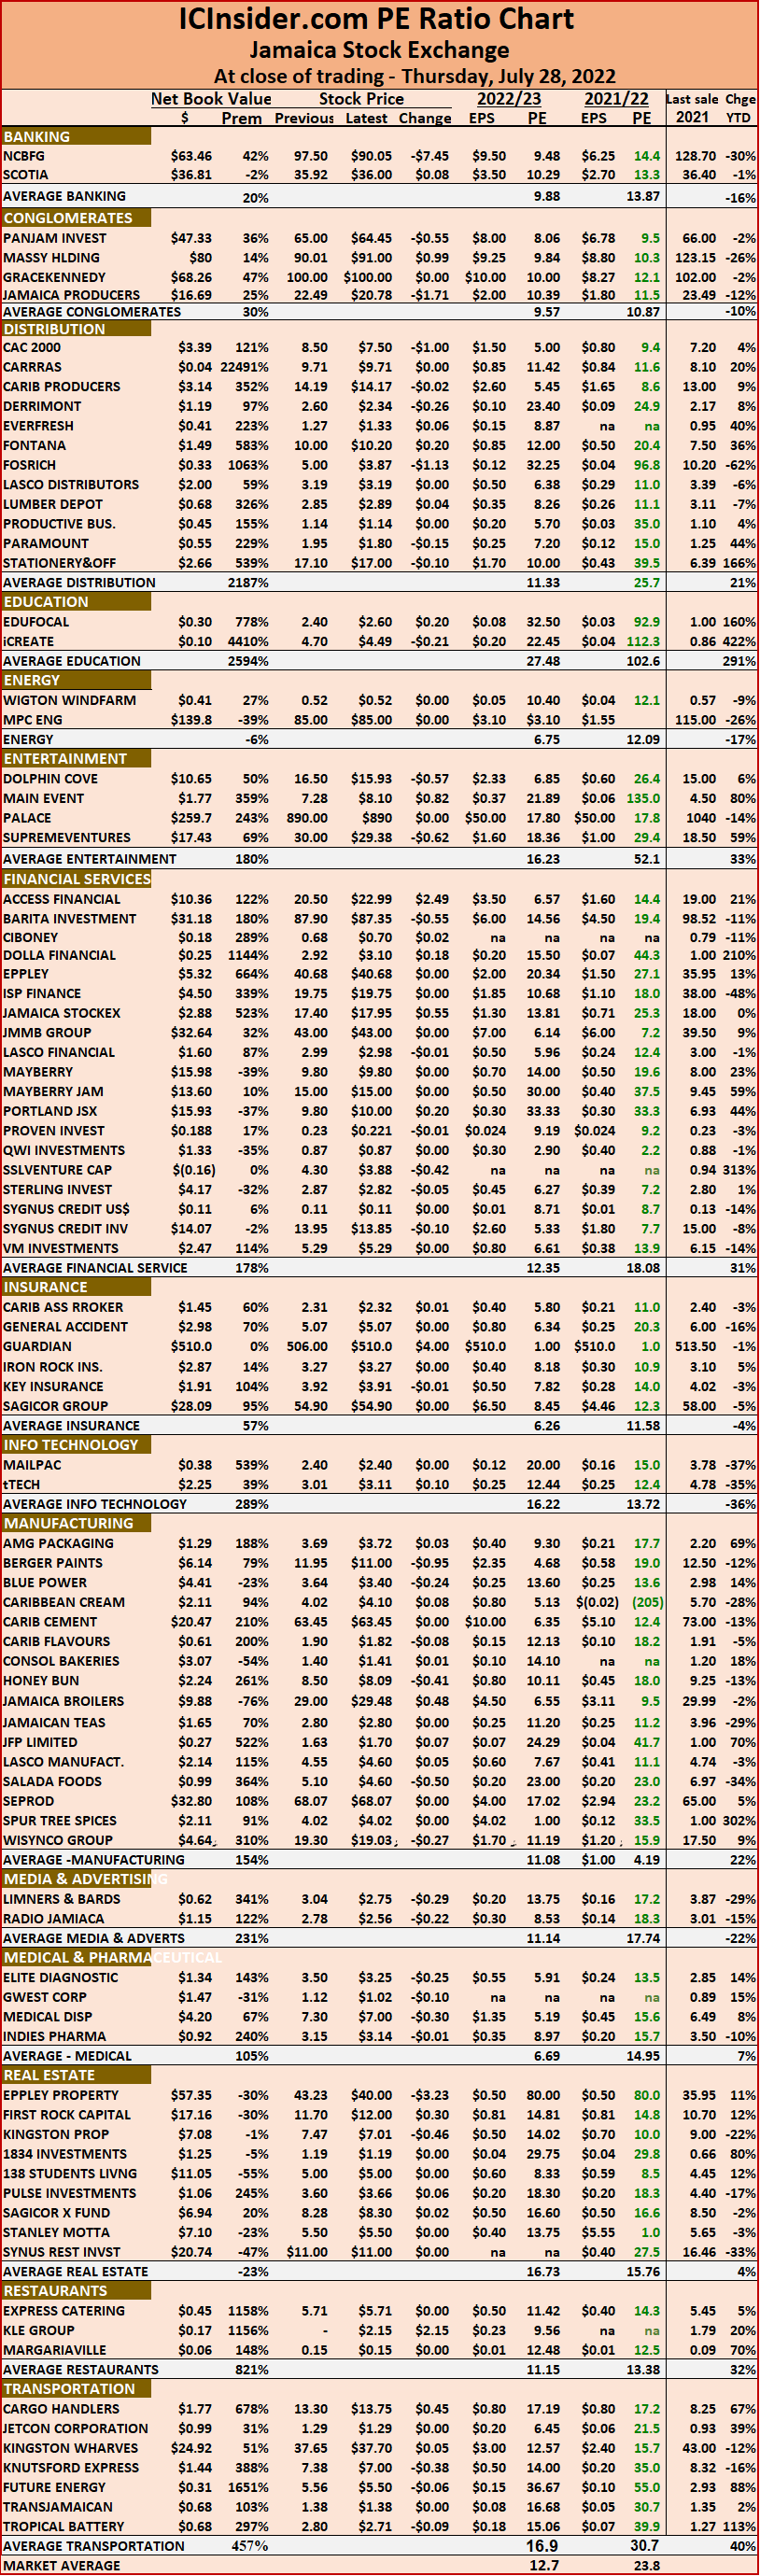
Investors need pertinent information to successfully navigate many investment choices, in the local stock market. The ICInsider.com PE ratio chart and the more detailed daily report charts provide investors with regularly updated information to help decision-making.
Investors should use the chart to help make rational investment decisions by investing in stocks close to the average for the sector and not going too far from it unless there are compelling reasons to do so. This approach helps to remove emotions from investment decisions and put in on fundamentals while at the same time not being too far from the majority of investors. Investors who buy when the price of a stock is close to the average will find that they are not inclined to overpay for a stock.
 The ICInsider.com PE Ratio chart covers all ordinary shares on the Jamaica Stock Exchange. It shows companies grouped on an industry basis, allowing easy comparisons between the same sector companies and the overall market.
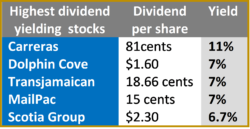
The net asset value of each company is reported as a guide to assess the value of stocks based on this measure quickly. The chart also shows daily changes in stock prices and the percentage year to date price movement based on the last traded prices. Dividends payable and yields for each company are shown in the Main and Junior Markets’ daily report charts that show the closing volume for the bids and offers.
The EPS & PE ratios are based on 2021 and 2022 actual or projected earnings, excluding major one off items. The PE Ratio is the most popular measure used to determine the value of stocks.
Is the new IPO sucking funds from the market?
JSE Main Market in big fall
JSE Main Market stocks gave up much ground on the first trading day of August and the Junior Market index slipped moderately as the volume and value of stocks trading in the overall market dipped on Tuesday and resulting in the JSE Combined Index a measure of the overall market, falling 3,695.18 points to 385,370.74.
 Trading ended, with 19,491,705 shares changing hands well down on Friday’s 41,017,992 shares changing hands in the overall market, with a value of $99.7 million, while the JSE USD market ended with the value of stocks traded at US$33,140.
At the close, the All Jamaican Composite Index dropped 5,179.08 points to 424,321.54, the JSE Main Index declined 3,817.87 points to close at 371,875.54 and the JSE USD market Index slipped 0.79 points to 209.09.
The market’s PE ratio ended at 23.2 based on 2021-22 earnings and 12.4 times those for 2022-23 at the close of trading.
Investors need pertinent information to successfully navigate many investment choices, in the local stock market. The ICInsider.com PE ratio chart and the more detailed daily report charts provide investors with regularly updated information to help decision-making.
Investors should use the chart to help make rational investment decisions by investing in stocks close to the average for the sector and not going too far from it unless there are compelling reasons to do so. This approach helps to remove emotions from investment decisions and put in on fundamentals while at the same time not being too far from the majority of investors. Investors who buy when the price of a stock is close to the average will find that they are not inclined to overpay for a stock.
 The ICInsider.com PE Ratio chart covers all ordinary shares on the Jamaica Stock Exchange. It shows companies grouped on an industry basis, allowing easy comparisons between the same sector companies and the overall market.
The net asset value of each company is reported as a guide to assess the value of stocks based on this measure quickly. The chart also shows daily changes in stock prices and the percentage year to date price movement based on the last traded prices. Dividends payable and yields for each company are shown in the Main and Junior Markets’ daily report charts that show the closing volume for the bids and offers.
The EPS & PE ratios are based on 2021 and 2022 actual or projected earnings, excluding major one off items. The PE Ratio is the most popular measure used to determine the value of stocks.
Fosrich pressures Junior Market for a third day
The Fosrich stock price suffered more declines in trading on Friday as investors poured more stocks into the market as they reduced their holdings following the ten for one stock split and dropped 48 cents to $3.39. At the close, the Junior Market index was down 57.37 points to close at 4,202.31, but the other major indices rose, helping the JSE Combined Index a measure of the overall market, to rise 448.77 points to 389,065.92.
 Trading ended, with 41,017,992 shares changing hands well over Thursday’s 22,007,277 shares changing hands in the overall market, with a value of $222.7 million, while the JSE USD market ended with the value of stocks traded at US$33,791.
At the close, the All Jamaican Composite Index climbed 1,802.80 points to 429,500.62, the JSE Main Index rose 1,031.73 points to 375,693.41 and the JSE USD market Index popped 3.86 points to 209.88.
The market’s PE ratio ended at 24 based on 2021-22 earnings and 12.7 times those for 2022-23 at the close of trading.
Investors need pertinent information to successfully navigate many investment choices, in the local stock market. The ICInsider.com PE ratio chart and the more detailed daily report charts provide investors with regularly updated information to help decision-making.
Investors should use the chart to help make rational investment decisions by investing in stocks close to the average for the sector and not going too far from it unless there are compelling reasons to do so. This approach helps to remove emotions from investment decisions and put in on fundamentals while at the same time not being too far from the majority of investors. Investors who buy when the price of a stock is close to the average will find that they are not inclined to overpay for a stock.
The ICInsider.com PE Ratio chart covers all ordinary shares on the Jamaica Stock Exchange. It shows companies grouped on an industry basis, allowing easy comparisons between the same sector companies and the overall market.
 The net asset value of each company is reported as a guide to assess the value of stocks based on this measure quickly. The chart also shows daily changes in stock prices and the percentage year to date price movement based on the last traded prices. Dividends payable and yields for each company are shown in the Main and Junior Markets’ daily report charts that show the closing volume for the bids and offers.
The EPS & PE ratios are based on 2021 and 2022 actual or projected earnings, excluding major one off items. The PE Ratio is the most popular measure used to determine the value of stocks.
Fosrich pushes Junior Market down
The Fosrich stock split that showed up in investors account today released a flood of offers in the market in the process pushed the price back to the pre-split levels shortly after trading opened resulting in 5.45 million shares trading, with the day’s high of $4.40. The effect of the fall helped to push the Junior Market index down 129.21 points to close at 4,259.68. The fall of the Junior Market helped in dropping the JSE Combined Index a measure of the overall market, slipping 2,945.66 points to 388,617.15.

Mark Croskery speaking to Cecil Foster, Managing director of FosRich.
The market ended, with 22,007,277 shares trading with a value of $121.9 million, while the JSE USD market ended with the value of stocks traded at US$21,357.
At the close the All Jamaican Composite Index lost 2,610.73 points to end at 427,697.78, the JSE Main Index fell 1,907.55 points to close at 374,661.68 and the JSE USD market Index popped 2.09 points to 206.02.
The market’s PE ratio ended at 23.8 based on 2021-22 earnings and 12.7 times those for 2022-23 at the close of trading.
Investors need pertinent information to successfully navigate many investment choices, in the local stock market. The ICInsider.com PE ratio chart and the more detailed daily report charts provide investors with regularly updated information to help decision-making.
Investors should use the chart to help make rational investment decisions by investing in stocks close to the average for the sector and not going too far from it unless there are compelling reasons to do so. This approach helps to remove emotions from investment decisions and put in on fundamentals while at the same time not being too far from the majority of investors. Investors who buy when the price of a stock is close to the average will find that they are not inclined to overpay for a stock.
 The ICInsider.com PE Ratio chart covers all ordinary shares on the Jamaica Stock Exchange. It shows companies grouped on an industry basis, allowing easy comparisons between the same sector companies and the overall market.
The net asset value of each company is reported as a guide to assess the value of stocks based on this measure quickly. The chart also shows daily changes in stock prices and the percentage year to date price movement based on the last traded prices. Dividends payable and yields for each company are shown in the Main and Junior Markets’ daily report charts that show the closing volume for the bids and offers.
The EPS & PE ratios are based on 2021 and 2022 actual or projected earnings, excluding major one off items. The PE Ratio is the most popular measure used to determine the value of stocks.
Fosrich pushes trading higher on Wednesday
The Junior Market listed Fosrich stock traded at a new high of $5.42 on Wednesday following the 10 to one split but it closed at $5 after investors swapped 4 million units of the shares as the price hike helped push the Junior Market up 46.92 points to close at 4,388.89 and helping to cushion the fall of main market stocks with the JSE Combined Index a measure of the overall market, slipping 138.28 points to 391,562.81.

FosRich now trading post stock split
A total of 22,617,580 shares changed hands in the overall market, with a value of $201.9 million, while the value of stocks traded in the JSE USD market ended at US$37,897.
The All Jamaican Composite Index dipped 816.34 points to 430,308.55, the JSE Main Index fell 599.23 points to 376,569.23 and the JSE USD market Index rose 1.93 points to 208.11.
The market’s PE ratio ended at 24 based on 2021-22 earnings and 12.8 times those for 2022-23 at the close of trading.
Investors need pertinent information to successfully navigate many investment choices, in the local stock market. The ICInsider.com PE ratio chart and the more detailed daily report charts provide investors with regularly updated information to help decision-making.
Investors should use the chart to help make rational investment decisions by investing in stocks close to the average for the sector and not going too far from it unless there are compelling reasons to do so. This approach helps to remove emotions from investment decisions and put in on fundamentals while at the same time not being too far from the majority of investors. Investors who buy when the price of a stock is close to the average will find that they are not inclined to overpay for a stock.
 The ICInsider.com PE Ratio chart covers all ordinary shares on the Jamaica Stock Exchange. It shows companies grouped on an industry basis, allowing easy comparisons between the same sector companies and the overall market.
The net asset value of each company is reported as a guide to assess the value of stocks based on this measure quickly. The chart also shows daily changes in stock prices and the percentage year to date price movement based on the last traded prices. Dividends payable and yields for each company are shown in the Main and Junior Markets’ daily report charts that show the closing volume for the bids and offers.
The EPS & PE ratios are based on 2021 and 2022 actual or projected earnings, excluding major one off items. The PE Ratio is the most popular measure used to determine the value of stocks.
Fosrich pushes Junior Market up 145 points.
The Junior Market listed Fosrich stock traded at its 10 to one split price and ended at a record high of $4.38 for a rise of 73 cents on Tuesday helping to push the Junior Market up 145.29 points to close at 4,341.97 and helping to push the JSE Combined Index a measure of the overall market, to jump 3,589.47 points to 391,701.09.

Fosrich traded at 10 to 1 stock split price on Tuesday.
The Main Market rose but the JSEUSD Markets slipped at the close of trading on the Jamaica Stock Exchange.
Trading ended, with 19,335,897 shares changing hands in the overall market, with a value of $170.8 million, while the JSE USD market ended with the value of stocks traded at US$42,336.
The All Jamaican Composite Index popped 3,348.28 points to close at 431,124.89, the JSE Main Index rose 2,441.47 points to close at 377,168.46 and the JSE USD market Index dipped 2.55 points to 206.18.
The market’s PE ratio ended at 24.1 based on 2021-22 earnings and 12.8 times those for 2022-23 at the close of trading.
Investors need pertinent information to successfully navigate many investment choices, in the local stock market. The ICInsider.com PE ratio chart and the more detailed daily report charts provide investors with regularly updated information to help decision-making.
Investors should use the chart to help make rational investment decisions by investing in stocks close to the average for the sector and not going too far from it unless there are compelling reasons to do so. This approach helps to remove emotions from investment decisions and put in on fundamentals while at the same time not being too far from the majority of investors. Investors who buy when the price of a stock is close to the average will find that they are not inclined to overpay for a stock.
 The ICInsider.com PE Ratio chart covers all ordinary shares on the Jamaica Stock Exchange. It shows companies grouped on an industry basis, allowing easy comparisons between the same sector companies and the overall market.
The net asset value of each company is reported as a guide to assess the value of stocks based on this measure quickly. The chart also shows daily changes in stock prices and the percentage year to date price movement based on the last traded prices. Dividends payable and yields for each company are shown in the Main and Junior Markets’ daily report charts that show the closing volume for the bids and offers.
The EPS & PE ratios are based on 2021 and 2022 actual or projected earnings, excluding major one off items. The PE Ratio is the most popular measure used to determine the value of stocks.
112 points drop for Junior Market
Junior Market stock plunged more than 100 points on Monday while the Main Market fell but the JSEUSD Markets eked out a modest rise at the close of trading on the Jamaica Stock Exchange, leading the JSE Combined Index a measure of the overall market, to dip 2,168.29 points to 388,111.62.
A total of 13,170,179 shares changing hands in the overall market, with a value of $108.9 million, while the JSE USD market ended with the value of stocks traded at US$3,207.
At the close, the All Jamaican Composite Index dipped 2,082.02 points to 427,776.614, the JSE Main Index declined 1,237.67 points to close at 374,726.99, the Junior Market dived 112.43 points to 4,196.68 and the JSE USD market Index rose 2.38 points to 208.73.
The market’s PE ratio ended at 23.3 based on 2021-22 earnings and 12.5 times those for 2022-23 at the close of trading.
Investors need pertinent information to successfully navigate many investment choices, in the local stock market. The ICInsider.com PE ratio chart and the more detailed daily report charts provide investors with regularly updated information to help decision-making.
Investors should use the chart to help make rational investment decisions by investing in stocks close to the average for the sector and not going too far from it unless there are compelling reasons to do so. This approach helps to remove emotions from investment decisions and put in on fundamentals while at the same time not being too far from the majority of investors. Investors who buy when the price of a stock is close to the average will find that they are not inclined to overpay for a stock.
 The ICInsider.com PE Ratio chart covers all ordinary shares on the Jamaica Stock Exchange. It shows companies grouped on an industry basis, allowing easy comparisons between the same sector companies and the overall market.
The net asset value of each company is reported as a guide to assess the value of stocks based on this measure quickly. The chart also shows daily changes in stock prices and the percentage year to date price movement based on the last traded prices. Dividends payable and yields for each company are shown in the Main and Junior Markets’ daily report charts that show the closing volume for the bids and offers.
The EPS & PE ratios are based on 2021 and 2022 actual or projected earnings, excluding major one off items. The PE Ratio is the most popular measure used to determine the value of stocks.
Big fall for JSE Main Market as Juniors slip
Stocks fell on the Jamaica Stock Exchange market on Friday with the Main Market indices suffering big losses while the Junior and JSEUSD Markets closed marginally lower. The JSE Combined Index a measure of the overall market, dived 3,183.27 points to 390,279.91 as a wide number of Main Market stocks dropped.
 Trading ended, with 22,466,609 shares changing hands in the overall market, with a value of $162.1 million, while the JSE USD market ended with the value of stocks traded at US$24,741.
At the close, the All Jamaican Composite Index dropped 4,182.94 points to 429,858.63, the JSE Main Index declined 3,266.08 points to close at 375,964.46, the Junior Market lost 14.40 points to 4,309.11 and the JSE USD market Index dipped 1.71 points to 206.35.
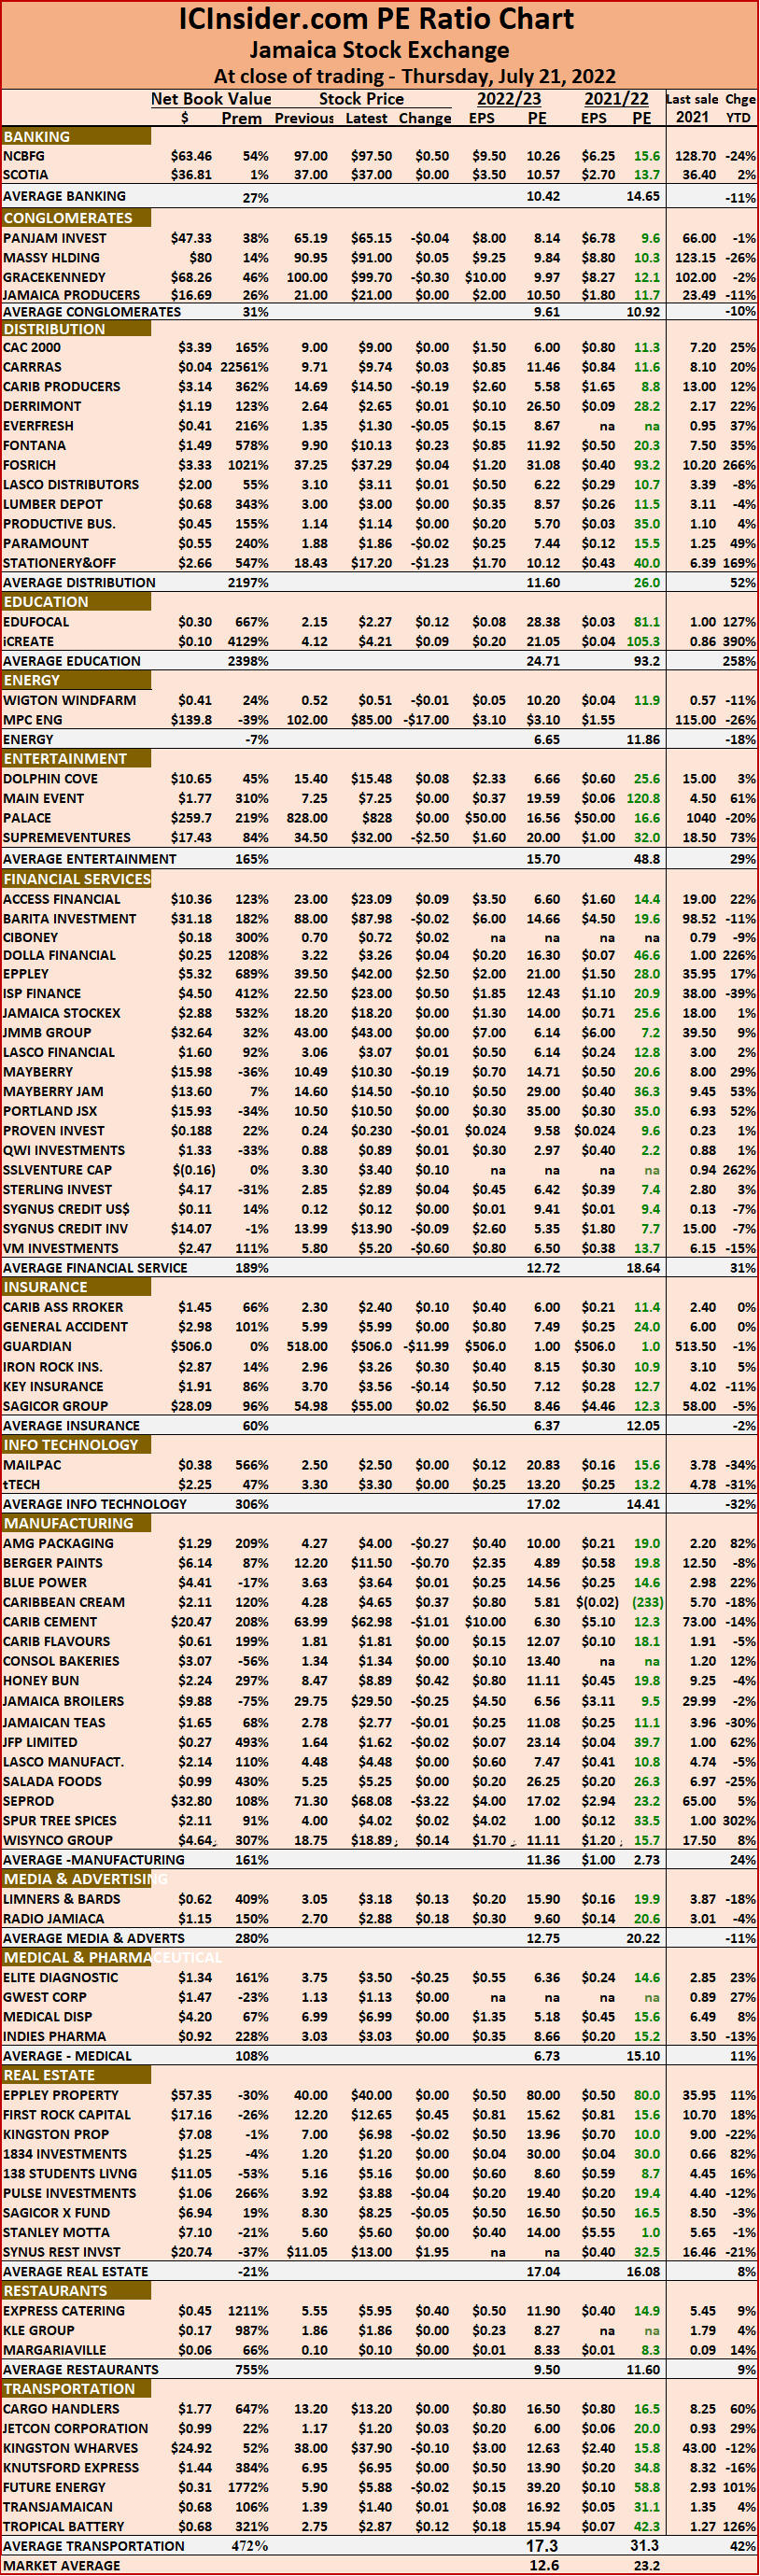
The market’s PE ratio ended at 23.5 based on 2021-22 earnings and 12.6 times those for 2022-23 at the close of trading.
Investors need pertinent information to successfully navigate many investment choices, in the local stock market. The ICInsider.com PE ratio chart and the more detailed daily report charts provide investors with regularly updated information to help decision-making.
Investors should use the chart to help make rational investment decisions by investing in stocks close to the average for the sector and not going too far from it unless there are compelling reasons to do so. This approach helps to remove emotions from investment decisions and put in on fundamentals while at the same time not being too far from the majority of investors. Investors who buy when the price of a stock is close to the average will find that they are not inclined to overpay for a stock.
 The ICInsider.com PE Ratio chart covers all ordinary shares on the Jamaica Stock Exchange. It shows companies grouped on an industry basis, allowing easy comparisons between the same sector companies and the overall market.
The net asset value of each company is reported as a guide to assess the value of stocks based on this measure quickly. The chart also shows daily changes in stock prices and the percentage year to date price movement based on the last traded prices. Dividends payable and yields for each company are shown in the Main and Junior Markets’ daily report charts that show the closing volume for the bids and offers.
The EPS & PE ratios are based on 2021 and 2022 actual or projected earnings, excluding major one off items. The PE Ratio is the most popular measure used to determine the value of stocks.
JSE Main Market fell, Junior Market rises
The Jamaica Stock Exchange main market and the JSE USD market closed lower on Wednesday with just modest changes to the market indices while the Junior Market closed higher. The JSE Combined Index a measure of the overall market, fell 1,084.11 points to 393,463.18.
Trading ended, with 18,447,686 shares changing hands in the overall market, with a value of $105.14 million, while the JSE USD market ended with the value of stocks traded at US$11,046.
At the close, the All Jamaican Composite Index dipped 1,348.21 points to 434,041.57, the JSE Main Index declined 1,439.56 points to close at 379,230.74, the Junior Market climbed 29.12 points to 4,323.51 and the JSE USD market Index dipped 3.17 points to 208.06.
The market’s PE ratio ended at 23.2 based on 2021-22 earnings and 12.6 times those for 2022-23 at the close of trading.
Investors need pertinent information to successfully navigate many investment choices, in the local stock market. The ICInsider.com PE ratio chart and the more detailed daily report charts provide investors with regularly updated information to help decision-making.
Investors should use the chart to help make rational investment decisions by investing in stocks close to the average for the sector and not going too far from it unless there are compelling reasons to do so. This approach helps to remove emotions from investment decisions and put in on fundamentals while at the same time not being too far from the majority of investors. Investors who buy when the price of a stock is close to the average will find that they are not inclined to overpay for a stock.
 The ICInsider.com PE Ratio chart covers all ordinary shares on the Jamaica Stock Exchange. It shows companies grouped on an industry basis, allowing easy comparisons between the same sector companies and the overall market.
The net asset value of each company is reported as a guide to assess the value of stocks based on this measure quickly. The chart also shows daily changes in stock prices and the percentage year to date price movement based on the last traded prices. Dividends payable and yields for each company are shown in the Main and Junior Markets’ daily report charts that show the closing volume for the bids and offers.
The EPS & PE ratios are based on 2021 and 2022 actual or projected earnings, excluding major one off items. The PE Ratio is the most popular measure used to determine the value of stocks.
Moderate changes to JSE market value
The Jamaica Stock Exchange closed on Tuesday with just modest changes to the market indices as trading levels declined from that on Tuesday and closed with the JSE Combined Index rising just 30.44 points to 394,547.29.
 Trading ended, with 18,618,446 shares changing hands in the overall market, with a value of $100.4 million, while the JSE USD market ended with the value of stocks traded at US$5,437.
At the close, the All Jamaican Composite Index dipped 100.26 points to 435,389.78, the JSE Main Index rose 34.28 points to close at 380,670.30, the Junior Market slipped 0.17 points to 4,294.39 and the JSE USD market Index dipped 0.99 points to 211.23.
The market’s PE ratio ended at 23 based on 2021-22 earnings and 12.5 times those for 2022-23 at the close of trading.
Investors need pertinent information to successfully navigate many investment choices, in the local stock market. The ICInsider.com PE ratio chart and the more detailed daily report charts provide investors with regularly updated information to help decision-making.
Investors should use the chart to help make rational investment decisions by investing in stocks close to the average for the sector and not going too far from it unless there are compelling reasons to do so. This approach helps to remove emotions from investment decisions and put in on fundamentals while at the same time not being too far from the majority of investors. Investors who buy when the price of a stock is close to the average will find that they are not inclined to overpay for a stock.
 The ICInsider.com PE Ratio chart covers all ordinary shares on the Jamaica Stock Exchange. It shows companies grouped on an industry basis, allowing easy comparisons between the same sector companies and the overall market.
The net asset value of each company is reported as a guide to assess the value of stocks based on this measure quickly. The chart also shows daily changes in stock prices and the percentage year to date price movement based on the last traded prices. Dividends payable and yields for each company are shown in the Main and Junior Markets’ daily report charts that show the closing volume for the bids and offers.
The EPS & PE ratios are based on 2021 and 2022 actual or projected earnings, excluding major one off items. The PE Ratio is the most popular measure used to determine the value of stocks.