Jamaica’s stock market in a good place

The stock market cannot be looked at in isolation from what is taking place in the wider economy, John Jackson said in an address he made recently to the Kiwanis Club of Kingston on the state of the Jamaican Stock Market.  There are many positives occurring that could have a good impact on stocks and the stock market but there are a few negatives taking place currently he stated.

Jackson went on to list a series of positives and negatives about the market and the economy. The economy is bouncing back from the major dislocations caused by the closure of the country’s borders in March 2020, resulting in the closure of the important tourism sector and billion dollar loss of inflows. That seems to be behind us now, although not fully based on traffic passing through the two international airports that were lagging behind 2020 and 2019 up to February this year, there are sounds that there may be big improvements in the March numbers. Remittances had record increases, well over the inflows for 2019 in both 2020 and 2021, with the latter up by $1.1 billion over 2019 flows to hit the US$3.5 billion mark.
Employment is at record levels, bettering the pre-pandemic high. The tourism industry was not at full employment when those numbers were compiled, so the situation will be even better when the next set of figures are released up to March, this year. The construction sector is enjoying record performance and absorbing quite a bit of the previously unemployed but higher interest rates could slow down the growth in the sector. There is continued expansion in the BPO sector that is employing a large number of Jamaicans and pulling US dollars into our coffers.

Inflation has risen sharply worldwide and Jamaica has not been spared the impact, resulting in the Bank of Jamaica hiking interest rates sharply from an artificial low up to August last year.
On the positive side, central government has reduced debt to GDP below 100 percent and that is freeing up resources to spend on badly needed capital improvement as well as in social areas that were neglected for decades, with a target of 60 percent of GDP by 2026.
Against the above economic developments and the hope that the Ukraine war and inflation will not derail positive economic benefits for Jamaica, the future of the stock market is good, as economic policy favours low interest rates and growth in GDP that will be positive for profits and stock prices. It should be noted that the number of investors has swollen from just fifty thousand to over 200,000 over the past four years. That growth is creating a broader and more liquid market for investors.

Growth in tourism expected in 2019

The Junior Market is at record levels surpassing the record high of 3,665 points in August 2019, since then, the market closed at over 4,200 points but the Main Market continues to lag and is still below the March 2020 level just before the collapse of stock prices.
In the past, investors were pulled into the market only to see it fall out of bed. This time will be different for some time to come due to cutting of the fiscal deficit, with more to come and a vast improvement in the balance of payments. These will allow for more consistency in policies and less volatility in the market. The market is also more diversified with a wider array of choices than in years gone by.
Investors should remember that the two critical factors driving stocks are interest rates and profits. Rising profits and stable interest rates will ultimately drive stock prices higher. The reverse is true. The key is to buy companies with consistent profit growth, as that demonstrates good management.
Profits for most companies released recently have been good with many of the stocks undervalued. Investors need good information to assist them in buying stocks.
Investors who want to buy stocks should favour undervalued stocks and stay away from ones selling well ahead of the average of the market, using the PE ratio as a guide. They should focus on companies that have a good record of consistent growth to make for a successful investment. Use the market data put out by ICInsider.com on earnings, PE ratios, net asset value and dividend payments as a guide in selecting stocks, these are proven to work that is why our Top10 stock selection delivered a 64 percent growth for Junior Market stocks in 2021.
Junior Market record slips Main Market climbs

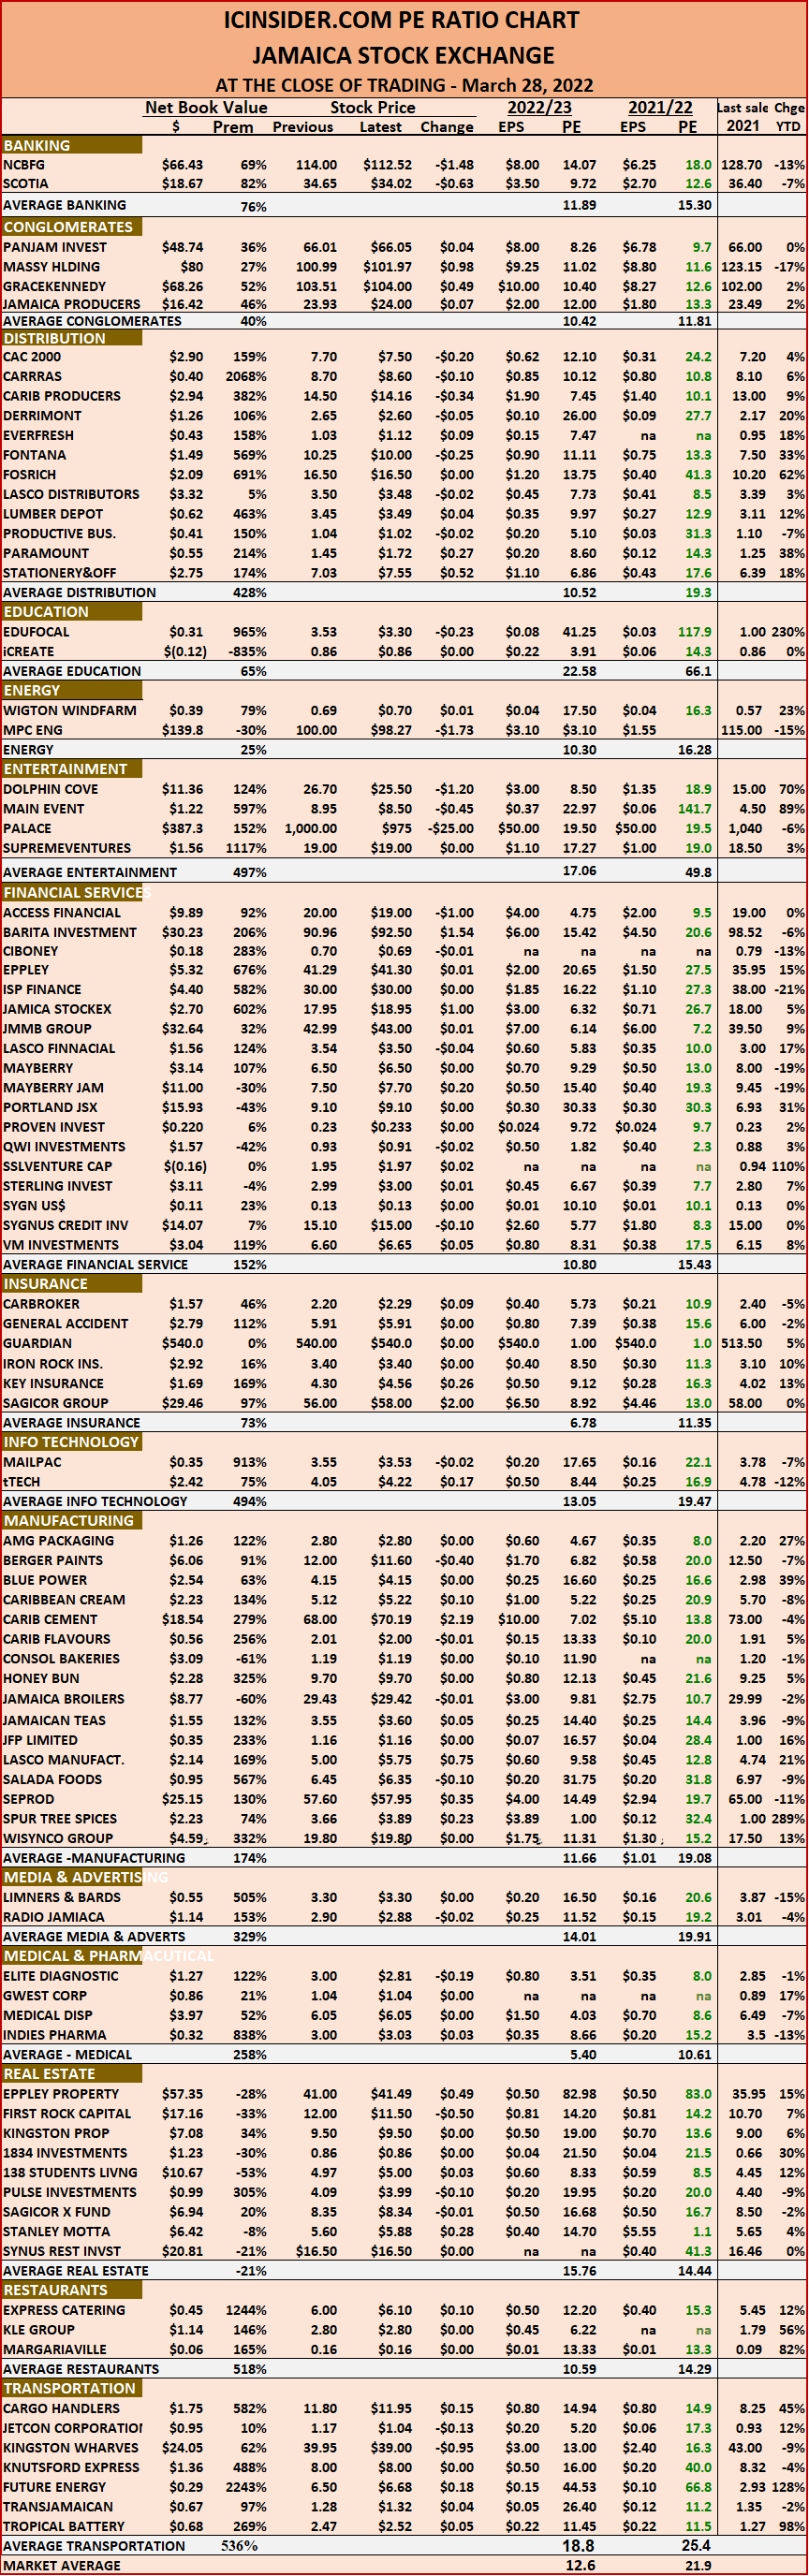
The Jamaica Stock Exchange ended with the Junior Market trading at a new record in the early morning session at 4,236.63 but failed to hold on to close at another record high after slipping 0.42 points to end at 4,205.36.
The Main Market continue to recover from last week’s loss, with, the Combined Index rose 1,215.01 points to close at 400,188.77, the All Jamaican Composite Index rallied 2,588.02 points to 438,336.07 and the JSE Main Index rose 1,301.75 to end at 387,565.71.
The market’s PE ratio ended at 21.9 based on 2021-22 earnings and 12.6 times those for 2022-23 at the close of the Jamaica Stock Exchange.
Investors need a series of measures and pertinent information to successfully navigate the many investment choices in the local stock market. The ICInsider.com PE ratio chart and the more detailed daily report charts provide investors with regularly updated information to help with decision-making.
Investors should make use of the chart to help make rational investment decisions by investing in stocks that are close to the average for the sector and not going too far from it unless there are compelling reasons to do so. This approach helps to take emotions out of the investment decision and put in on fundamentals while at the same time not being too far from the majority of investors. Investors who buy when the price of a stock is close to the average will find that they are not inclined to overpay for a stock.
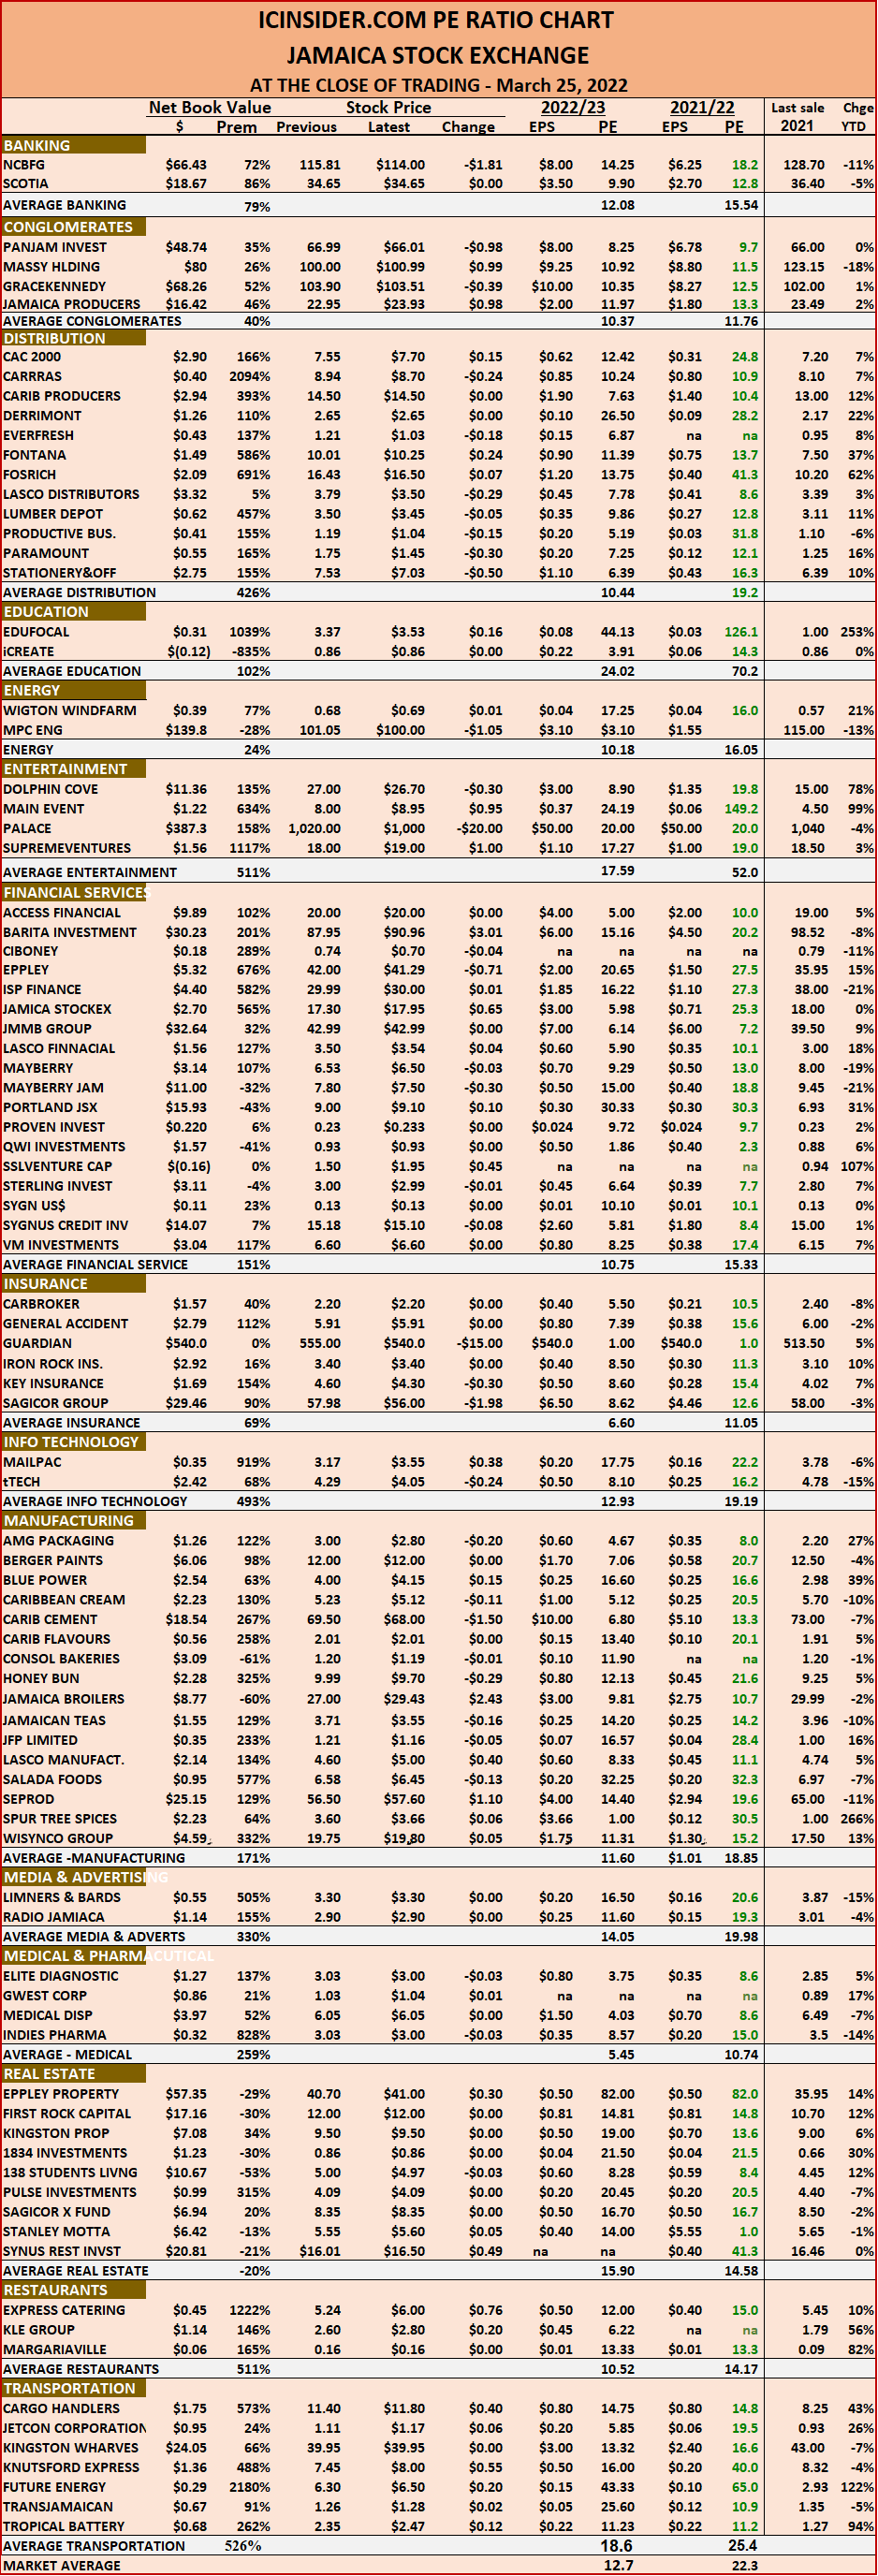
The ICInsider.com PE Ratio chart covers all ordinary shares listed on the Jamaica Stock Exchange. It shows companies grouped on an industry basis, allowing easy comparisons between the same sector companies and the overall market.
The net asset value of each company is reported as a guide to assess the value of stocks based on this measure quickly. The chart also shows daily changes in stock prices and the percentage year to date price movement based on the last traded prices. Dividends payable and yields for each company are shown in the Main and Junior Markets’ daily report charts that show closing volume for the bids and offers.
The EPS & PE ratios are based on 2021 and 2022 actual or projected earnings, excluding major one off items. The PE Ratio is the most popular measure used to determine the value of stocks.

New Junior Market record as Majors rise

The Jamaica Stock Exchange ended the week, with the Junior Market ending at a new record close, having surged 101.72 points to close at 4,205.78 to be up over 22.4 percent for the year to date.  At the same time, the Main Market eked out relatively modest gains as it struggles to break out of the consolidation zone it’s been in for months.
At the close of trading, the Combined Index rose 2,838.62 points to close at 398,973.76, the All Jamaican Composite Index rallied 3,161.89 points to 435,748.05, the JSE Main Index rose 2,067.22 to end at 386,263.96.  
The market’s PE ratio ended at 22.3 based on 2021-22 earnings and 12.7 times those for 2022-23 at the close of the Jamaica Stock Exchange.
Investors need a series of measures and pertinent information to successfully navigate the many investment choices in the local stock market. The ICInsider.com PE ratio chart and the more detailed daily report charts provide investors with regularly updated information to help with decision-making.
Investors should use the chart to help make rational investment decisions by investing in stocks that are close to the average for the sector and not going too far from it unless there are compelling reasons to do so. This approach helps to take emotions out of the investment decision and put in on fundamentals while at the same time not being too far from the majority of investors. Investors who buy when the price of a stock is close to the average will find that they are not inclined to overpay for a stock.

The ICInsider.com PE Ratio chart covers all ordinary shares listed on the Jamaica Stock Exchange. It shows companies grouped on an industry basis, allowing easy comparisons between the same sector companies and the overall market.
The net asset value of each company is reported as a guide to assess the value of stocks based on this measure quickly. The chart also shows daily changes in stock prices and the percentage year to date price movement based on the last traded prices. Dividends payable and yields for each company are shown in the Main and Junior Markets’ daily report charts that show closing volume for the bids and offers.
The EPS & PE ratios are based on 2021 and 2022 actual or projected earnings, excluding major one off items. The PE Ratio is the most popular measure used to determine the value of stocks.

Junior Market at record high on Friday

The Junior Market of the Jamaica Stock exchange is now trading at a new record high of 4,197.38 at 11.40 on Friday, up from 4,104.06 at the close on Thursday, as Express Catering (ECL) climbed to $6, Lasco Manufacturing rose to $5 and Spur Tree Spices hit $3.80.
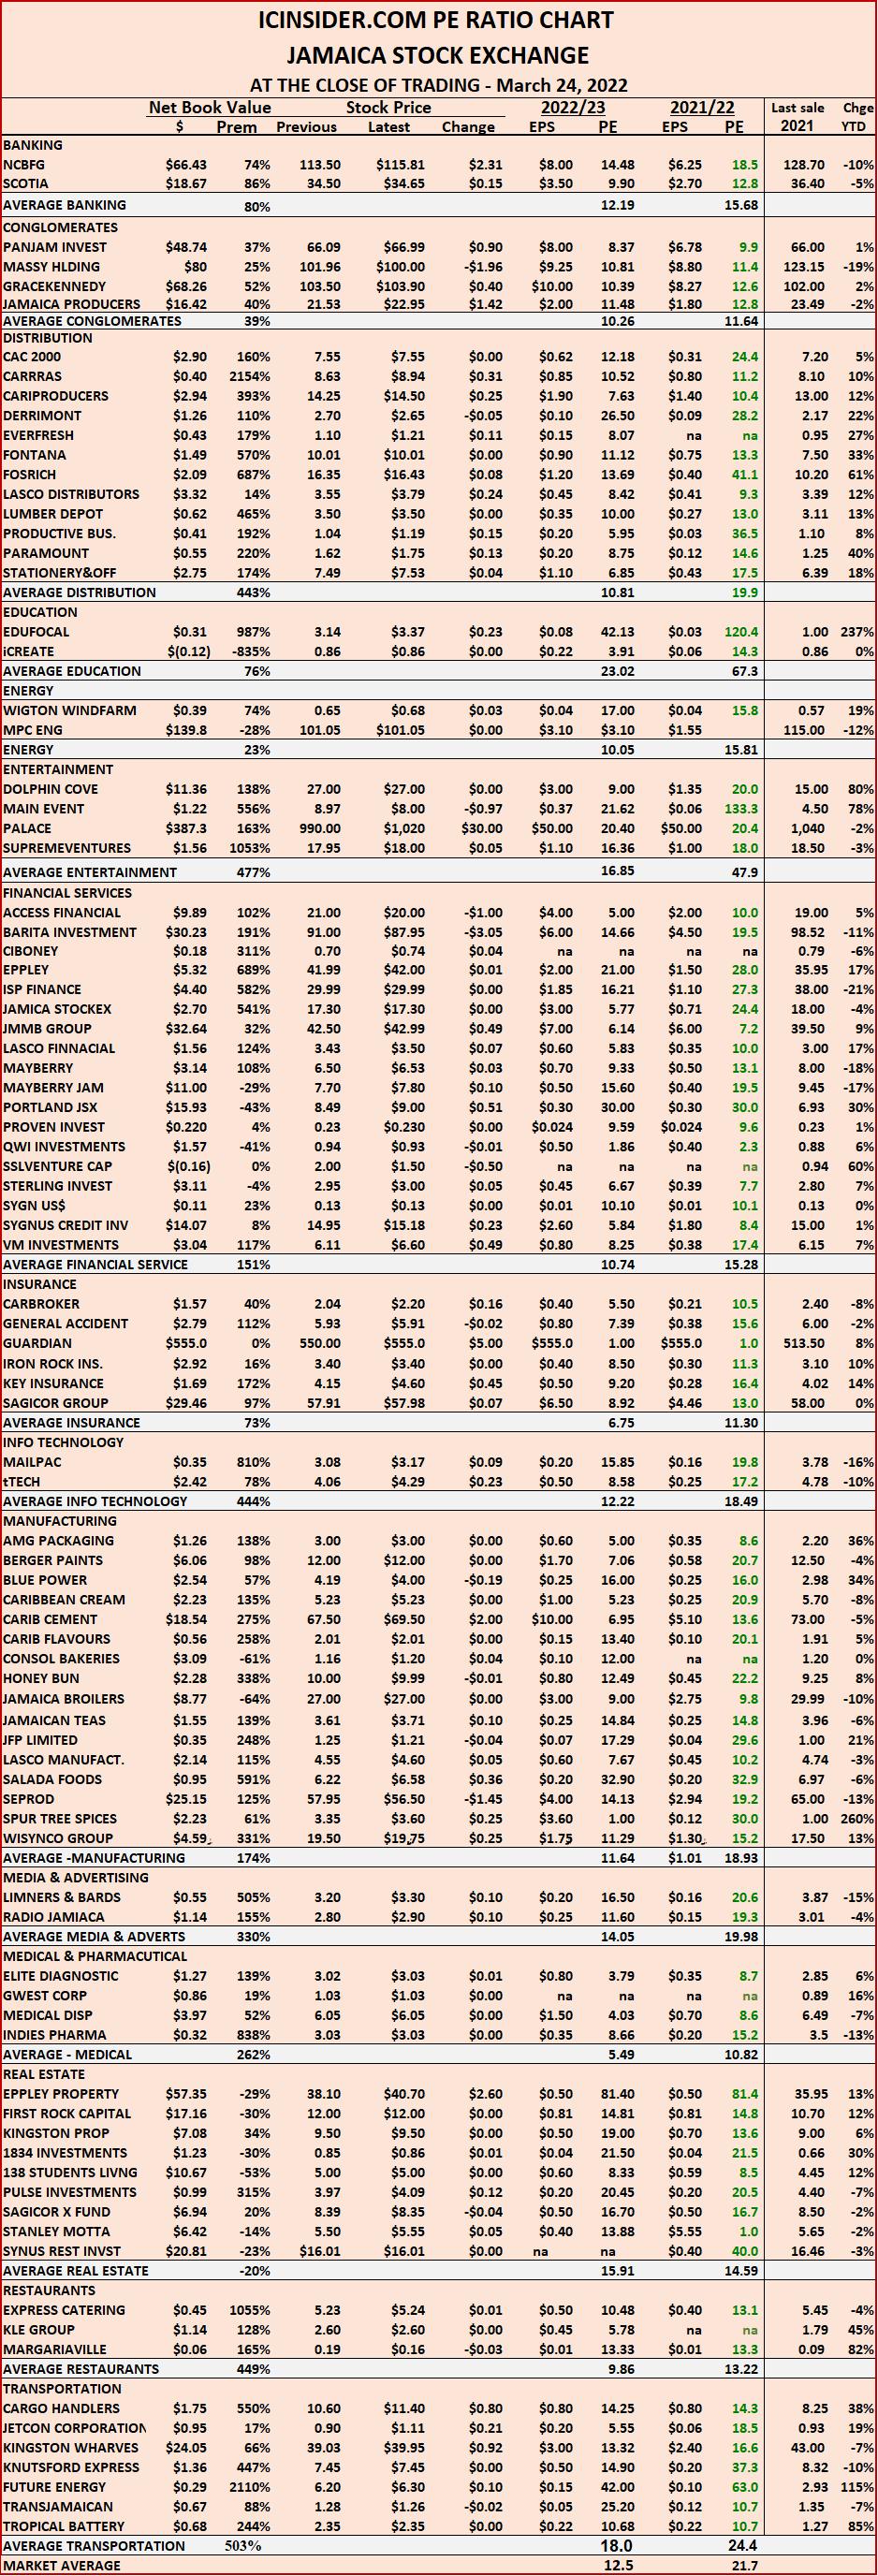
Since then the market pulled back slightly to trade at 4,196.81.
The Junior Market’s previous highest level was reached on Friday, March 4, when it ended at a record closing high of 4,168.16, up 95.60 points for the day after hitting all-time intraday high of 4,185.95 at 11.45 am that morning.
Trading the shares of ECL is suspended for breaching the 15 percent circuit breaker limit. The JSE Main Index is up to 386,151.14 from Thursday’s close of 384,196.74

Main Market drops, Junior Market rises

The Jamaica Stock Exchange market suffered losses on Thursday while the Junior Market indices recorded gains to close over the 4,100 points level yet again.
At the close of trading the Combined Index slipped 1,212.53 points to close at 396,135.14, the All Jamaican Composite Index dropped 2,001.01 points to 432,586.16, the JSE Main Index declined 1,679.51 to end at 384,196.7 and the Junior Market Index climbed 40.52 points to 4,104.06.
The market’s PE ratio ended at 21.7 based on 2021-22 earnings and 12.5 times those for 2022-23 at the close of the Jamaica Stock Exchange.
Investors need a series of measures and pertinent information to successfully navigate the many investment choices in the local stock market. The ICInsider.com PE ratio chart and the more detailed daily report charts provide investors with regularly updated information to help with decision-making.
Investors should make use of the chart to help make rational investment decisions by investing in stocks that are close to the average for the sector and not going too far from it unless there are compelling reasons to do so. This approach helps to take emotions out of the investment decision and put in on fundamentals while at the same time not being too far from the majority of investors. Investors who buy when the price of a stock is close to the average will find that they are not inclined to overpay for a stock.
The ICInsider.com PE Ratio chart covers all ordinary shares listed on the Jamaica Stock Exchange. It shows companies grouped on an industry basis, allowing easy comparisons between the same sector companies and the overall market.
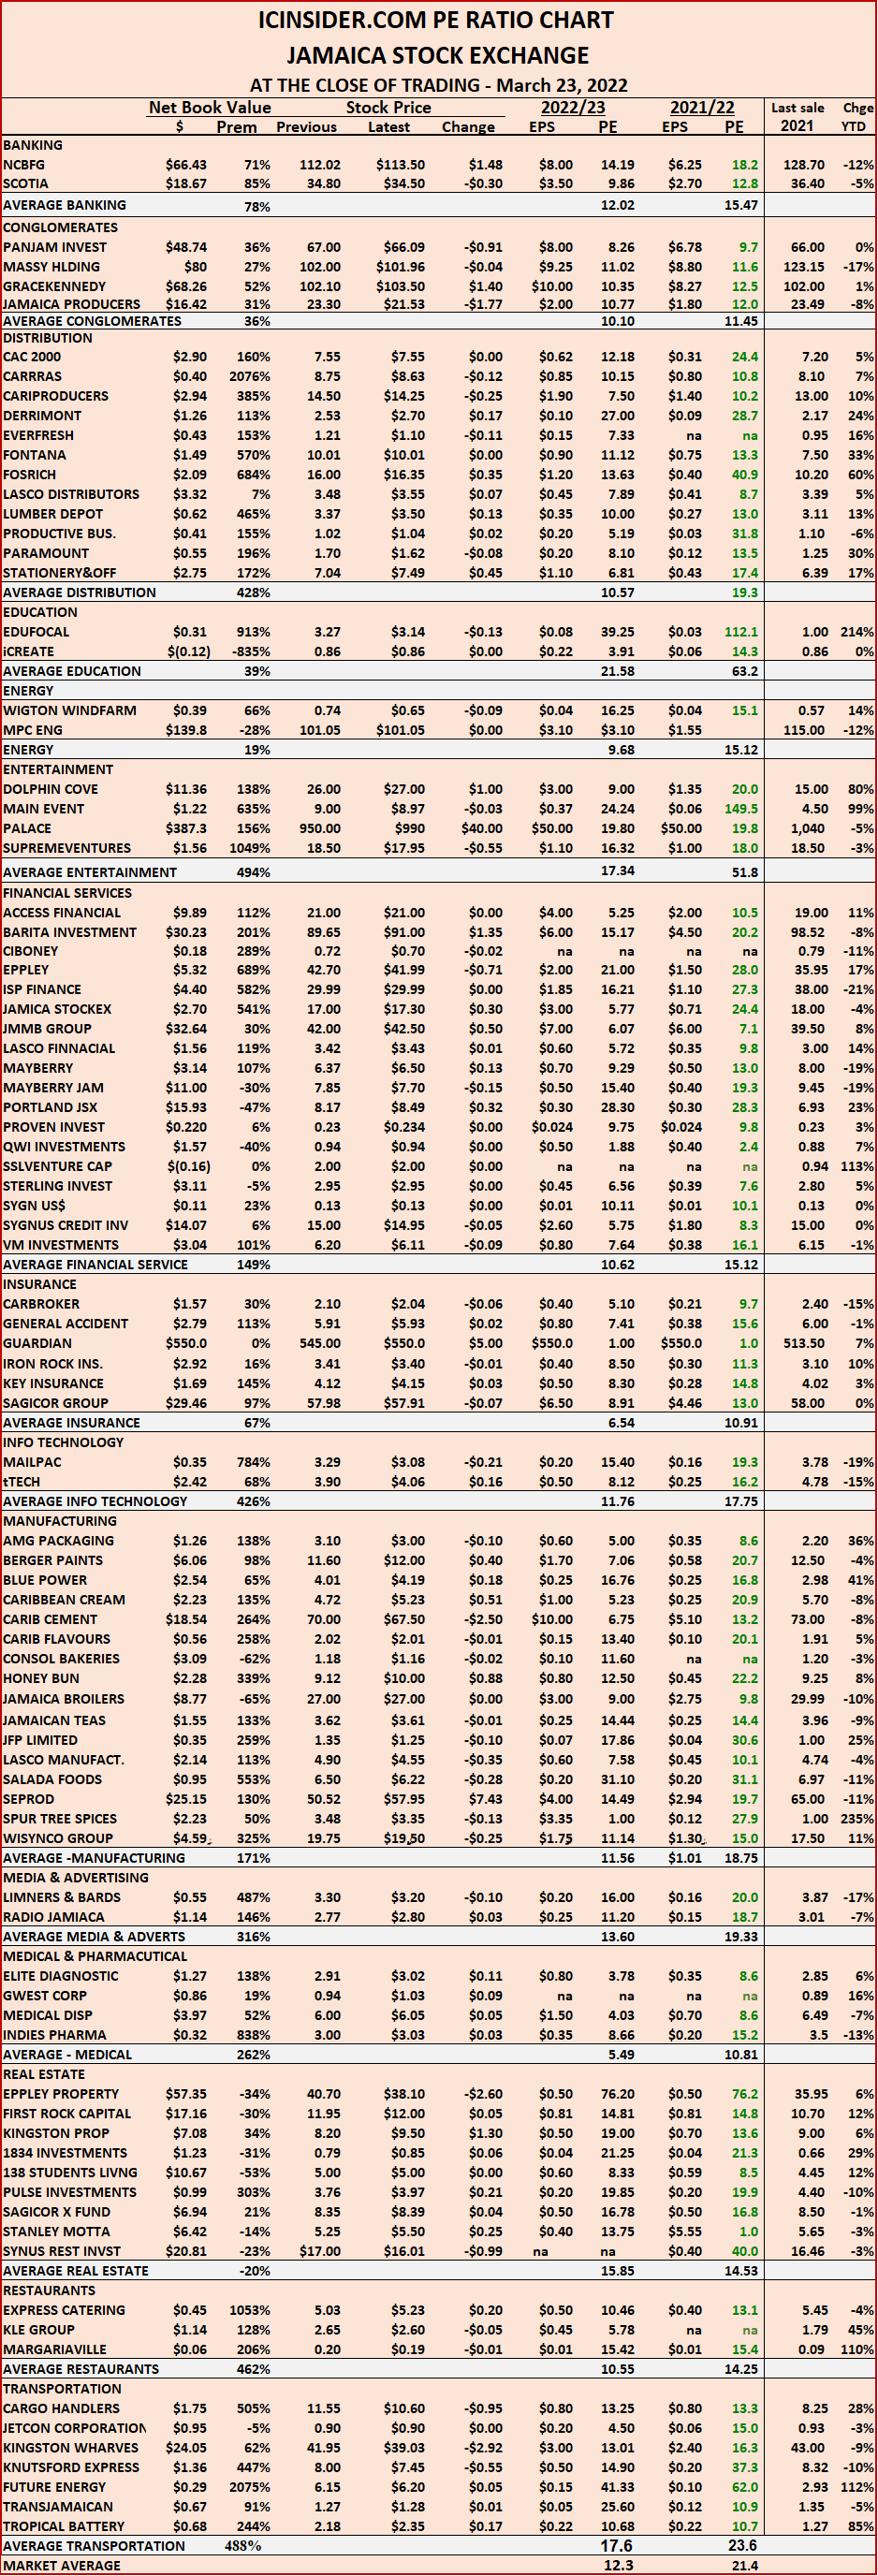
The net asset value of each company is reported as a guide to assess the value of stocks based on this measure quickly. The chart also shows daily changes in stock prices and the percentage year to date price movement based on the last traded prices. Dividends payable and yields for each company are shown in the Main and Junior Markets’ daily report charts that show closing volume for the bids and offers.
The EPS & PE ratios are based on 2021 and 2022 actual or projected earnings, excluding major one off items. The PE Ratio is the most popular measure used to determine the value of stocks.

Gains allround for Jamaica Stock Exchange

The Jamaica Stock Exchange record gains all round in trading was mixed on Wednesday with the Main Market and Junior Market indices recording moderate gains as the markets continued to wander around current levels for the time being, while awaiting a stimulus to give it new life.
 At the close of trading the Combined Index gained 662.55 points to close at 397,347.67 the  All Jamaican Composite Index popped 1,681.76 points to 434,587.17, the JSE Main Index rose 642.46 to end at 385,876.30 and the Junior Market Index inched 6.87 points higher to 4063.54.
The market’s PE ratio ended at 21.4 based on 2021-22 earnings and 12.3 times those for 2022-23 at the close of the Jamaica Stock Exchange.
Investors need a series of measures and pertinent information to successfully navigate the many investment choices in the local stock market. The ICInsider.com PE ratio chart and the more detailed daily report charts provide investors with regularly updated information to help with decision-making.
Investors should make use of the chart to help make rational investment decisions by investing in stocks that are close to the average for the sector and not going too far from it unless there are compelling reasons to do so. This approach helps to take emotions out of the investment decision and put in on fundamentals while at the same time not being too far from the majority of investors. Investors who buy when the price of a stock is close to the average will find that they are not inclined to overpay for a stock.
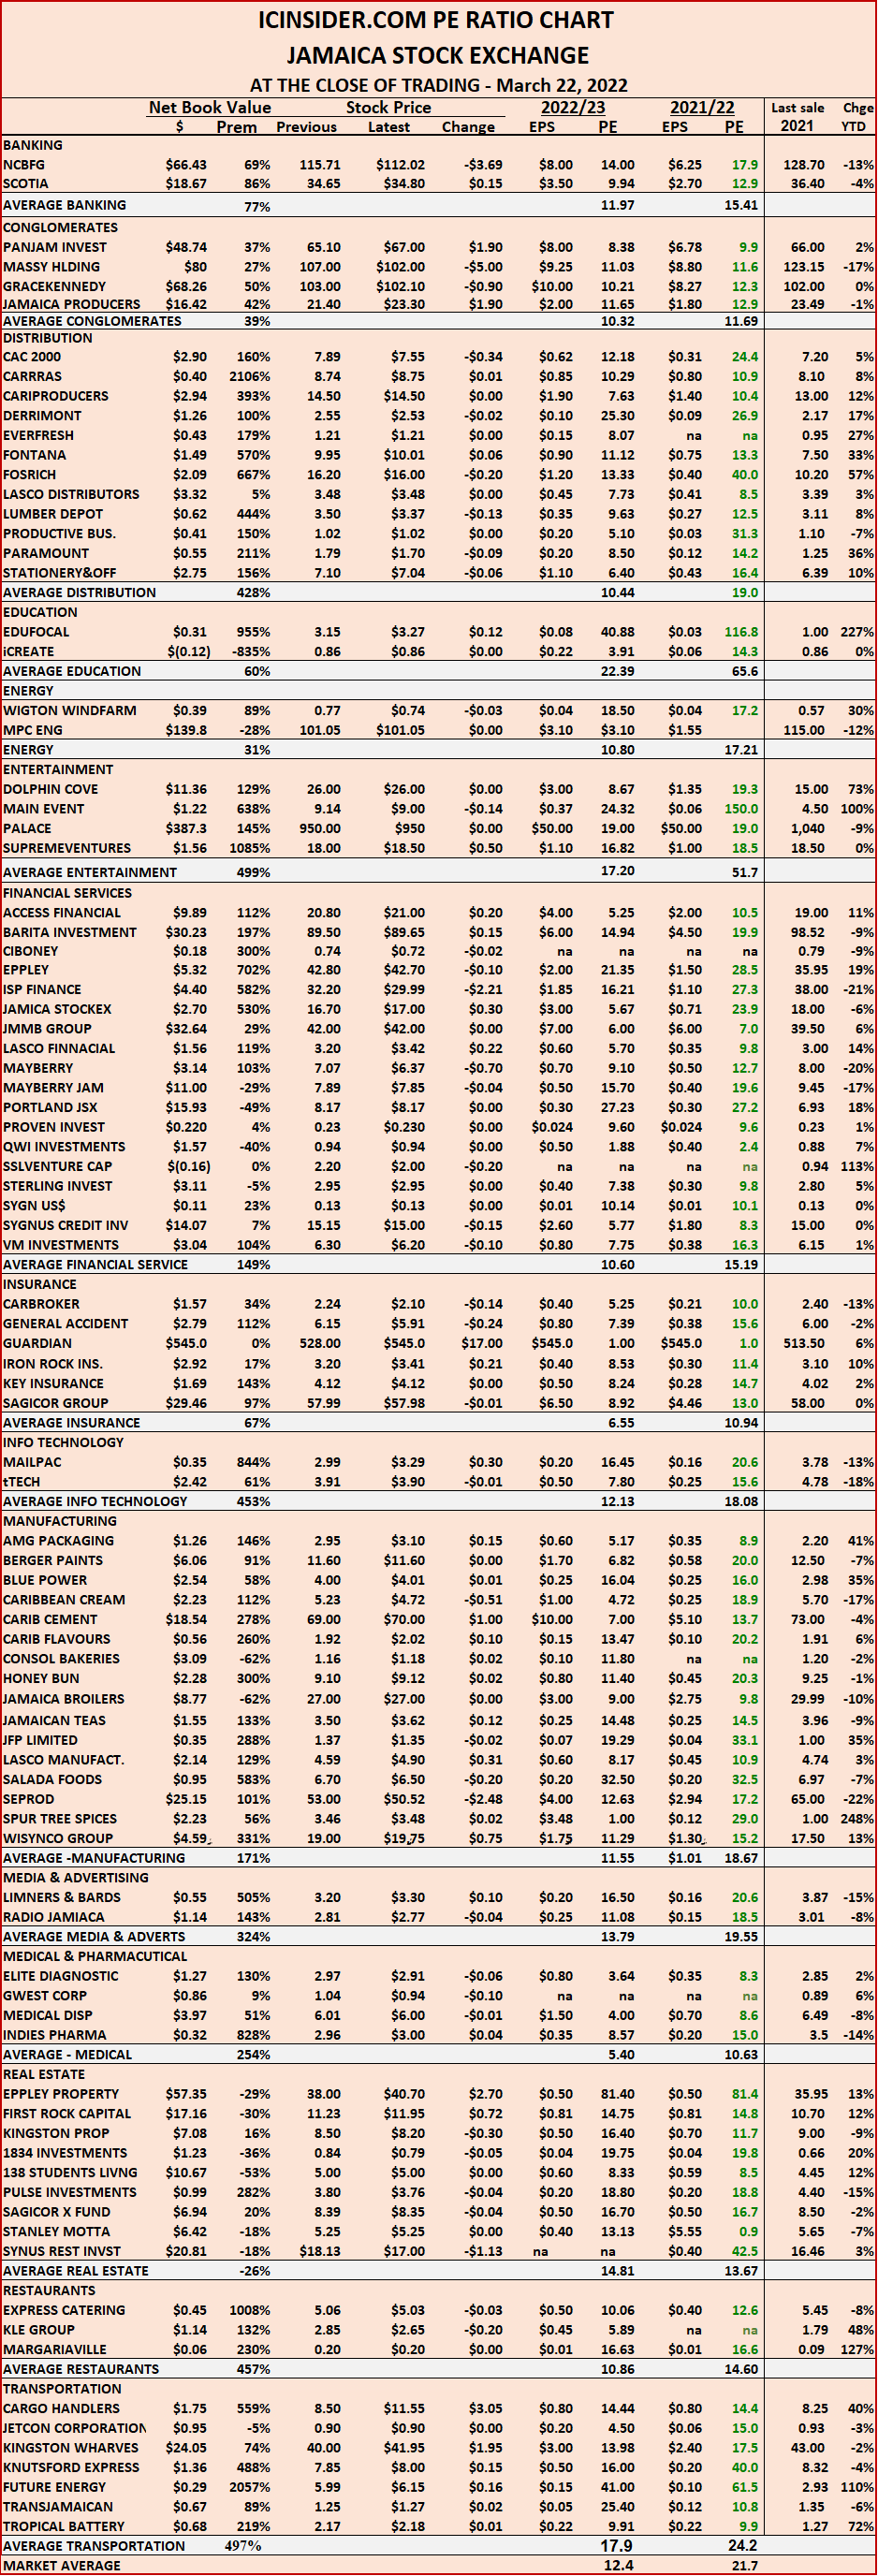
The ICInsider.com PE Ratio chart covers all ordinary shares listed on the Jamaica Stock Exchange. It shows companies grouped on an industry basis, allowing easy comparisons between the same sector companies and the overall market.
The net asset value of each company is reported as a guide to assess the value of stocks based on this measure quickly. The chart also shows daily changes in stock prices and the percentage year to date price movement based on the last traded prices. Dividends payable and yields for each company are shown in the Main and Junior Markets’ daily report charts that show closing volume for the bids and offers.
The EPS & PE ratios are based on 2021 and 2022 actual or projected earnings, excluding major one off items. The PE Ratio is the most popular measure used to determine the value of stocks.

IPO impact on stock exchange wanes

Trading was mixed on Tuesday with the Main Market declining and Junior Market recording moderate gain as the IPO impact on the market wanes with the two recent listed companies’ stock prices trading well down from their peak.
At the close of trading the Combined Index dropped 1,653.45 points to 396,685.12, the All Jamaican Composite Index dipped 1,389.99 points to end at 432,905.41 and the JSE Main Index declined by 2,176.27 to end at 385,233.79 but the Junior Market Index rose 43.25 points to close at 4056.67.
The market’s PE ratio ended at 21.7 based on 2021-22 earnings and 12.4 times those for 2022-23 at the close of the Jamaica Stock Exchange.
Investors need a series of measures and pertinent information to successfully navigate the many investment choices in the local stock market. The ICInsider.com PE ratio chart and the more detailed daily report charts provide investors with regularly updated information to help with decision-making.
Investors should make use of the chart to help make rational investment decisions by investing in stocks that are close to the average for the sector and not going too far from it unless there are compelling reasons to do so. This approach helps to take emotions out of the investment decision and put in on fundamentals while at the same time not being too far from the majority of investors. Investors who buy when the price of a stock is close to the average will find that they are not inclined to overpay for a stock.
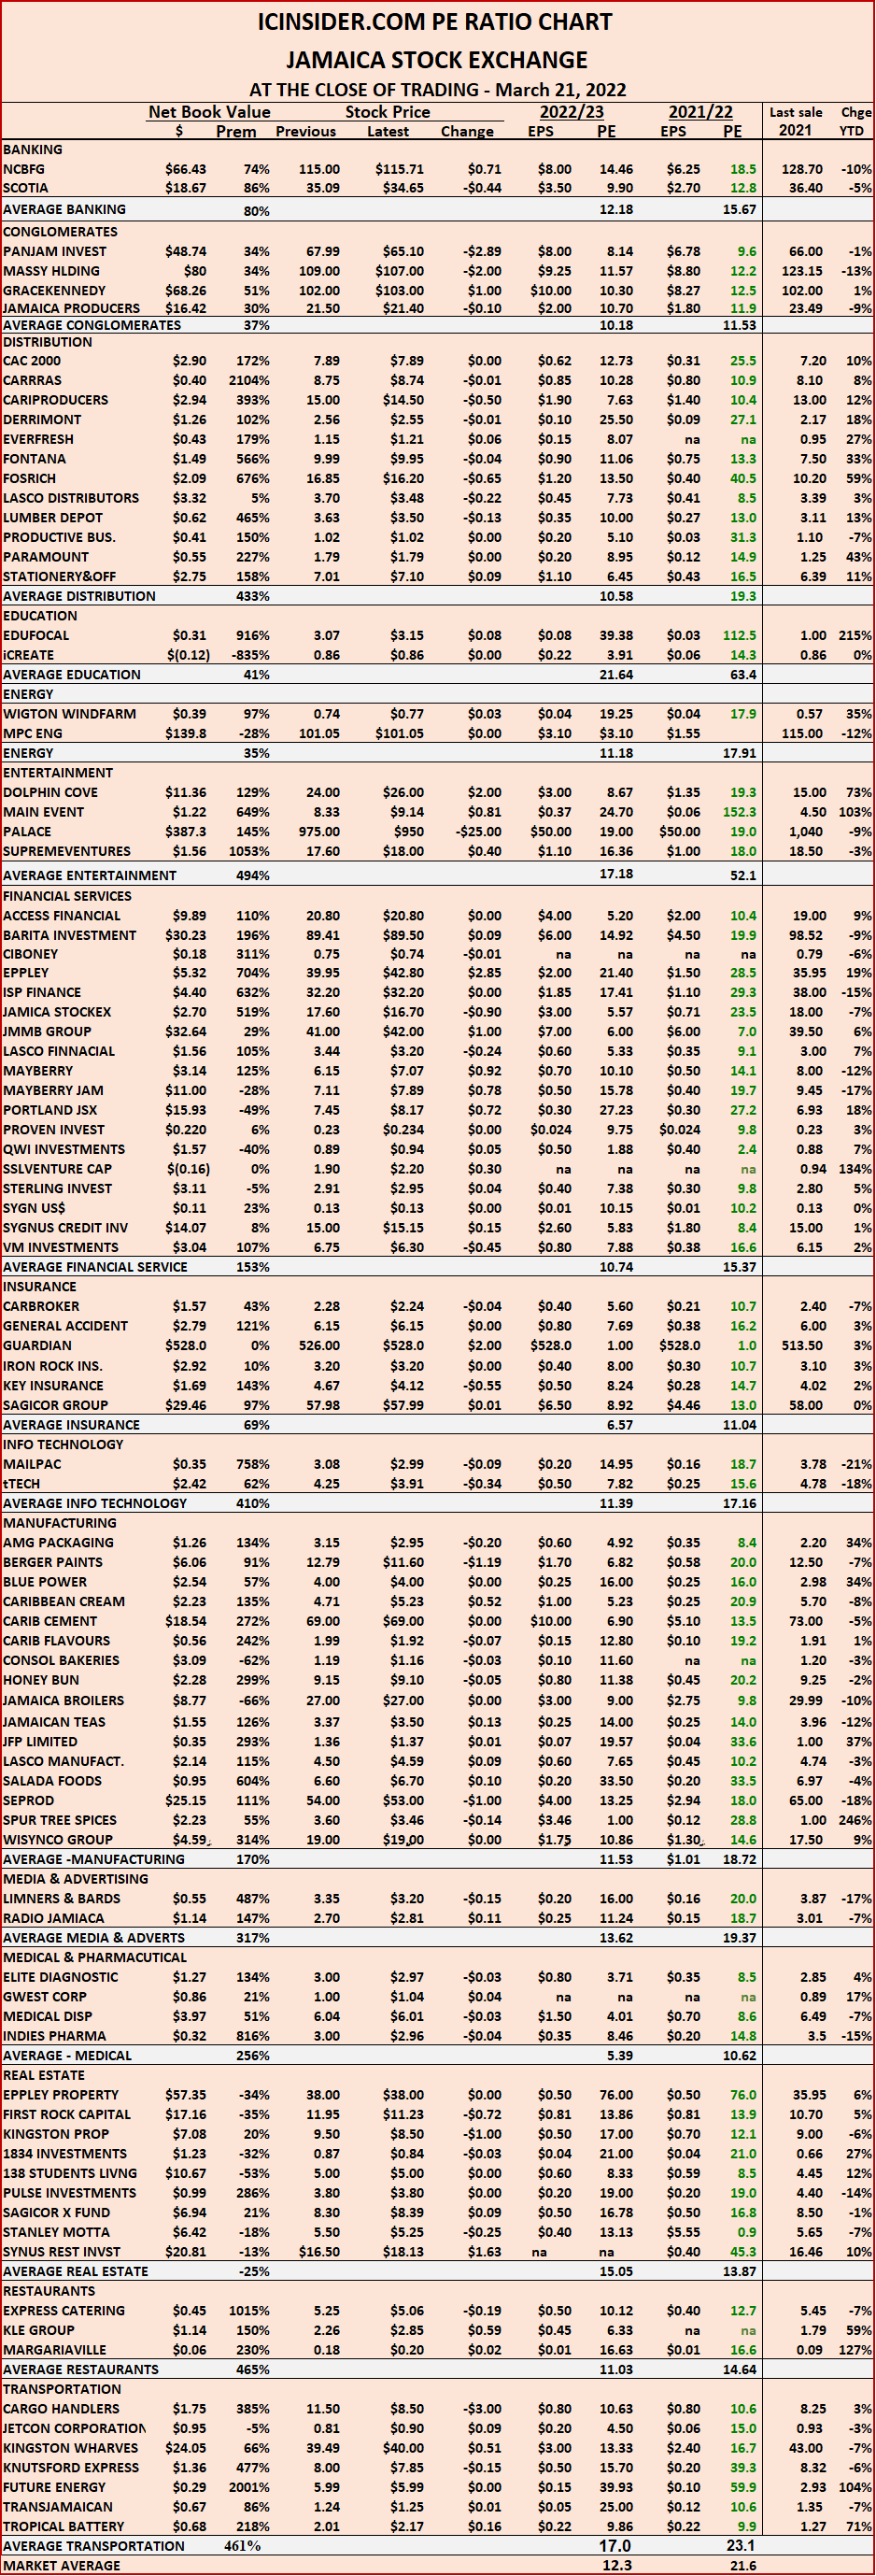
The ICInsider.com PE Ratio chart covers all ordinary shares listed on the Jamaica Stock Exchange. It shows companies grouped on an industry basis, allowing easy comparisons between the same sector companies and the overall market.
The net asset value of each company is reported as a guide to assess the value of stocks based on this measure quickly. The chart also shows daily changes in stock prices and the percentage year to date price movement based on the last traded prices. Dividends payable and yields for each company are shown in the Main and Junior Markets’ daily report charts that show closing volume for the bids and offers.
The EPS & PE ratios are based on 2021 and 2022 actual or projected earnings, excluding major one off items. The PE Ratio is the most popular measure used to determine the value of stocks.

EduFocal rally runs out of steam

Since listing on the Junior Market on Tuesday last week, EduFocal jumped 306 percent from the IPO price of $1as it hit an all-time high of $4.06 on Monday and ran out of steam with nearly 30 million units traded valued more than $1.6 million, with the price pulling back to $3.15 at the close.
At the close of trading, the Combined Index jumped 2,519.74 points to 398,338.57, the All Jamaican Composite Index surged 5,036.59 points to end at 434,295.40 and the JSE Main Index rose 3,059.12 points to end at 387,410.06 and the Junior Market Index dropped 38.77 points to close at 4013.42.
The market’s PE ratio ended at 21.6 based on 2021-22 earnings and 12.3 times those for 2022-23 at the close of the Jamaica Stock Exchange.
Investors need a series of measures and pertinent information to successfully navigate the many investment choices in the local stock market. The ICInsider.com PE ratio chart and the more detailed daily report charts provide investors with regularly updated information to help with decision-making.
Investors should make use of the chart to help make rational investment decisions by investing in stocks that are close to the average for the sector and not going too far from it unless there are compelling reasons to do so. This approach helps to take emotions out of the investment decision and put in on fundamentals while at the same time not being too far from the majority of investors. Investors who buy when the price of a stock is close to the average will find that they are not inclined to overpay for a stock.
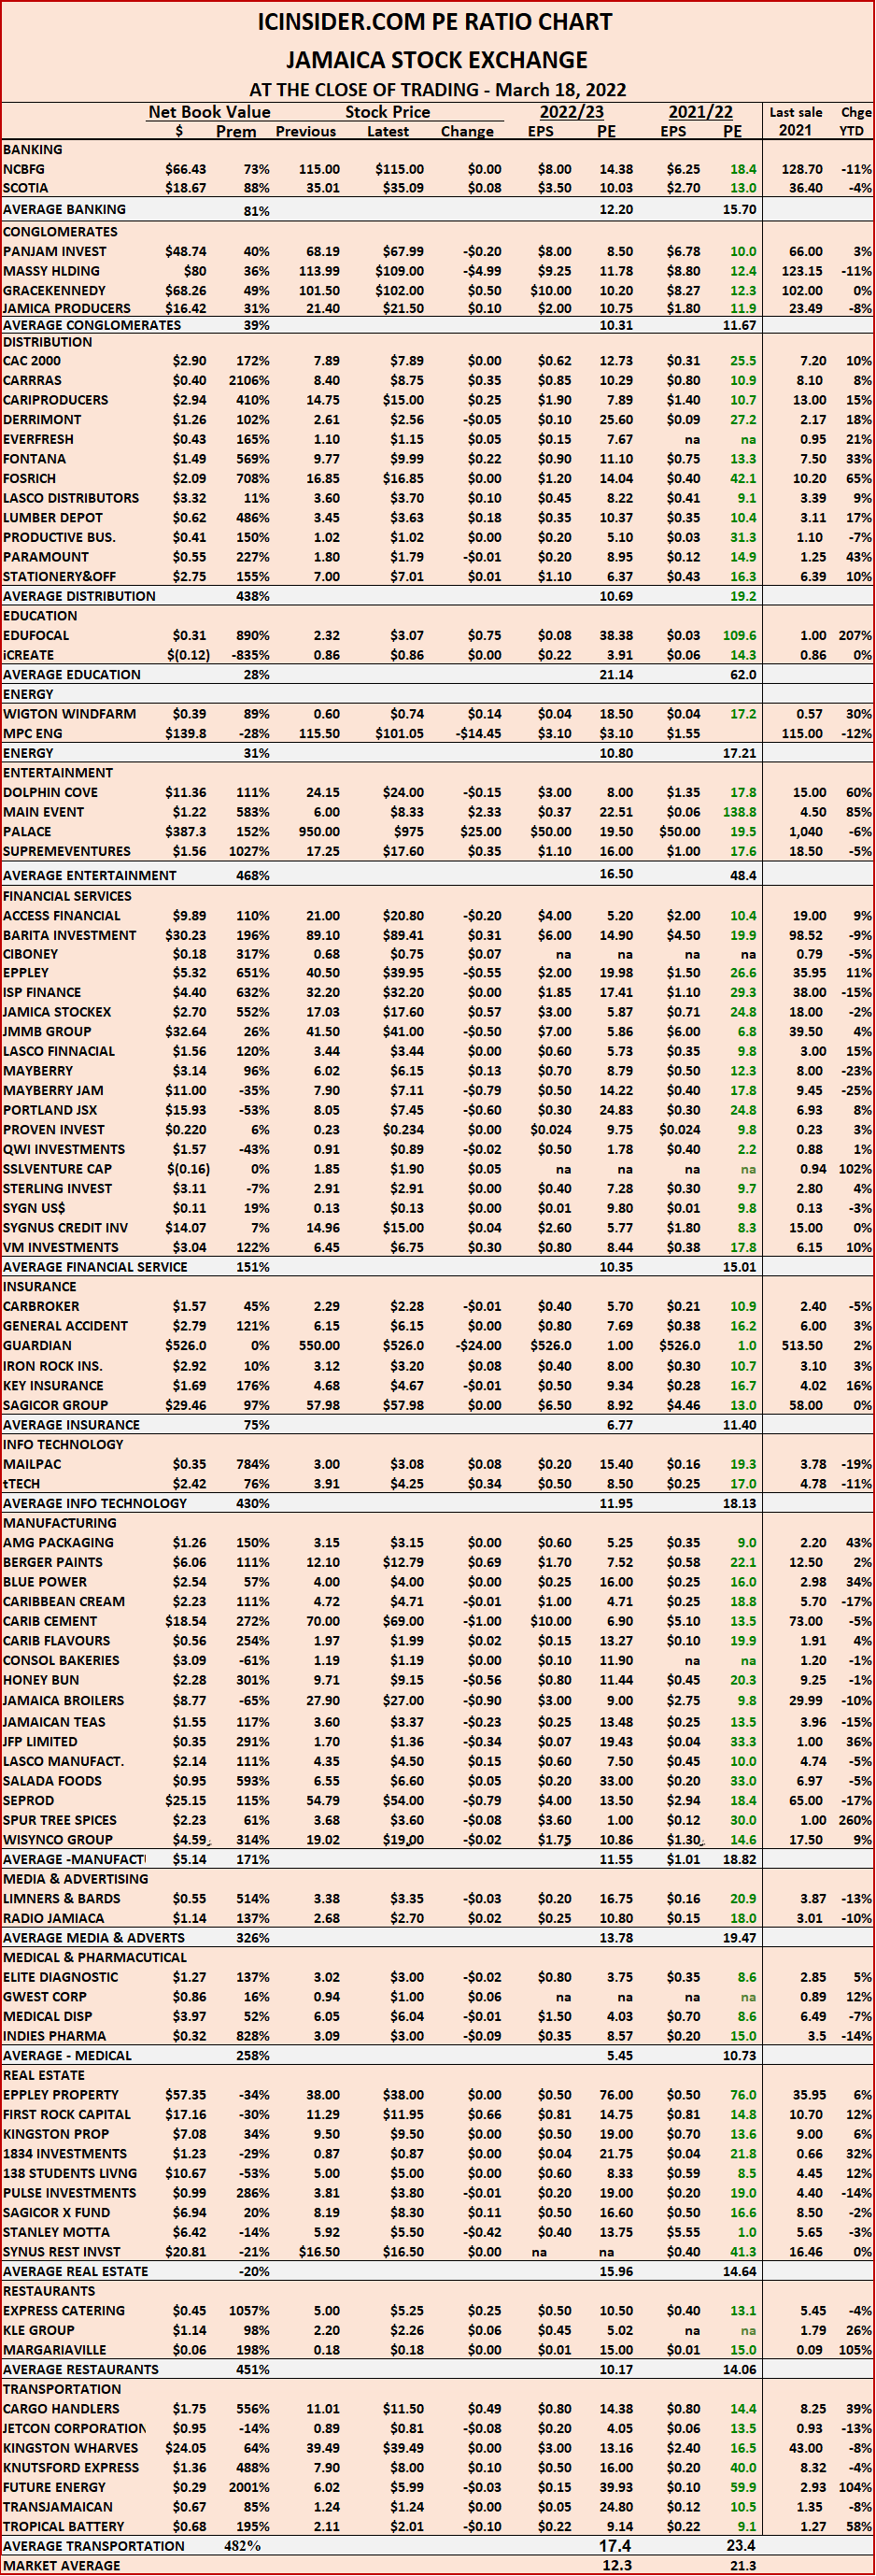
The ICInsider.com PE Ratio chart covers all ordinary shares listed on the Jamaica Stock Exchange. It shows companies grouped on an industry basis, allowing easy comparisons between the same sector companies and the overall market.
The net asset value of each company is reported as a guide to assess the value of stocks based on this measure quickly. The chart also shows daily changes in stock prices and the percentage year to date price movement based on the last traded prices. Dividends payable and yields for each company are shown in the Main and Junior Markets’ daily report charts that show closing volume for the bids and offers.
The EPS & PE ratios are based on 2021 and 2022 actual or projected earnings, excluding major one off items. The PE Ratio is the most popular measure used to determine the value of stocks.

EduFocal gains 207% in a week

Since listing on the Junior Market on Tuesday EduFocal is up 207 percent from the IPO price in early March, with demand at more than 18 million shares at $3 and above at the close of the market on Friday after gaining 75 cents for the day and helping to move the Junior Market Index jumped 76.48 points to settle at 4052.19, at the same time the Combined Index jumped 2,195.90 points to 395,818.83, the All Jamaican Composite Index gained 1,319.00 points to end at 429,258.81 and the JSE Main Index rose 1,620.15 points to end at 384,350.94,
The market’s PE ratio ended at 21.3 based on 2021-22 earnings and 12.3 times those for 2022-23 at the close of the Jamaica Stock Exchange.
Investors need a series of measures and pertinent information to successfully navigate the many investment choices in the local stock market. The ICInsider.com PE ratio chart along with the more detailed daily report charts, provide investors with regularly updated information to help with decision making.
Investors should make use of the chart to help make rational investment decisions, by investing in stocks that are close to the average for the sector and not going too far from it, unless there are compelling reasons to do so. Investors who buy when the price of a stock is close to the average will find that they are not inclined to overpay for a stock.  This approach helps to take emotions out of the investment decision and put in on fundamentals while at the same time not being too far from the majority of investors.
The ICInsider.com PE Ratio chart covers all ordinary shares listed on the Jamaica Stock Exchange and shows companies grouped on an industry basis, allowing for easy comparisons between same sector companies as well as the overall market.
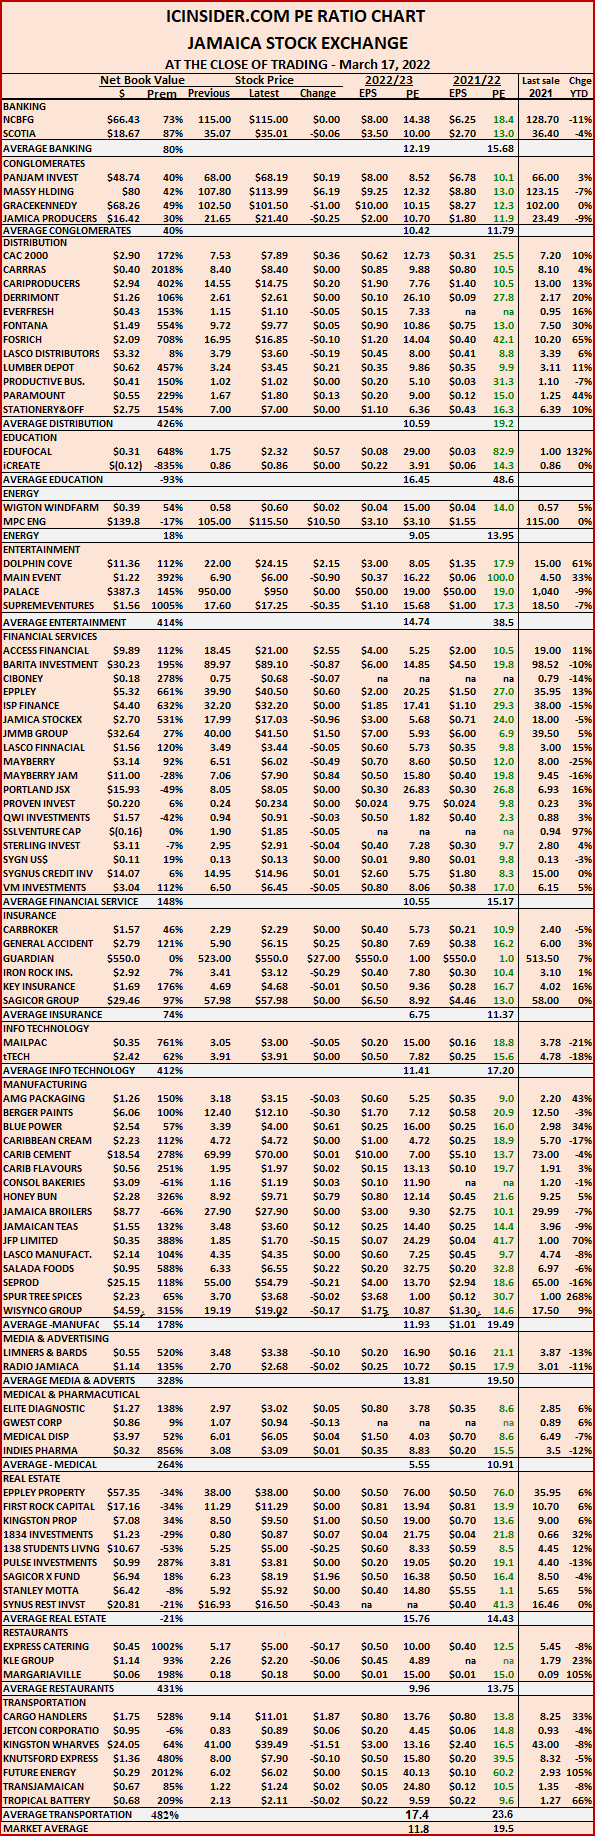
The net asset value of each company is reported as a guide to easily assess the value of stocks based on this measure. The chart also shows daily changes in stock prices and the percentage year to date price movement based on the last traded prices. Dividends payable and yields for each company are shown in the Main and Junior Markets’ daily report charts that show closing volume for the bids and offers.
The EPS & PE ratios are based on 2021 and 2022 actual or projected earnings, excluding major one-off items. The PE Ratio is the most popular measure used to determine the value of stocks.

NCB dropped to a low of $90

In Thursday trading,  NCB Financial dropped to a 52 weeks’ intraday low of $90 before bouncing within minutes of the close to trading at $115 but the stock has only 14  bids to buy with most under $100 and an indication of the stock’s weakness. The fall in NCB helped in pushing the Main Market of the Jamaica Stock Exchange down, with the Combined Index dropping 2,719.24 points to 393,622.90, the All Jamaican Composite Index dived 4,466.69 points to 427,939.8, the JSE Main Index tumbled 2,641.22 points to end at 382,730.79, while the Junior Market Index declined 27.76 points to settle at 3,975.71.
The market’s PE ratio ended at 19.5 based on 2021-22 earnings and 11.8 times those for 2022-23 at the close of the Jamaica Stock Exchange.
Investors need a series of measures and pertinent information to successfully navigate the many investment choices in the local stock market. The ICInsider.com PE ratio chart along with the more detailed daily report charts, provide investors with regularly updated information to help with decision making.
Investors should make use of the chart to help make rational investment decisions, by investing in stocks that are close to the average for the sector and not going too far from it, unless there are compelling reasons to do so. Investors who buy when the price of a stock is close to the average will find that they are not inclined to overpay for a stock.  This approach helps to take emotions out of the investment decision and put in on fundamentals while at the same time not being too far from the majority of investors.
The ICInsider.com PE Ratio chart covers all ordinary shares listed on the Jamaica Stock Exchange and shows companies grouped on an industry basis, allowing for easy comparisons between same sector companies as well as the overall market.
The net asset value of each company is reported as a guide to easily assess the value of stocks based on this measure. The chart also shows daily changes in stock prices and the percentage year to date price movement based on the last traded prices. Dividends payable and yields for each company are shown in the Main and Junior Markets’ daily report charts that show closing volume for the bids and offers.
The EPS & PE ratios are based on 2021 and 2022 actual or projected earnings, excluding major one off items. The PE Ratio is the most popular measure used to determine the value of stocks.