Trading Activities on the Jamaica Stock Exchange ended Tuesday with the volume and value of stocks exchanged declining from trading on Monday, resulting in modest gains in Junior and JSE USD markets and declines in the Main market indices, resulting in prices of 47 shares rising, 37 declining and 32 remaining firm.
 At the close of the market, the JSE Combined Market Index skidded 378.86 points to 333,909.08, the All Jamaican Composite Index shed 842.57 points to conclude trading at 370,324.84, the JSE Main Index dipped 540.20 points to 321,327.66, the Junior Market Index increased 19.17 points to wrap up trading at 3,713.75, and the JSE USD Market Index popped 0.69 points to end trading at 266.74.
At the close of trading, 28,049,258 shares were exchanged in all three markets, compared to 39,711,654 units on Monday, with the value of stocks traded on the Junior and Main markets amounted to $116.99 million, down from $148.15 million on the previous day and the JSE USD market closed with an exchange of 1,644,221 shares for US$53,768 well above the 925,163 units that traded for US$39,022 on Monday.
In Main Market activity, Wigton Energy led trading with 15.01 million stocks followed by Transjamaican Highway with 3.75 million shares and Sagicor Select Financial Fund with 1.39 million units.
In Junior Market trading, Dolla Financial led trading with 1.20 million stocks followed by RA Williams with 923,243 shares and Jamaican Teas with 315,198 units.
In the preference segment, Productive Business Solutions 10.5% preference share popped $10 to $1,060. The market’s PE ratio, the most popular measure used to value stocks, ended at 13.91 based on 2024-25 earnings and 20.6 based on 2023-24 historical earnings.
The ICInsider.com PE ratio chart and other more detailed daily charts provide investors with regularly updated information to help decision-making. The PE ratio chart covers all ordinary shares on the Jamaica Stock Exchange, grouped by industry, allowing for easy comparisons within a sector and the overall market. The earnings per share (EPS) and PE ratios are based on 2024 and 2024 actual or projected earnings, excluding any major time income or expenses.
Pertinent information is required to navigate numerous investment options successfully in the stock market. The chart should be used in making rational decisions when investing in stocks close to the sector average, with investors well advised not to go too far from it unless there are compelling reasons to do so. This approach helps to remove emotions from investment decisions and place them on fundamentals while at the same time not being too far from the majority of investors. Investors who buy when the price of a stock is close to the average will find that they are not inclined to overpay for a stock.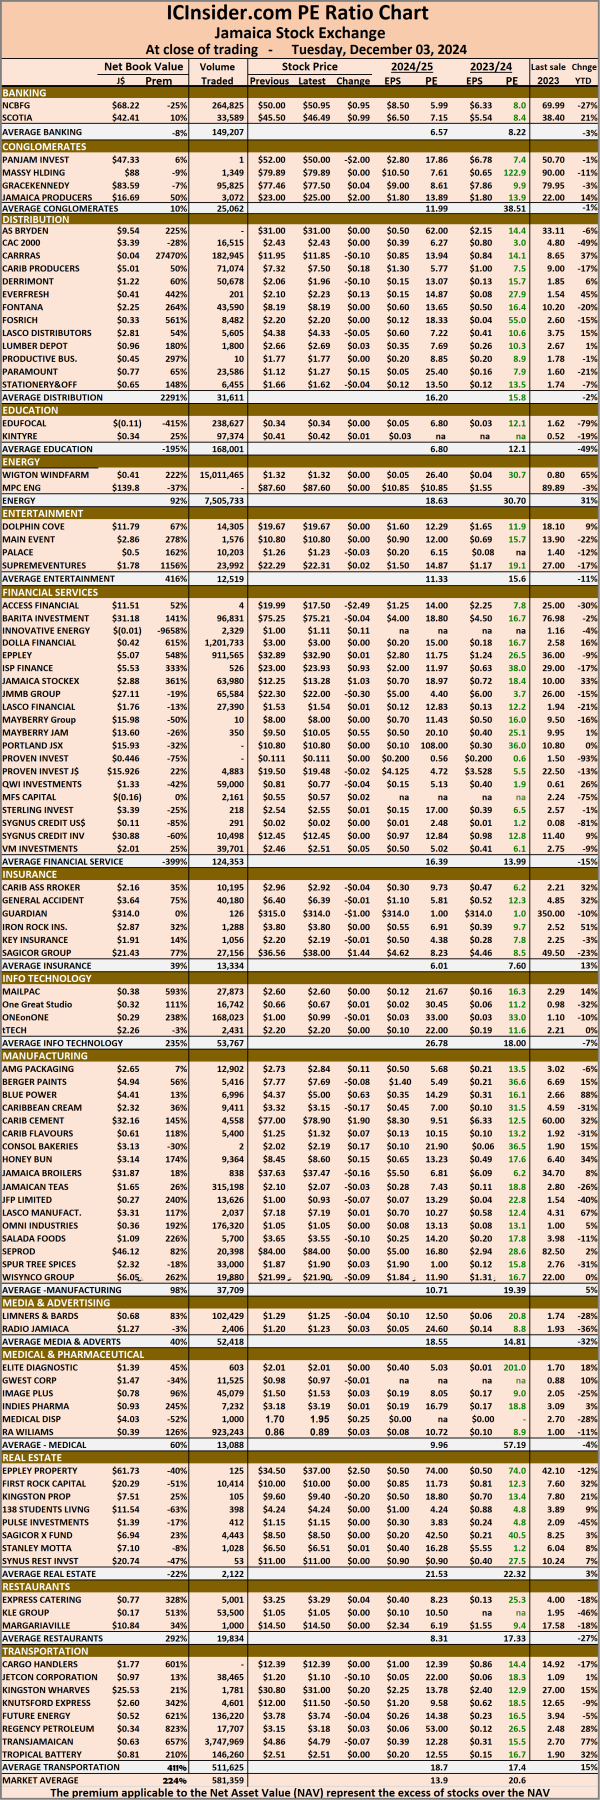 The net asset value of each company is incorporated into the chart. Investors can use this measure in assessing stock values. The chart also shows daily changes in stock prices and the percentage year to date price movement based on the last traded prices. Dividends that are paid or are due to be paid and yields for each company are shown in the Main and Junior Markets’ daily report charts, along with the closing volume of the highest bid and the lowest offer for each company.
 The market closed with trading of 30,240,989 shares with a value of $131,168,749 versus 25,057,280 stocks at $318,023,674 on Friday. Trading averaged 504,016 shares at $2,186,146 versus 455,587 stocks at $5,782,249 on Friday and compared with an average of 286,669 stock units at $2,555,172 in November.
 The Main Market ended trading with an average PE Ratio of 14.2. The JSE Main and USD Market PE ratios are based on last traded prices and earnings forecasts by ICInsider.com for companies with the financial year ending around August 2025.
 Pan Jamaica gave back a big portion of Friday’s gains as the price slipped $4 to end at $52 after an exchange of 53,678 stocks, Sagicor Group gave back all of the $3.10 gains on Friday with a fall of $3.54 to finish at $36.56 with 203,165 shares changing hands, Scotia Group advanced $1.43 to close at $45.50 in an exchange of 45,506 stock units. Seprod declined 70 cents to $84 with investors trading 39,671 shares, Sygnus Credit Investments popped 45 cents and ended at $12.45 with 19,291 stock units crossing the exchange and Sygnus Real Estate Finance fell 44 cents to end at $11 after a transfer of a mere 9 stocks.
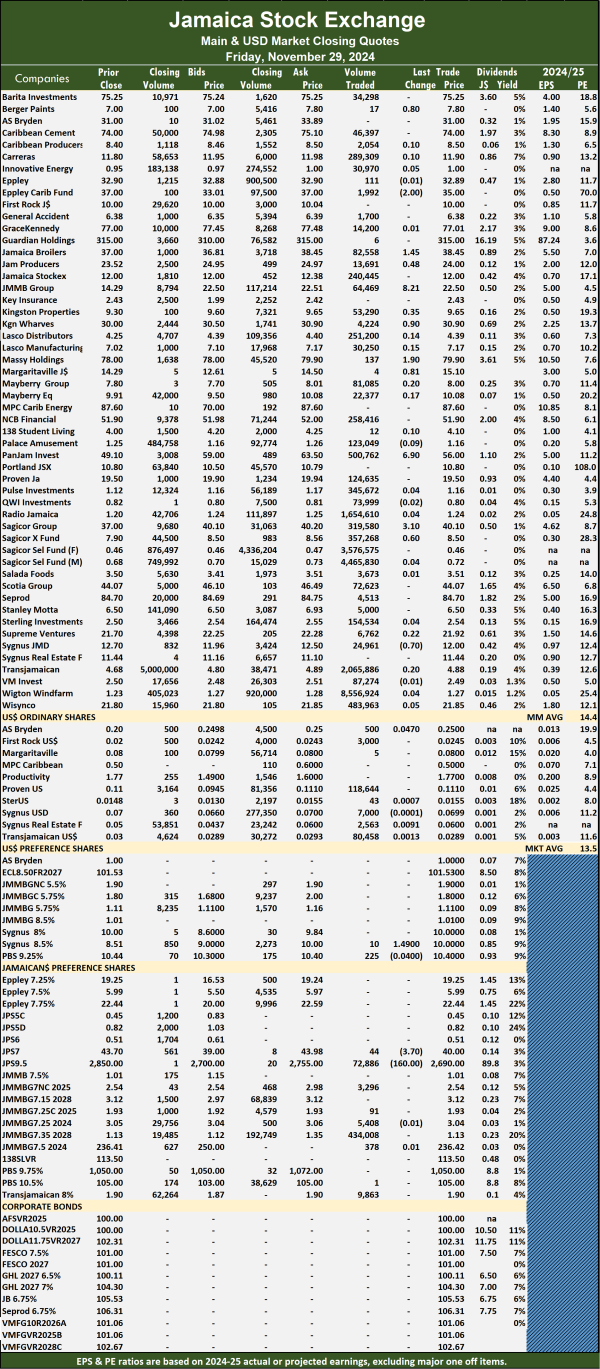 Prices of securities trading are those for the last transaction of each stock unless otherwise stated.
 At the close of the market, the JSE Combined Market Index crawled 63.60 points to settle at 334,287.94, while the All Jamaican Composite Index jumped 1,241.73 points to 371,167.41, the JSE Main Index rallied 276.37 points to 321,867.86, the Junior Market Index declined 27.94 points to 3,694.58, and the JSE USD Market Index dipped 0.81 points to wrap up trading at 267.05.
 The market’s PE ratio, the most popular measure used to value stocks, ended at 13.8 based on projected 2024-25 earnings and 20.5 based on 2023-24 historical earnings. The ICInsider.com PE ratio chart and other more detailed daily charts provide investors with regularly updated information to help decision-making. The PE ratio chart covers all ordinary shares on the Jamaica Stock Exchange, grouped by industry, allowing for easy comparisons within a sector and the overall market. The earnings per share (EPS) and PE ratios are based on 2023 and 2024 actual or projected earnings, excluding major one time income or expense.
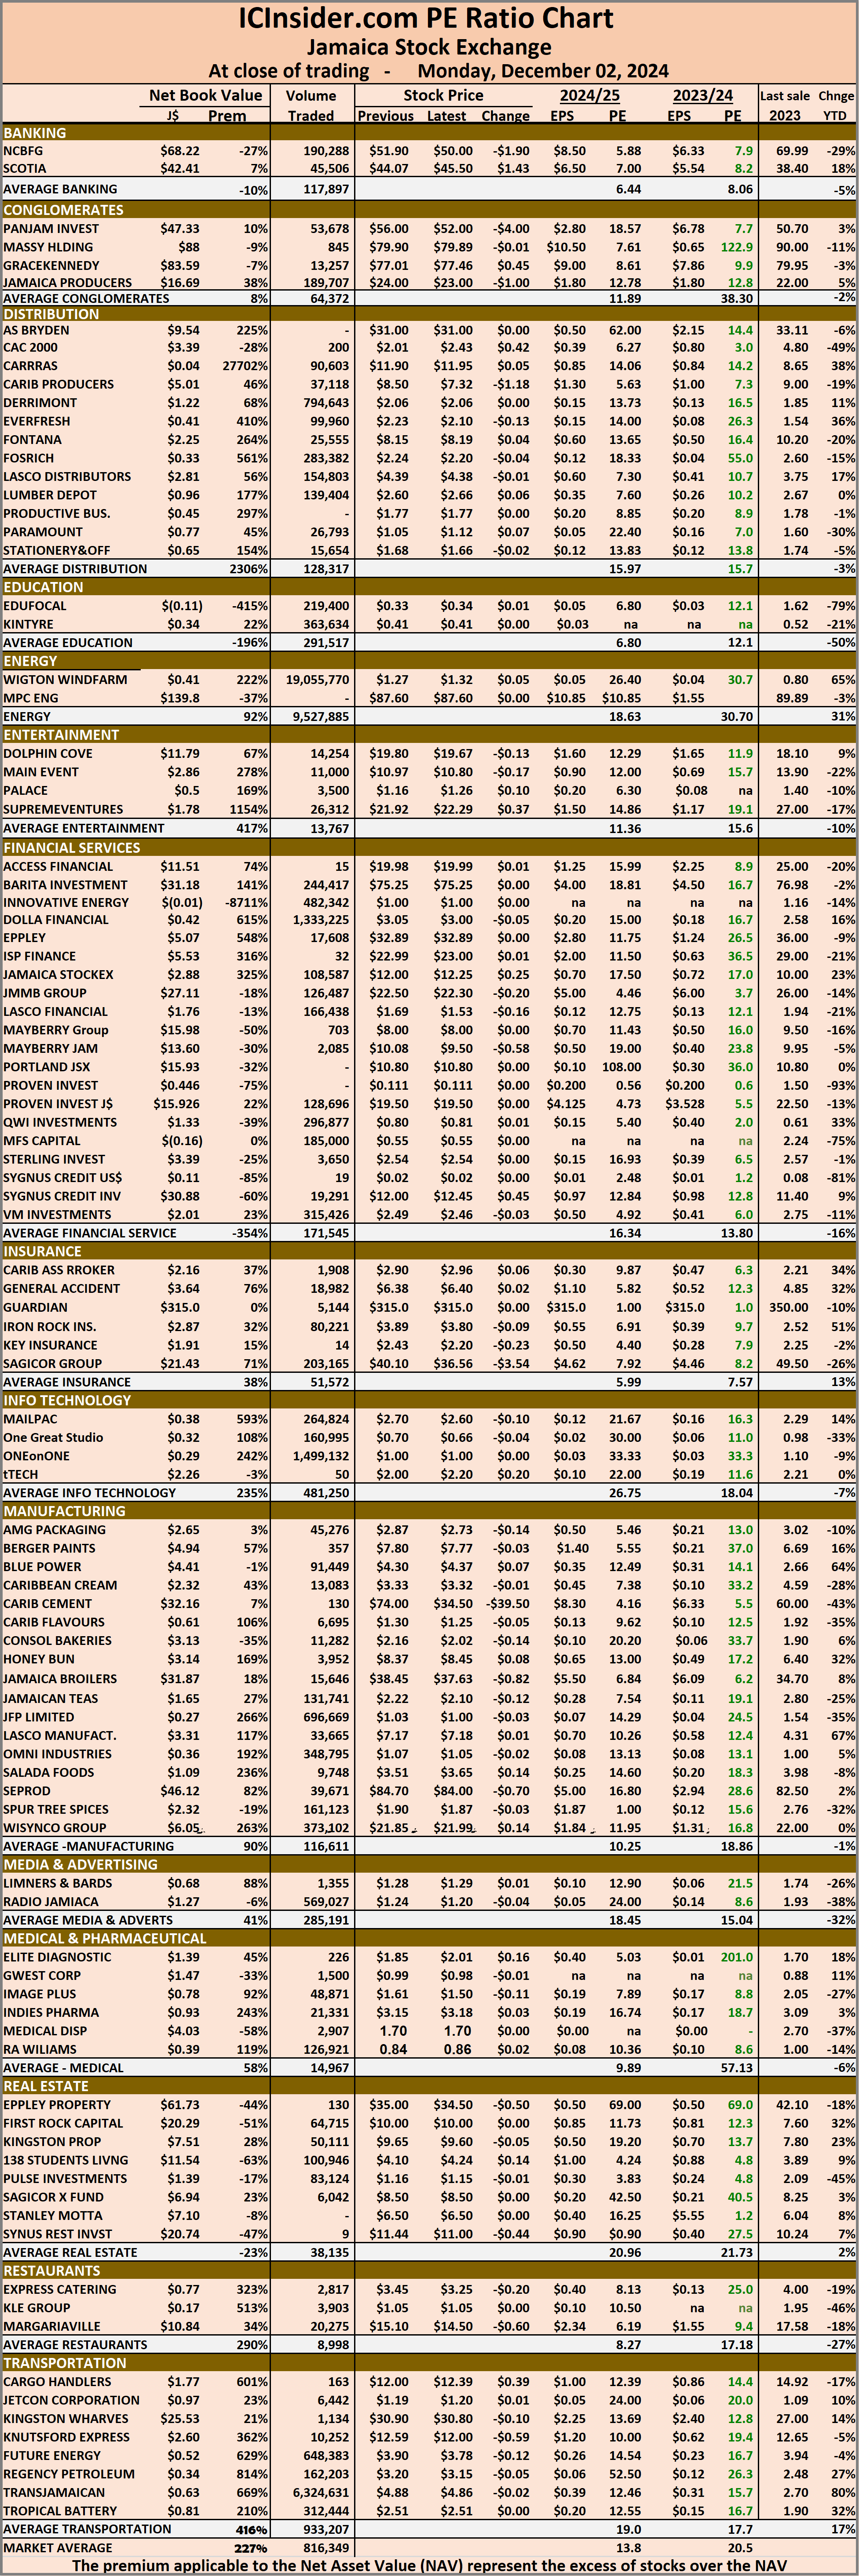 The net asset value of each company is incorporated into the chart. Investors can use this measure to assess stock values. The chart also shows daily changes in stock prices and the percentage year to date price movement based on the last traded prices. Dividends that are paid or are due to be paid and yields for each company are shown in the Main and Junior Markets’ daily report charts, along with the closing volume of the highest bid and the lowest offer for each company.
 During trading Caribbean Cement price hit a 52 weeks’ intraday high of $75.10 but it closed at $74, Pan Jamaica closed at a 52 weeks’ high of $56.90, Jamaica Public Service 9.5% ended at $2,690, after trading at a 52 weeks Intraday high of $3,280.16 and Pulse Investments traded at an intraday low of $1, but bounced back to close at $1.16.
 The market indices jumped sharply, helped by a big price movement in Pan Jamaica and Sagicor Group, as the All Jamaican Composite Index popped 6,733.96 points to close at 369,925.68, the JSE Main Index increased 5,333.88 points to 321,591.49 and the JSE Financial Index advanced 1.75 points to settle at 65.52. The Investor’s Choice bid-offer indicator shows 17 stocks ended with bids higher than their last selling prices and six with lower offers.
 Margaritaville gained 81 cents in closing at $15.10 after an exchange of just 4 units. Massy Holdings climbed $1.90 to $79.90 with 137 stocks changing hands, Pan Jamaica rallied $6.90 to end at a 52 weeks’ high of $56 with 500,762 stock units crossing the exchange, Sagicor Group increased $3.10 in closing at $40.10 in switching ownership of 319,580 shares. Sagicor Real Estate Fund climbed 60 cents to $8.50 after an exchange of 357,268 stocks and Sygnus Credit Investments fell 70 cents to finish at $12 trading 24,961 units.
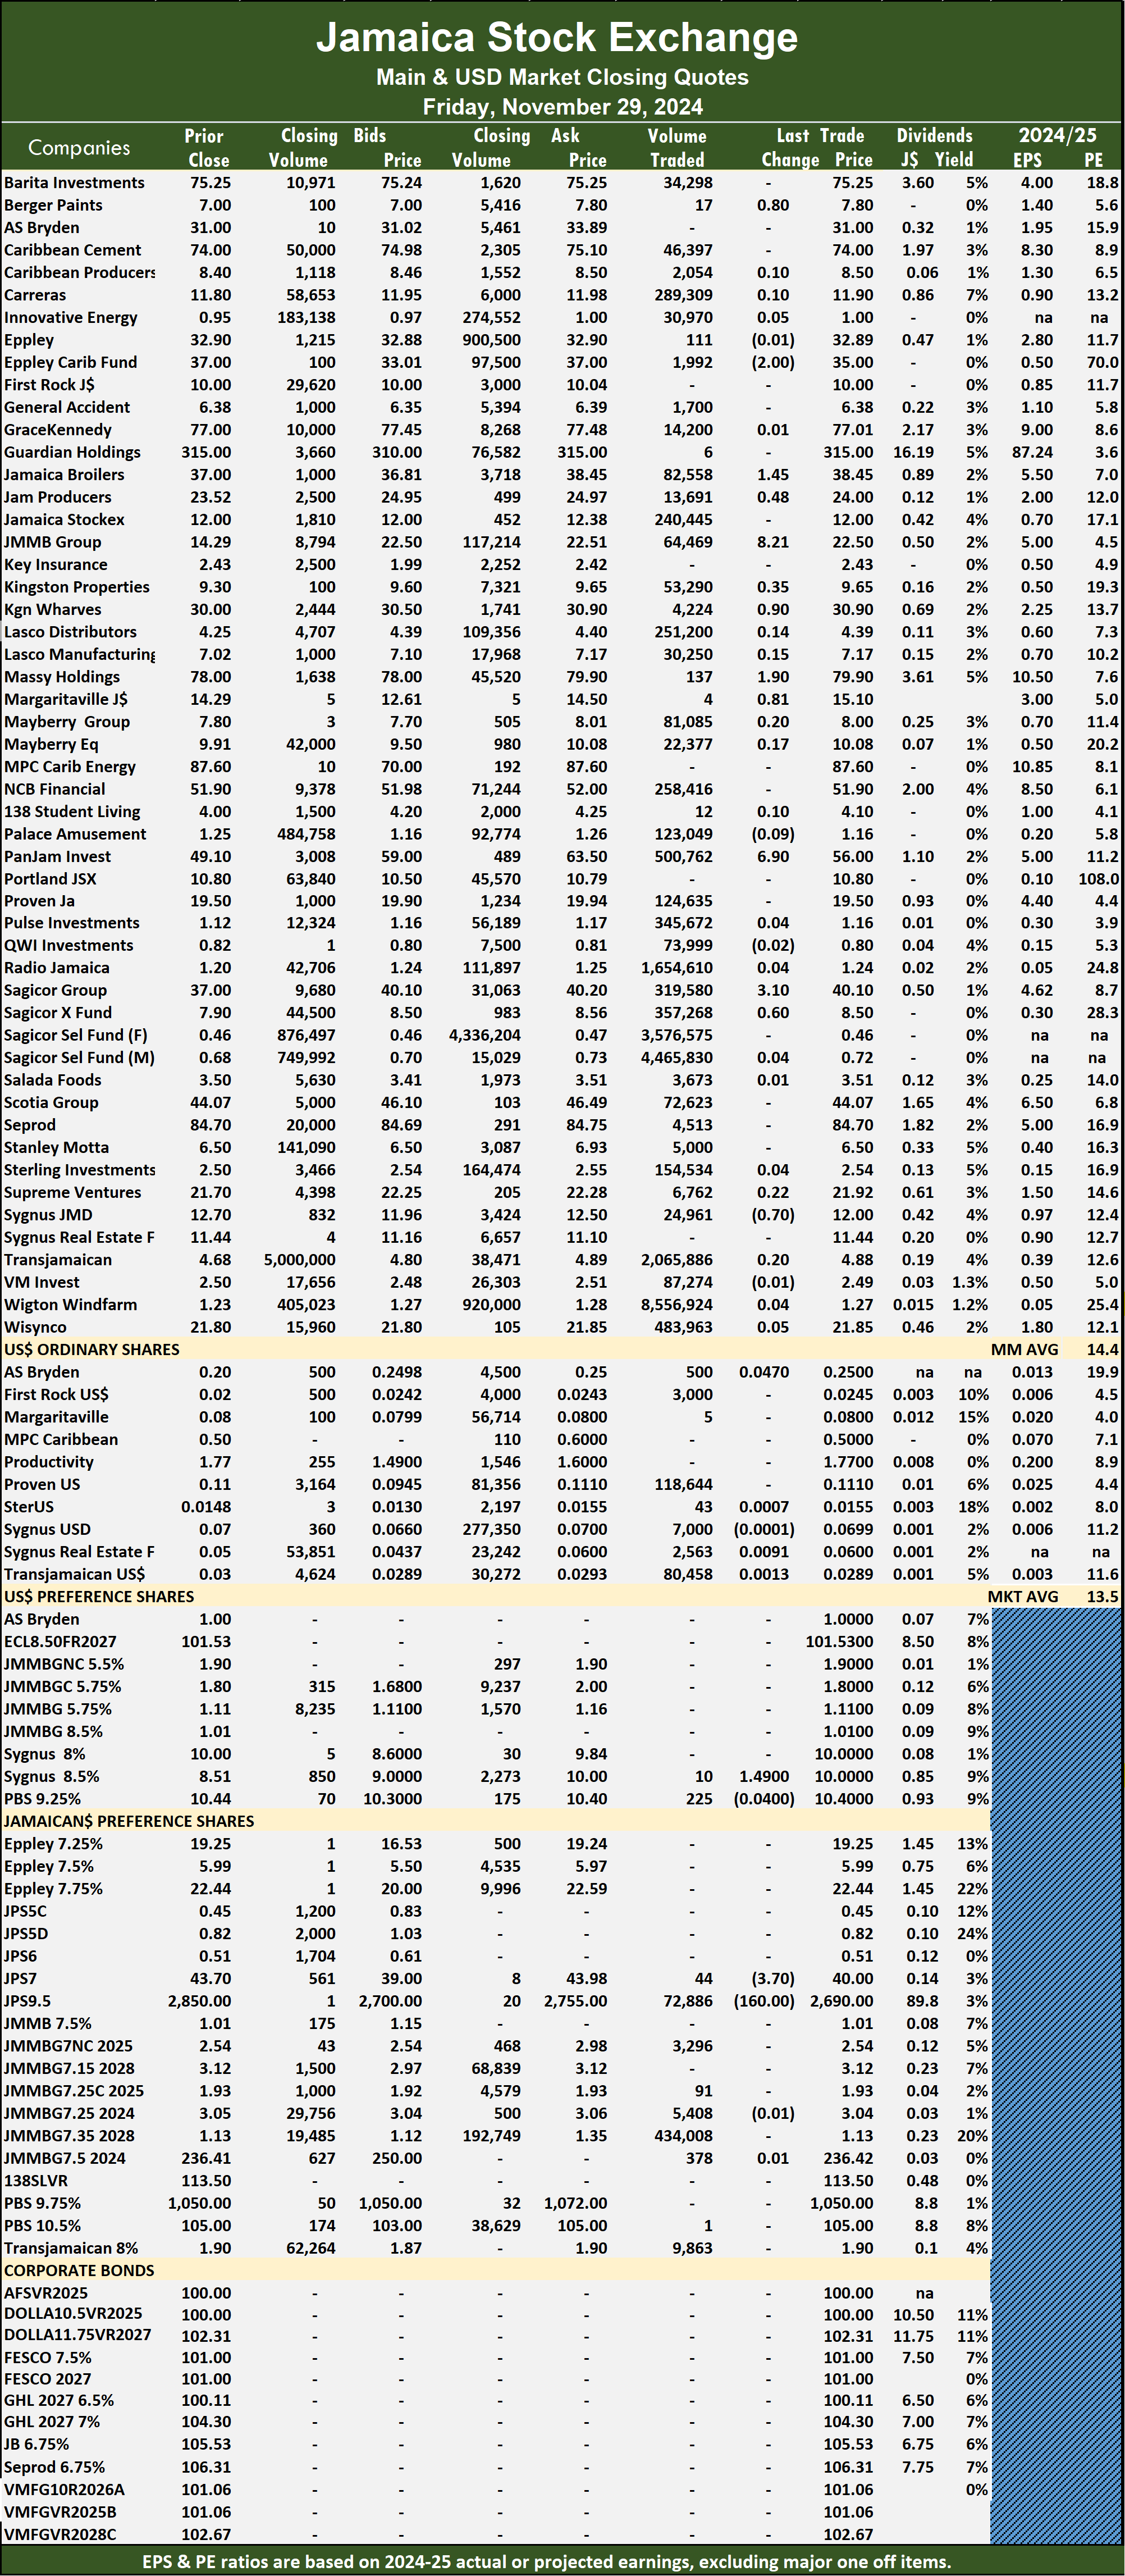 Prices of securities trading are those for the last transaction of each stock unless otherwise state
 At the close of the market, the JSE Combined Market Index jumped 5,027.33 points to 334,224.34, the All Jamaican Composite Index surged 6,733.96 points to settle at 369,925.68, the JSE Main Index climbed 5,333.88 points to finish at 321,591.49, the Junior Market Index sank 10.13 points to close at 3,722.52 and the JSE USD Market Index jumped 15.50 points to wrap up trading at 267.86.
 The ICInsider.com PE ratio chart and other more detailed daily charts provide investors with regularly updated information to help decision-making. The PE ratio chart covers all ordinary shares on the Jamaica Stock Exchange, grouped by industry, allowing for easy comparisons within a sector and the overall market. The earnings per share (EPS) and PE ratios are based on 2024 and 2024 actual or projected earnings, excluding any major time income or expenses.
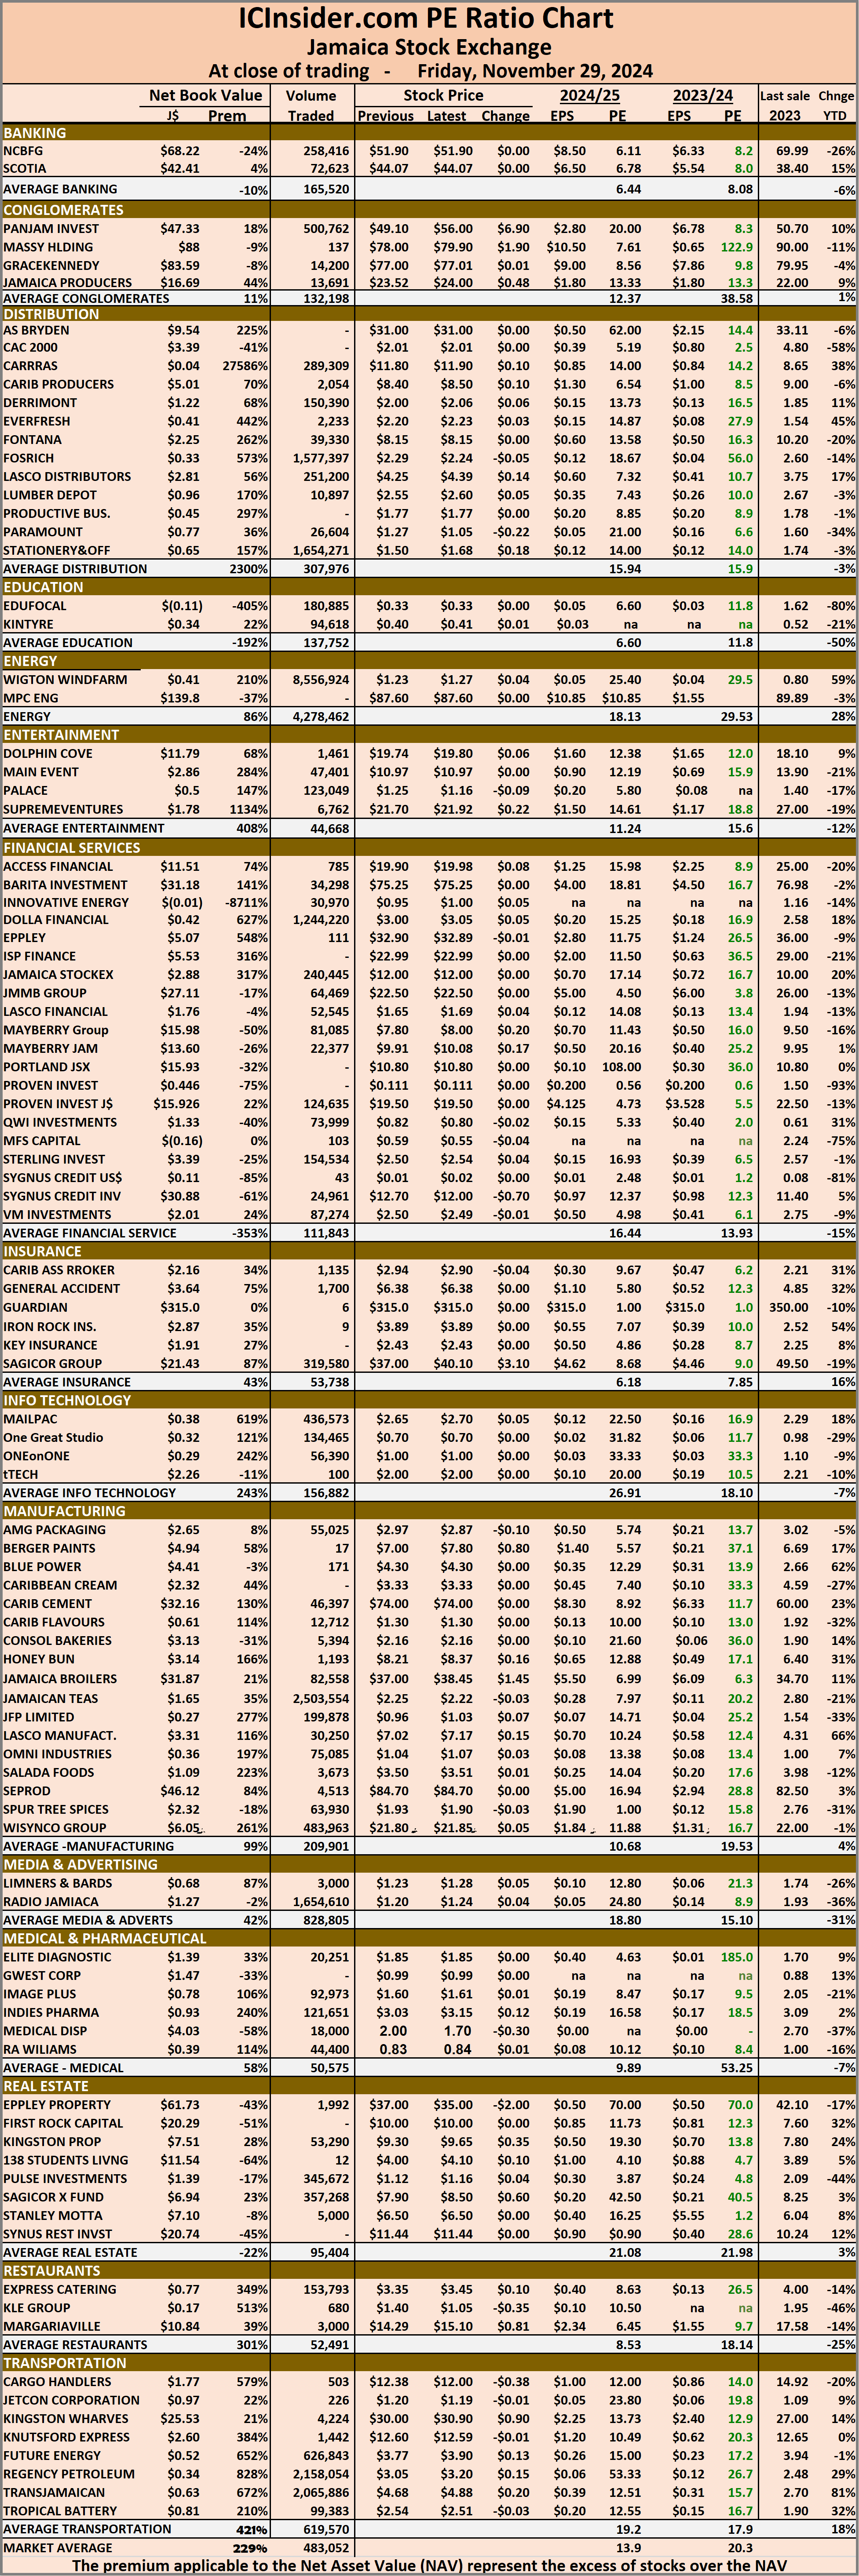 Dividends that are paid or are due to be paid and yields for each company are shown in the Main and Junior Markets’ daily report charts, along with the closing volume of the highest bid and the lowest offer for each company.
 The market closed with 20,497,403 shares being traded at $168,382,641 compared with 23,114,868 stocks at $103,556,387 on Wednesday.
 The Main Market ended trading with an average PE Ratio of 14.3. The JSE Main and USD Market PE ratios are based on last traded prices and earnings forecasts by ICInsider.com for companies with the financial year ending around August 2025.
 Pan Jamaica dropped $2.65 in closing at $49.10 with investors trading 200,142 stock units, Proven Investments advanced 50 cents to end at $19.50 in switching ownership of 119,370 units, Sagicor Group skidded $1 to close at $37 after 2,925 stocks changed hands. Sagicor Real Estate Fund climbed 50 cents to $7.90 with an exchange of 141,901 units, Scotia Group dipped $1.95 and ended at $44.07, with 125,200 stocks crossing the market, Seprod increased 70 cents to end at $84.70 after an exchange of 1,996 shares and Supreme Ventures slipped 59 cents to $21.70 in trading 29,285 stock units.
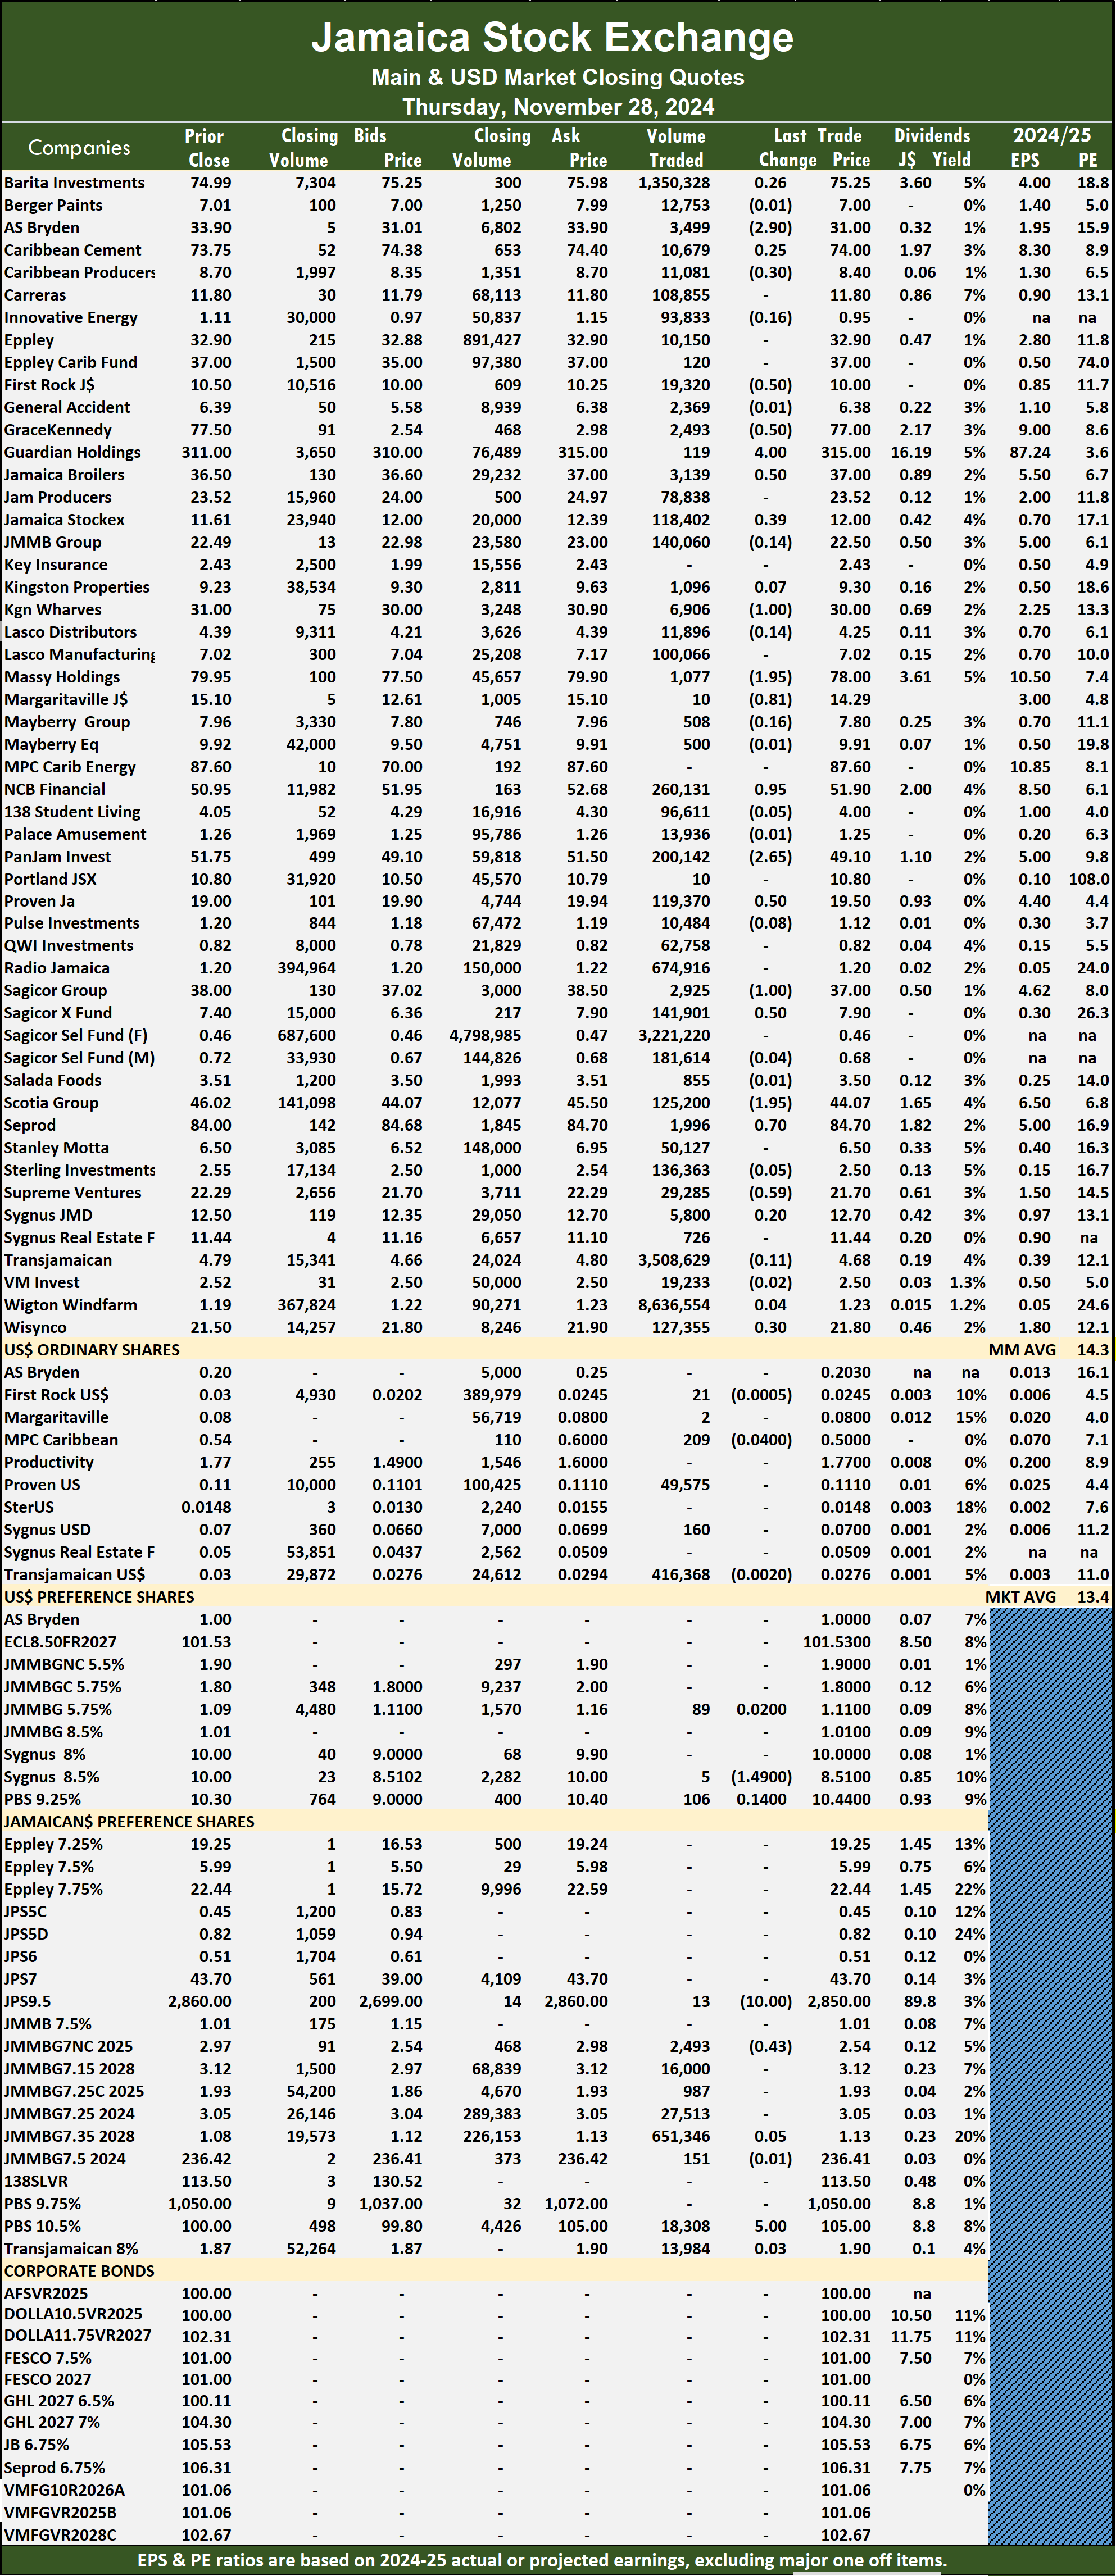 Prices of securities trading are those for the last transaction of each stock unless otherwise stated.
 Investors who buy when the price of a stock is close to the average will find that they are not inclined to overpay for a stock. The net asset value of each company is incorporated into the chart. Investors can use this measure in assessing stock values. The chart also shows daily changes in stock prices and the percentage year to date price movement based on the last traded prices. Dividends that are paid or are due to be paid and yields for each company are shown in the Main and Junior Markets’ daily report charts, along with the closing volume of the highest bid and the lowest offer for each company.
 The market closed with 23,114,868 shares trading for $103,556,387 from 26,500,977 stocks at $154,386,911 on Tuesday. Trading averaged 361,170 shares at $1,618,069 compared with 441,683 stock units at $2,573,115 on Tuesday and for the month to date, an average of 275,256 stock units at $2,382,196 compared with 270,088 shares at $2,428,159 on the previous day and October with an average of 205,025 stock units at $2,311,672.
 The Main Market ended trading with an average PE Ratio of 14. The JSE Main and USD Market PE ratios are based on last traded prices and earnings forecasts by ICInsider.com for companies with the financial year ending around August 2025.
 Sagicor Group popped $1 to finish at $38 after a transfer of 27,011 units, Salada Foods increased 41 cents to end at $3.51 with traders dealing in 3,277 shares, Scotia Group skidded 48 cents in closing at $46.02 in switching ownership of 23,563 stock units. Seprod sank 60 cents to $84 with investors trading 4,823 shares, Stanley Motta shed 45 cents and ended at $6.50 after an exchange of 19,812 units and Sygnus Real Estate Finance climbed 44 cents to end at $11.44 after 10,180 stocks passed through the market.
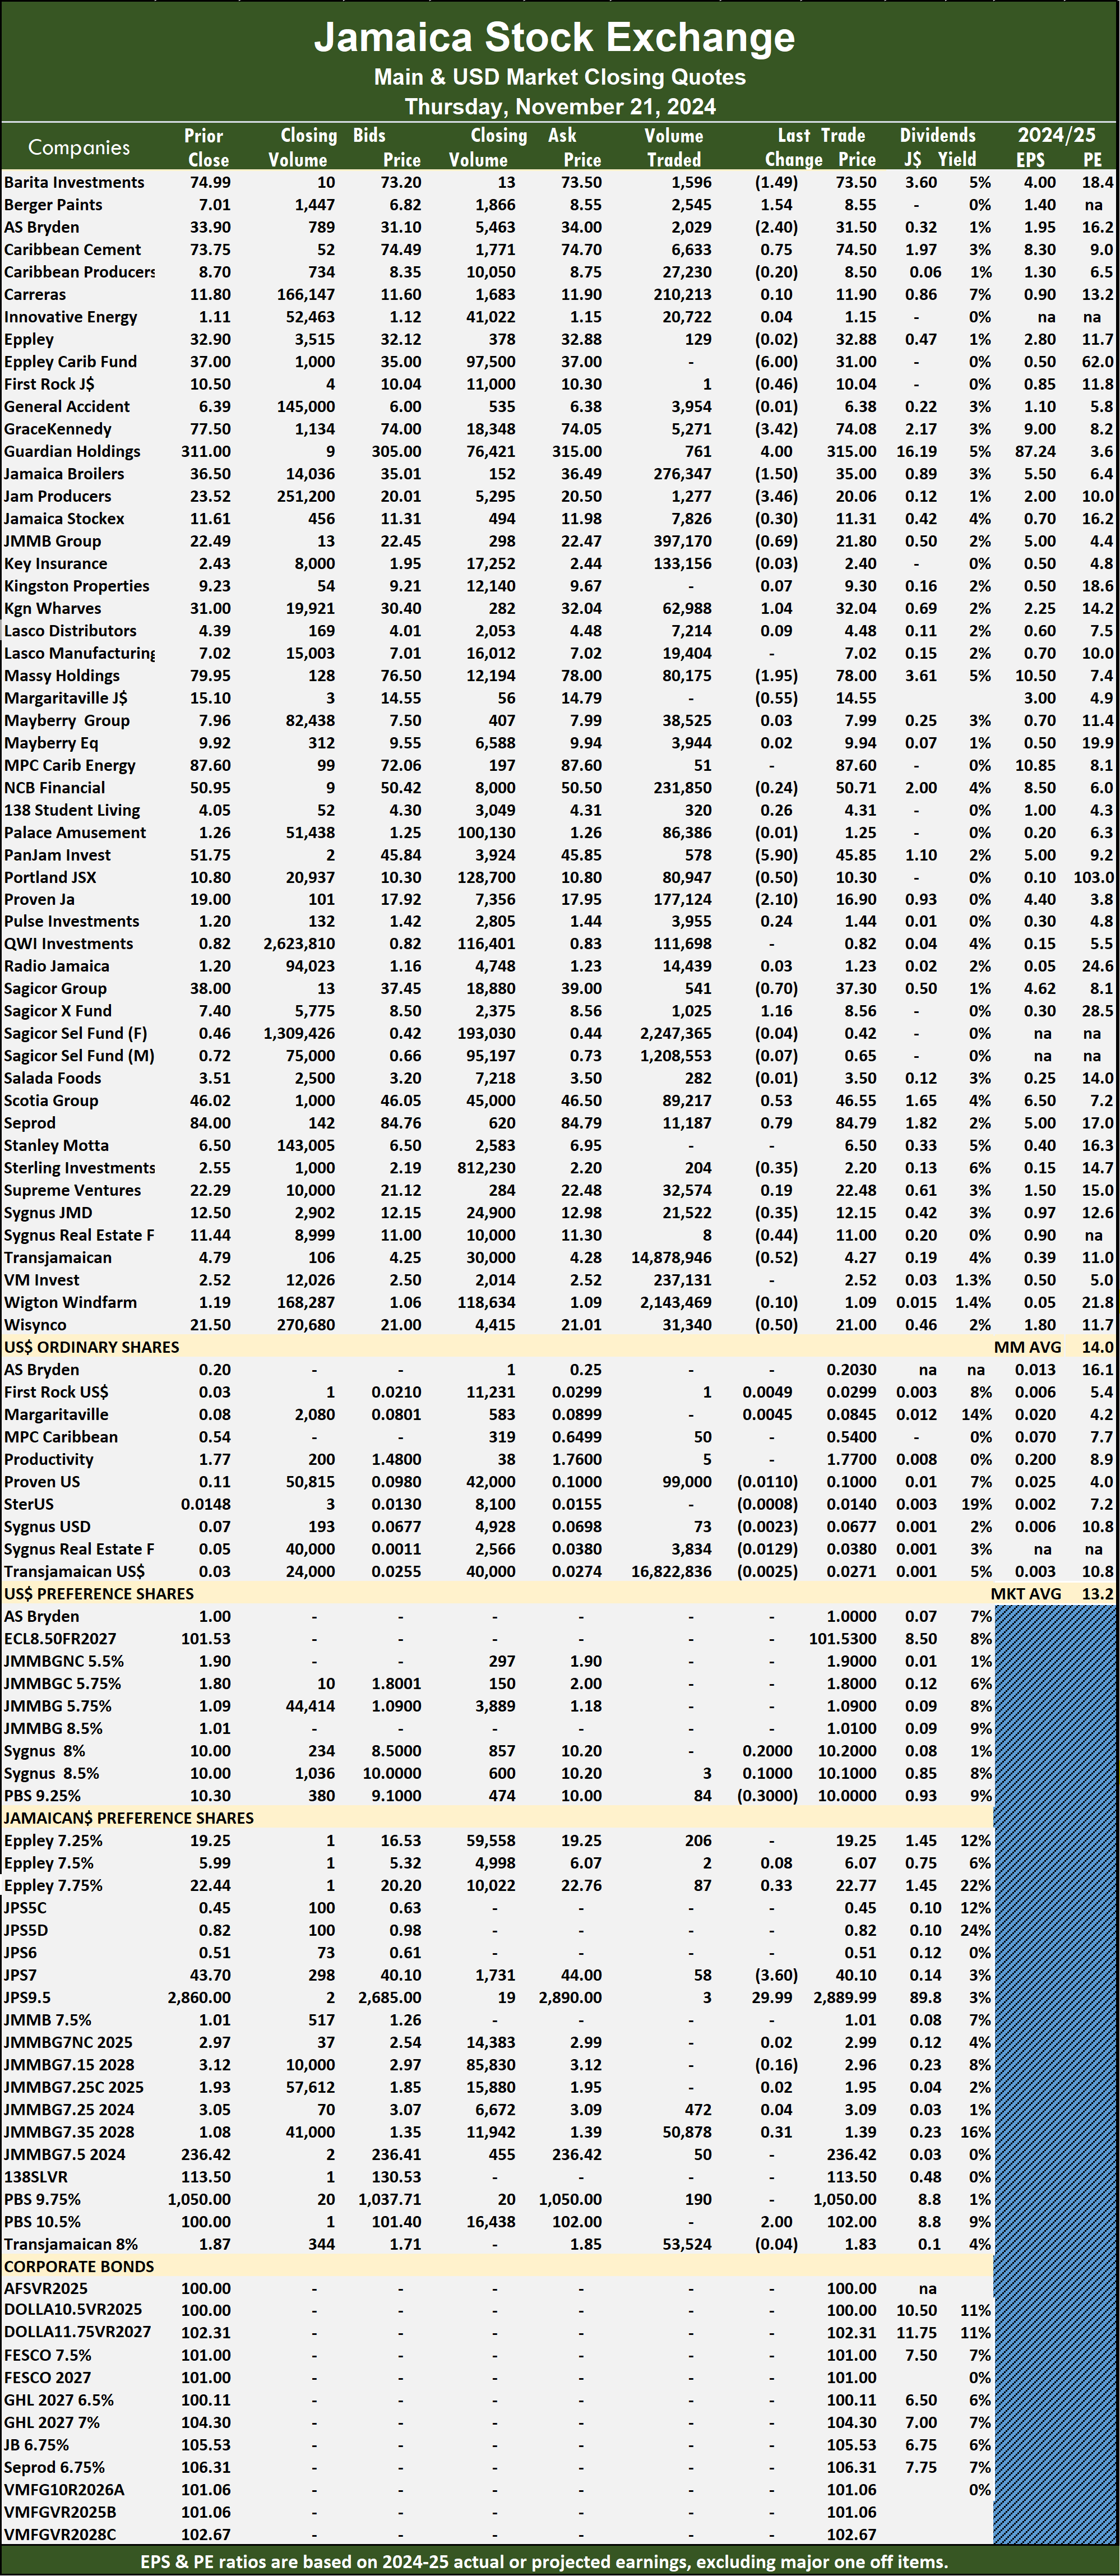 Jamaica Public Service 9.5% declined $29.99 to finish at $2,860 with 10 stocks crossing the market and Productive Business Solutions 10.5% preference share gained $15 to land at $1,050 as investors exchanged 100 units.
 At the close of the market, the JSE Combined Market Index increased 960.27 points to 331,274.49, the All Jamaican Composite Index rallied 1,143.50 points to 365,720.38, the JSE Main Index increased 366.95 points to end trading at 318,587.27, the Junior Market Index gained 84.86 points to close at 3,711.75, and the JSE USD Market Index gained 4.66 points to conclude trading at 252.14.
 The market’s PE ratio, the most popular measure used to value stocks, ended at 13.8 based on projected 2024-25 earnings and 20 based on the 2024-24 historical earnings. The ICInsider.com PE ratio chart and other more detailed daily charts provide investors with regularly updated information to help decision-making. The PE ratio chart covers all ordinary shares on the Jamaica Stock Exchange, grouped by industry, allowing for easy comparisons within a sector and the overall market. The earnings per share (EPS) and PE ratios are based on 2024 and 2024 actual or projected earnings, excluding major time income or expenses.
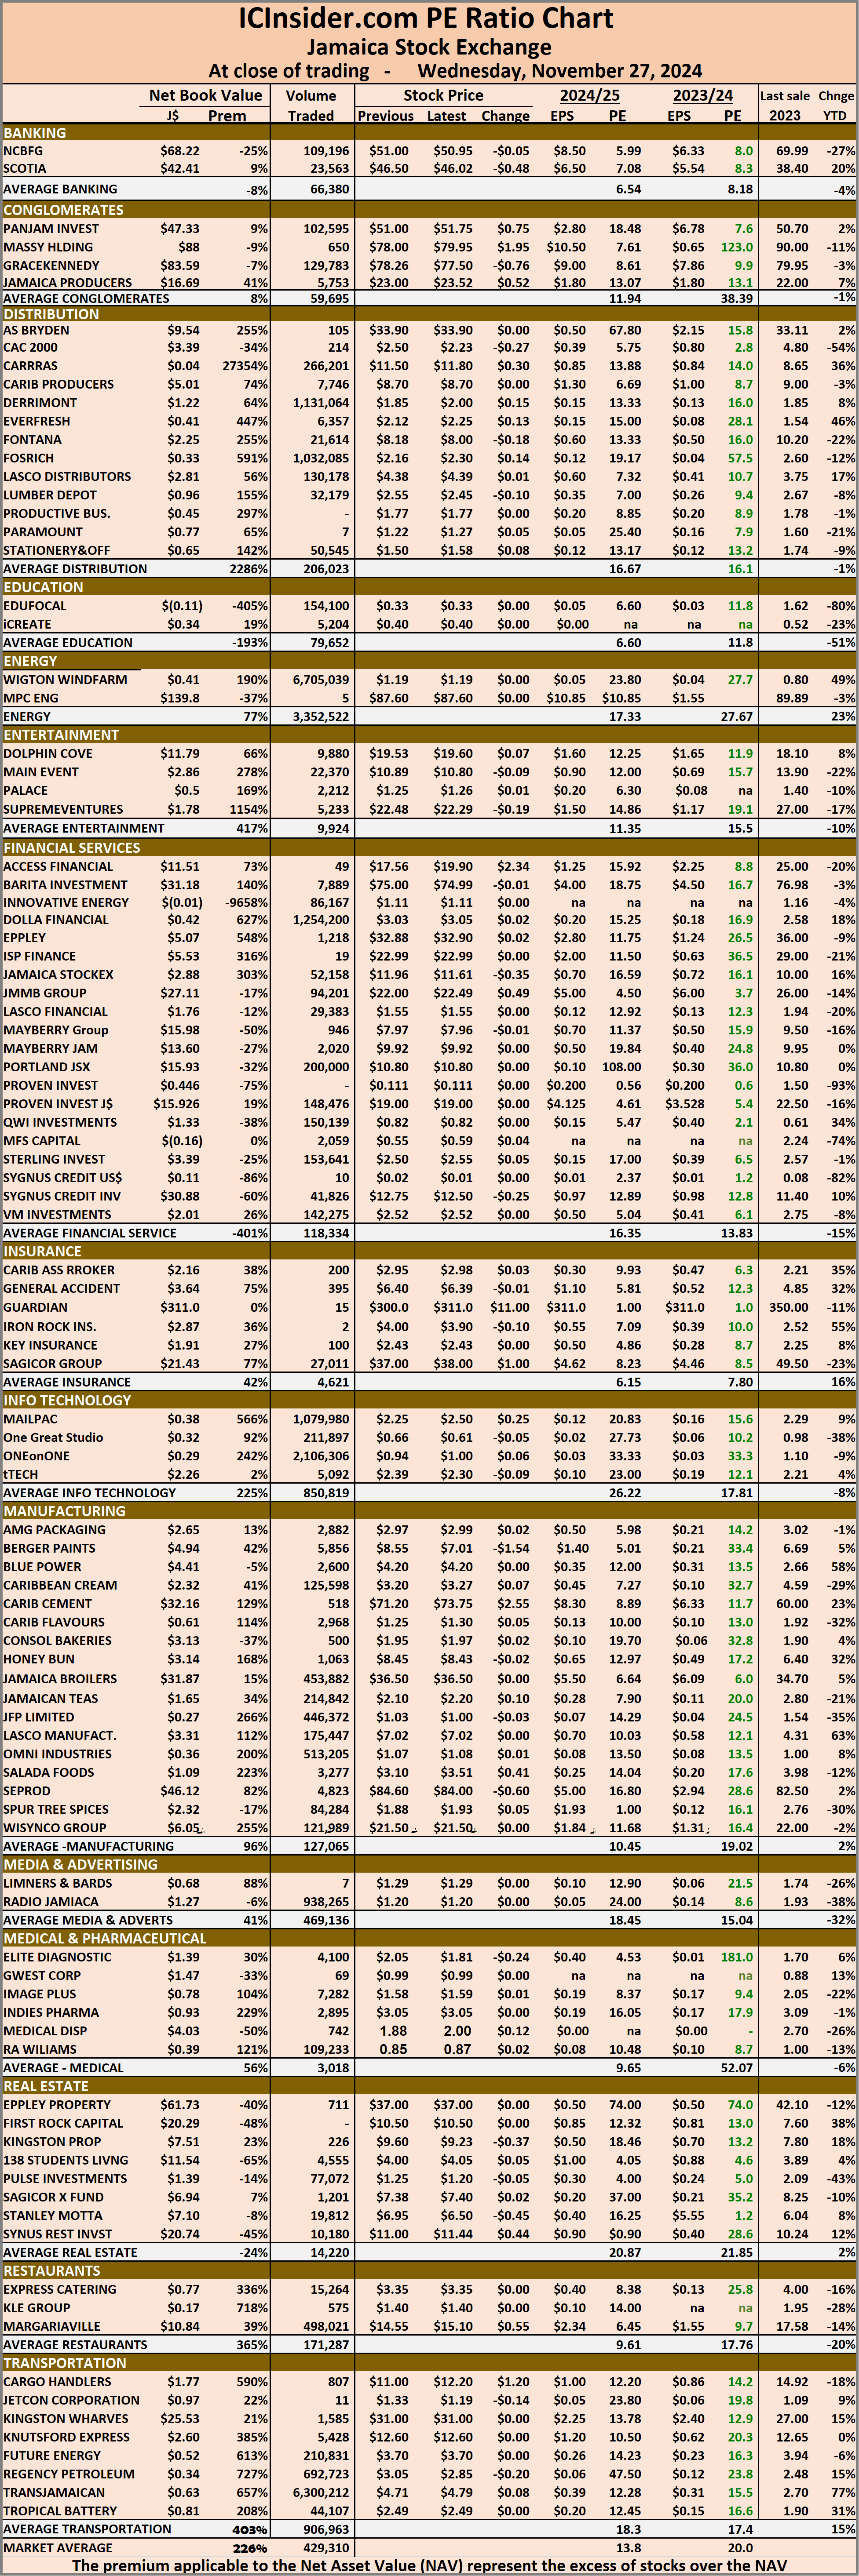 The net asset value of each company is incorporated into the chart. Investors can use this measure in assessing stock values. The chart also shows daily changes in stock prices and the percentage year to date price movement based on the last traded prices. Dividends that are paid or are due to be paid and yields for each company are shown in the Main and Junior Markets’ daily report charts, along with the closing volume of the highest bid and the lowest offer for each company.
 The market closed with trading of 26,500,977 shares at $154,386,911 versus 18,751,570 stock units at $240,793,065 on Monday. Trading ended with an average of 441,683 shares at $2,573,115 compared to 302,445 stocks at $3,883,759 on Monday and for the month to date, an average of 270,088 stock units at $2,428,159 compared to 259,833 shares at $2,419,496 on Tuesday and October with an average of 205,025 stock units at $2,311,672.
 The Main Market ended trading with an average PE Ratio of 14.4. The JSE Main and USD Market PE ratios are based on last traded prices and earnings forecasts by ICInsider.com for companies with the financial year ending around August 2025.
 NCB Financial rallied 50 cents to $51 after an exchange of 149,721 shares, Pan Jamaica rose $1.02 to end at $51 with a transfer of 120,115 units, Proven Investments gained $1.50 in closing at $19 with 124,093 stocks crossing the market. Sagicor Real Estate Fund fell $1.18 to close at $7.38 in an exchange of 14,020 stock units, Salada Foods dropped 40 cents to $3.10 with 11,730 shares being traded, Supreme Ventures advanced 78 cents to finish at $22.48 after transferring 7,199 stocks and Sygnus Real Estate Finance shed 45 cents to close at $11 with investors trading 550 units.
 Productive Business Solutions 10.5% preference share lost $15 to finish at $1,035 with traders dealing in 128 units and Sygnus Credit Investments C10.5% slipped $4.99 to close at $100 in switching ownership of 9,547 stock units.