Investor interest spiked on Wednesday in trading on the Jamaica Stock Exchange US dollar market, resulting in a 267 percent spike in the volume of stocks traded, having a 109 percent greater value than on Tuesday. Trading ended with an exchange of eight securities, compared with seven on Tuesday, with prices of three rising, two declining and three ending unchanged.
 The market closed with an exchange of 108,254 shares for US$4,577 after surging from 29,472 stock units at US$2,193 on Tuesday. Trading averaged 13,532 shares at US$572 with an increase from 4,210 stock units at US$313 on Tuesday, with a month to date average of 48,261 units at US$2,122 after dipping from 53,708 stock units at US$2,365 on the previous day and November that ended with an average of 36,788 units for US$2,343.
The US Denominated Equities Index increased 0.49 points to close trading at 205.75. The Investor’s Choice bid-offer indicator shows one stock ended with a bid higher than the last selling price and one with a lower offer.
The PE Ratio, one of the most used measures to determine appropriate stock values, averages 8.6. The PE ratio is derived by dividing the last traded price by earnings per share. ICInsider.com computes the earnings used for this report for companies with their financial year ending around August 2026.
At the close of the market, First Rock Real Estate USD share ended at 2.99 US cents with investors trading 300 shares, MPC Caribbean Clean Energy sank 4.33 cents to 24.57 US cents with an exchange of 9 stock units,  Proven Investments remained at 8.5 US cents, with 17,003 shares crossing the market. Sterling Investments increased 0.01 of a cent to end at 2 US cents as investors exchanged 5 stocks, Sygnus Real Estate Finance USD share dipped 0.03 of a cent in closing at 5 US cents with a transfer of 8,322 stock units and Transjamaican Highway popped 0.03 of a cent to finish at 3.03 US cents following trading of 82,599 stocks.In the preference segment, Productive Business Solutions 9.25% remained at US$10.90 with 5 shares crossing the exchange and Sygnus Credit Investments 8% advanced by US$1.50 to US$10 with traders dealing in 11 stock units.
Prices of securities trading are those for the last transaction of each stock unless otherwise stated.
 At the close of the market, the JSE Combined Market Index sank 469.63 points to finish at 321,583.35, the All Jamaican Composite Index rose 222.14 points to end at 357,552.34, the JSE Main Index lost 514.79 points to end at 311,676.04, the Junior Market Index held on to a mere 3.23 points to close at 3,285.97, while the JSE USD Market Index rose 0.48 points to 205.75.
 The market’s PE ratio, the most popular measure used to value stocks, ended at 13.9 based on 2025-26 earnings and 14.8 based on 2024 historical earnings.
 The net asset value of each company is incorporated into the chart. Investors can use this measure in assessing stock values. The chart also shows daily changes in stock prices and the percentage year to date price movement based on the last traded prices. Dividends that are paid or are due to be paid and yields for each company are shown in the Main and Junior Markets’ daily report charts, along with the closing volume of the highest bid and the lowest offer for each company.
 The market closed with an exchange of 29,472 shares for US$2,193 after plunging from 1,149,523 stock units at US$39,558 on Monday.
 Sterling Investments remained at 1.99 US cents, after investors exchanged 6,045 shares. Sygnus Credit Investments skidded 0.07 of a cent to end at 6.88 US cents with 1,464 stock units crossing the exchange, Sygnus Real Estate Finance USD share sank 0.75 of one cent in closing at 5.03 US cents after trading of 381 stocks was completed and Transjamaican Highway increased 0.12 of one cent to close at 3 US cents after closing with an exchange of 672 units.
 At the close of the market, the JSE Combined Market Index jumped 2,115.21 points to 322,052.98, the All Jamaican Composite Index rose 2,834.64 points to settle at 357,330.20, the JSE Main Index popped 2,078.92 points to end at 312,190.83, The Junior Market Index advanced 17.73 points to 3,282.74 and the JSE USD Market Index rose 3.18 points to 205.27.
 The market’s PE ratio, the most popular measure used to value stocks, ended at 13.8 based on 2025-26 earnings and 15 using 2024 historical earnings. The ICInsider.com PE ratio chart and the more detailed daily charts provide investors with updated data to help decision-making. The PE ratio chart covers all ordinary shares listed on the Jamaica Stock Exchange, grouped by industry, while allowing for easy comparisons within a sector and the overall market. The earnings per share (EPS) and PE ratios are based on 2024 and 2025 actual or projected earnings, excluding any major one time income or expense.
 The net asset value of each company is incorporated into the chart. Investors can use this measure in assessing stock values. The chart also shows daily changes in stock prices and the percentage year to date price movements based on the last traded prices. Dividends that are paid or are payable and yields for each company are shown in the Main and Junior Markets’ daily report charts, along with the closing volume of the highest bid and the lowest offer for each compa
 The market closed with an exchange of 1,149,523 shares for US$39,558 after leaping from 285,516 units at US$19,881 on Friday.
 Proven Investments shed 0.99 of one cent to finish at 9 US cents in trading 20,776 stock units, while Sygnus Credit Investments ended at 6.95 US cents after a transfer of 122,048 stock units, Sygnus Real Estate Finance USD share declined 0.22 of a cent in closing at 5.78 US cents with 60 shares crossing the market and Transjamaican Highway sank 0.02 of a cent to 2.88 US cents with an exchange of 1,006,080 stock units.
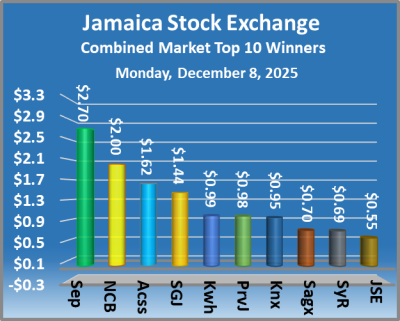 The JSE Combined Market Index sank 3,560.08 points to conclude at 319,937.77, the All Jamaican Composite Index dived 4,054.61 points to 354,495.56, the JSE Main Index dropped 3,485.16 points to wrap up trading at 310,111.91, the Junior Market Index shed 31.70 points to finish at 3,265.01 and the JSE USD Market Index slipped 2.29 points to 202.09.
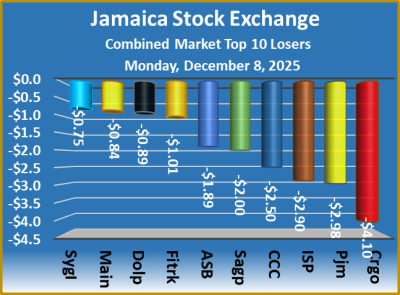 The ICInsider.com PE ratio chart and the more detailed daily charts provide investors with regularly updated information to help decision-making.
 The net asset value of each company is incorporated into the chart. Investors can use this measure in assessing stock values. The chart also shows daily changes in stock prices and the percentage year to date price movement based on the last traded prices. Dividends that are declared or paid and yields for each company are shown in the Main and Junior Markets’ daily report charts, along with the closing volume of the highest bid and the lowest offer for each company.
 Productive Business Solutions popped 14.04 cents to 92 US cents, with investors trading 140 stock units, Proven Investments increased 0.99 of a cent to finish at 9.99 US cents with 6,998 shares being traded. Sterling Investments ended at 1.99 US cents with 26,322 stock units, being traded, Sygnus Credit Investments dipped 0.05 of a cent to 6.95 US cents after an exchange of 57,698 stock units and Transjamaican Highway ended at 2.9 US cents after trading of 186,934 shares.
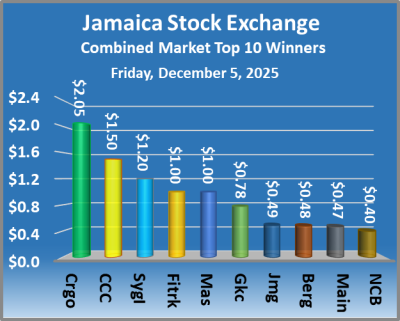 At the close of the market, the JSE Combined Market Index declined 1,005.12 points to 323,497.85, the All Jamaican Composite Index dropped 1,948.53 points to close at 358,550.17, the JSE Main Index dipped 1,151.15 points to finish trading at 313,597.07, the Junior Market Index rose 13.57 points to end at 3,296.71 and the JSE USD Market Index increased 6.04 points to 204.38.
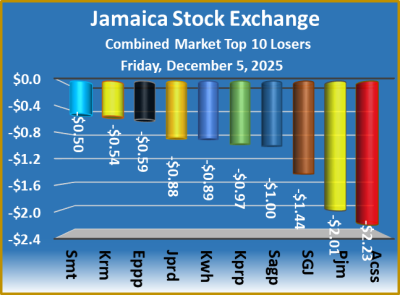 The market’s PE ratio, the most popular measure used to value stocks, ended at 13.8 based on 2025-26 earnings and 15 based on 2024 historical earnings. The ICInsider.com PE ratio chart and the other, more detailed daily charts provide investors with regularly updated information to help decision-making. The PE ratio chart covers all ordinary shares listed on the Jamaica Stock Exchange, grouped by industry, for easy comparisons within a sector and the overall market. The earnings per share (EPS) and PE ratios are based on 2024 and 2025 actual or projected earnings, excluding any major one time income or expense.
 Investors who buy when the price of a stock is close to the average will find that they are not inclined to overpay for a stock. The net asset value of each company is incorporated into the chart. Investors can use this measure in assessing stock values. The chart also shows daily changes in stock prices and the percentage year to date price movements based on the last traded prices. Dividends that are paid or are due to be paid and yields for each
 The market closed with an exchange of 221,178 shares for US$11,156, up slightly from 220,029 stock units at US$8,175 on Wednesday.
 Sterling Investments sank 0.01 of a cent and ended at 1.99 US cents with 71 shares crossing the market. Sygnus Credit Investments shed 0.1 of a cent to finish at 7 US cents with investors swapping 35,032 stock units, Sygnus Real Estate Finance USD share climbed 1.04 cents in closing at 6 US cents with 10,467 stock units clearing the market and Transjamaican Highway sank 0.09 of a cent to end at 2.9 US cents with investors trading 125,823 shares.
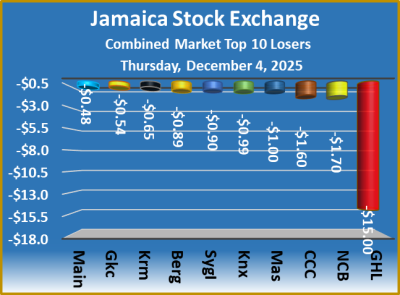
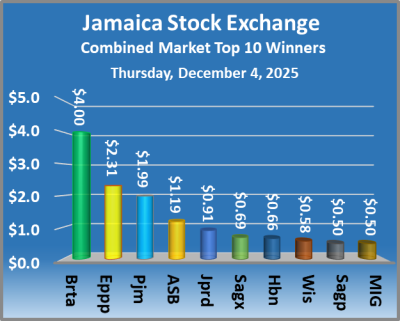 At the close of trading, major indices of the Main Market rose, the Junior Market index and the JSE USD Market declined. The JSE Combined Market Index rose 623.80 points to 324,502.97, the All Jamaican Composite Index jumped 2,416.15 points to 360,498.70, the JSE Main Index rallied 701.10 points to end at 314,748.22, the Junior Market Index slid 6.62 points to 3,283.14 and the JSE USD Market Index declined 3.10 points to 198.34.
 The market’s PE ratio, the most popular measure used to value stocks, ended at 13.8 based on 2025-26 earnings and 14.7 based on 2024 historical earnings. The ICInsider.com PE ratio chart and the more detailed daily charts provide investors with regularly updated information to help in making investment decisions. The PE ratio chart covers the ordinary shares that are quoted on the Jamaica Stock Exchange, and are grouped by industry, allowing for easy comparisons within a sector and the overall market. The earnings per share (EPS) and PE ratios are based on 2024 actual earnings and 2025 projected earnings, excluding major one time income or expense.
 The net asset value of each company is incorporated into the chart. Investors can use this measure in assessing stock values. The chart also shows daily changes in stock prices and the percentage year to date price movement based on the last traded prices. Dividends that are paid or are due to be paid and yields for each company are shown in the Main and Junior Markets’ daily report charts, along with the closing volume of the highest bid and the lowest offer for each company.