The Jamaica Stock Exchange US dollar market ended on Friday with little movement in the market index even as the number of securities traded climbed to 13 from 11 on Thursday and ended with prices of four rising, two declining to leave seven unchanged and resulting in the volume of stocks changing hands rising 585 percent and valued 19 percent more than on Thursday.
 At the close, the JSE US Denominated Equities Index slipped a mere 0.04 points to end at 233.81.
Overall, 278,776 shares were traded for US$11,314, up from 40,710 units at US$9,508 on Thursday.
Trading averaged 21,444 units at US$870, versus 3,701 shares at US$864 on Thursday, with month to date average of 34,801 shares at US$934 compared with 41,747 units at US$966 on the previous day. December ended with an average of 39,679 units for US$1,494.
The PE Ratio, a measure used in computing appropriate stock values, averages 8.6. The PE ratio uses ICInsider.com earnings forecasts for companies with financial years ending between November and August 2023. Investor’s Choice bid-offer indicator shows no stock ended with a bid higher than the last selling price and one with a lower offer.
At the close, First Rock Real Estate USD share rose 0.06 of a cent in closing at 7.76 US cents in trading 6,631 shares, MPC Caribbean Clean Energy ended at 65 US cents while exchanging 319 units, Productive Business Solutions shed 10.39 cents to end at US$1.70 237 stocks clearing the market with. Proven Investments climbed 0.79 of a cent to 19.3 US cents, with 894 stock units changing hands,  Sterling Investments lost 0.02 of a cent in ending at 2.06 US cents after trading 9,700 units, Sygnus Real Estate Finance USD share rallied 1.48 cents to 12.48 US cents as investors exchanged 30 stock units and Transjamaican Highway remained at 0.97 of a US cent in switching ownership of 257,389 stocks.
In the preference segment, Productive Business 9.25% preference share ended at US$12 after trading 20 shares, Eppley 6% preference share remained at US$1.07 after exchanging three stocks. Equityline Mortgage Investment preference share remained at US$1.67 after a transfer of 2 units, JMMB Group 5.75% popped 1 cent to close at US$1.51 after 45 shares passed through the market, JMMB Group 5.75% series C share ended at US$2, with 3,500 stock units crossing the market and JMMB Group 6% ended at US$1.10 with six shares changing hands.
Prices of securities trading are those for the last transaction of each stock unless otherwise stated.
Trading up on the JSE USD Market
JSE Main Market climbs as volume spikes
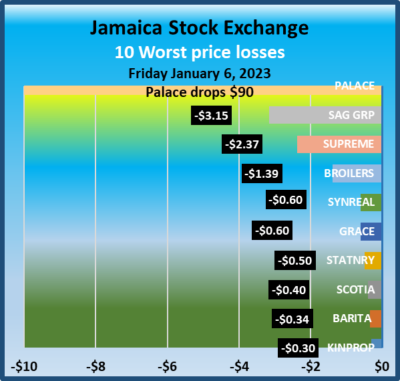
The Jamaica Stock Exchange enjoyed a nice bounce on Friday, with a rising Main Market as trading picked up sharply over the miniscule levels on Thursday, with the value of shares traded surging as well following an exchange of $84 million worth of shares in Massy Holdings and $62 million worth of PanJam Investment shares.
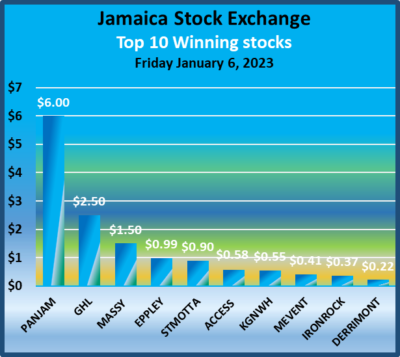 At the close of trading the Main Market indices bounced more than the fall on Thursday, but the Junior Market lost some ground giving up all of Thursday’s gains and the JSE USD market remained virtually flat at the close after slipping a few points.
Trading ended, with an exchange of 17,408,795 shares up from 13,188,780 units on Thursday, with the value rising sharply to $217.47 million up from $40 million on the previous day. The JSE USD market ended with the value of stocks traded amounting to US$11,314 up from US$9,508 on Thursday.
At the close, the Combined Market Index dropped 2,398.34 points to 360,607.78, the All Jamaican Composite Index fell 2,146.48 points to 396,043.87, the JSE Main Index shed 2,768.71 points to 348,180.63, the Junior Market fell 20.07 points to 3,900.78 and the JSE US dollar market closed at 233.85 after slipping 0.04 points.
 The market’s PE ratio ended at 22.4 based on 2021-22 earnings and 13.4 times those for 2022-23 at the close of trading.
Investors need pertinent information to successfully navigate many investment options in the local stock market. The ICInsider.com PE ratio chart and the more detailed daily report charts provide investors with regularly updated information to help decision-making.
Investors should use the chart to help make rational investment decisions by investing in stocks close to the average for the sector and not going too far from it unless there are compelling reasons to do so. This approach helps to remove emotions from investment decisions and put in on fundamentals while at the same time not being too far from the majority of investors. Investors who buy when the price of a stock is close to the average will find that they are not inclined to overpay for a stock.
The ICInsider.com PE Ratio chart covers all ordinary shares on the Jamaica Stock Exchange. It shows companies grouped on an industry basis, allowing easy comparisons between the same sector companies and the overall market.
The net asset value of each company is reported as a guide to assess the value of stocks based on this measure quickly. The chart also shows daily changes in stock prices and the percentage year to date price movement based on the last traded prices. 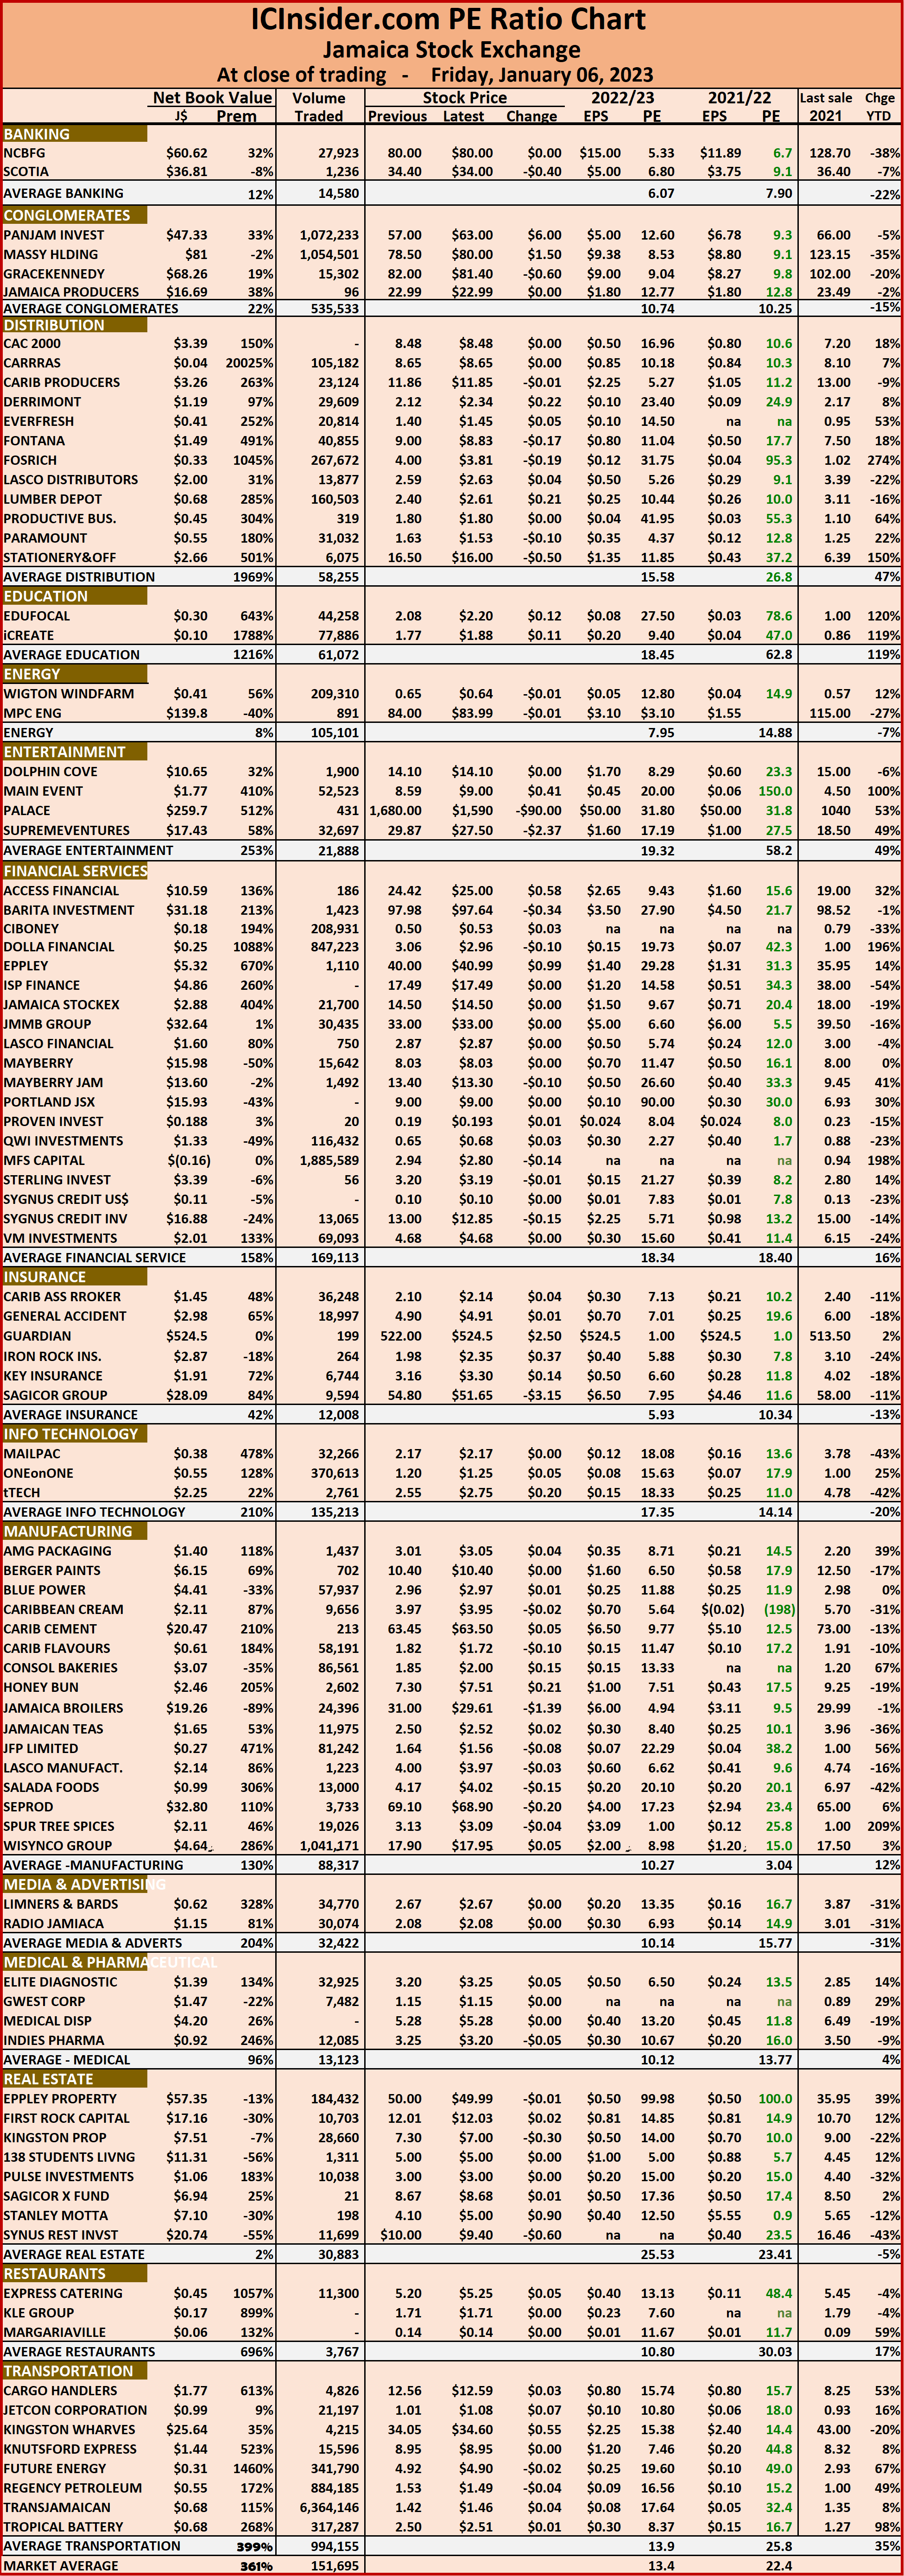 Dividends payable and yields for each company are shown in the Main and Junior Markets’ daily report charts that show the closing volume for the bids and offers.
The EPS & PE ratios are based on 2021 and 2022 actual or projected earnings, excluding major one off items. The PE Ratio is the most popular measure used to determine the value of stocks.
Juniors rise majors fall
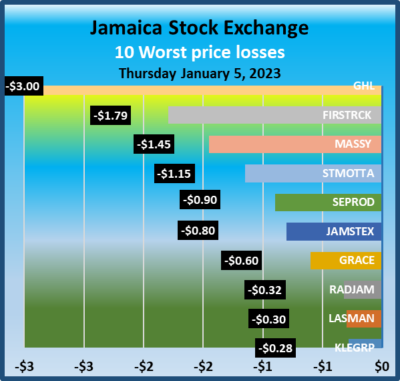
Stocks mostly fell on the JSE Main Market on Thursday, for a second day but vastly less than the significant drop on Wednesday, while the Junior Market recovered some lost grounds suffered over the past two days and the JSE USD market remained flat at the close.
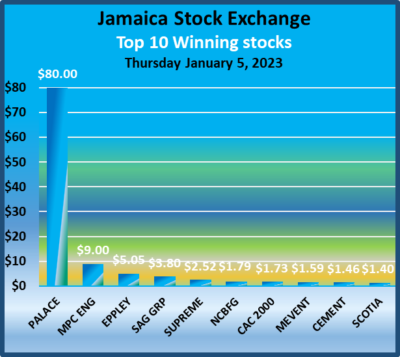 Trading ended with an exchange of 13,188,780 shares from 18,423,695 units on Wednesday, with a value dropping sharply to just $40 million down from $84.7 million on the previous day. The JSE USD market ended with the value of stocks traded amounting to US$9,508 up from US$3,524 on Wednesday.
At the close, the Combined Market Index fell 1,440.80 points to 358,209.44 the All Jamaican Composite Index dropped 2,146.48 points to 392,484.67, the JSE Main Index shed 1,737.67 points to 345,411.92, the Junior Market index rose 19.61 points to 3,920.85 and the JSE US dollar market closed unchanged at 233.85.
The market’s PE ratio ended at 21.1 based on 2021-22 earnings and 13.2 times those for 2022-23 at the close of trading.
 Investors need pertinent information to successfully navigate many investment options in the local stock market. The ICInsider.com PE ratio chart and the more detailed daily report charts provide investors with regularly updated information to help decision-making.
Investors should use the chart to help make rational investment decisions by investing in stocks close to the average for the sector and not going too far from it unless there are compelling reasons to do so. This approach helps to remove emotions from investment decisions and put in on fundamentals while at the same time not being too far from the majority of investors. Investors who buy when the price of a stock is close to the average will find that they are not inclined to overpay for a stock.
The ICInsider.com PE Ratio chart covers all ordinary shares on the Jamaica Stock Exchange. It shows companies grouped on an industry basis, allowing easy comparisons between the same sector companies and the overall market.
The net asset value of each company is reported as a guide to assess the value of stocks based on this measure quickly. The chart also shows daily changes in stock prices and the percentage year to date price movement based on the last traded prices. 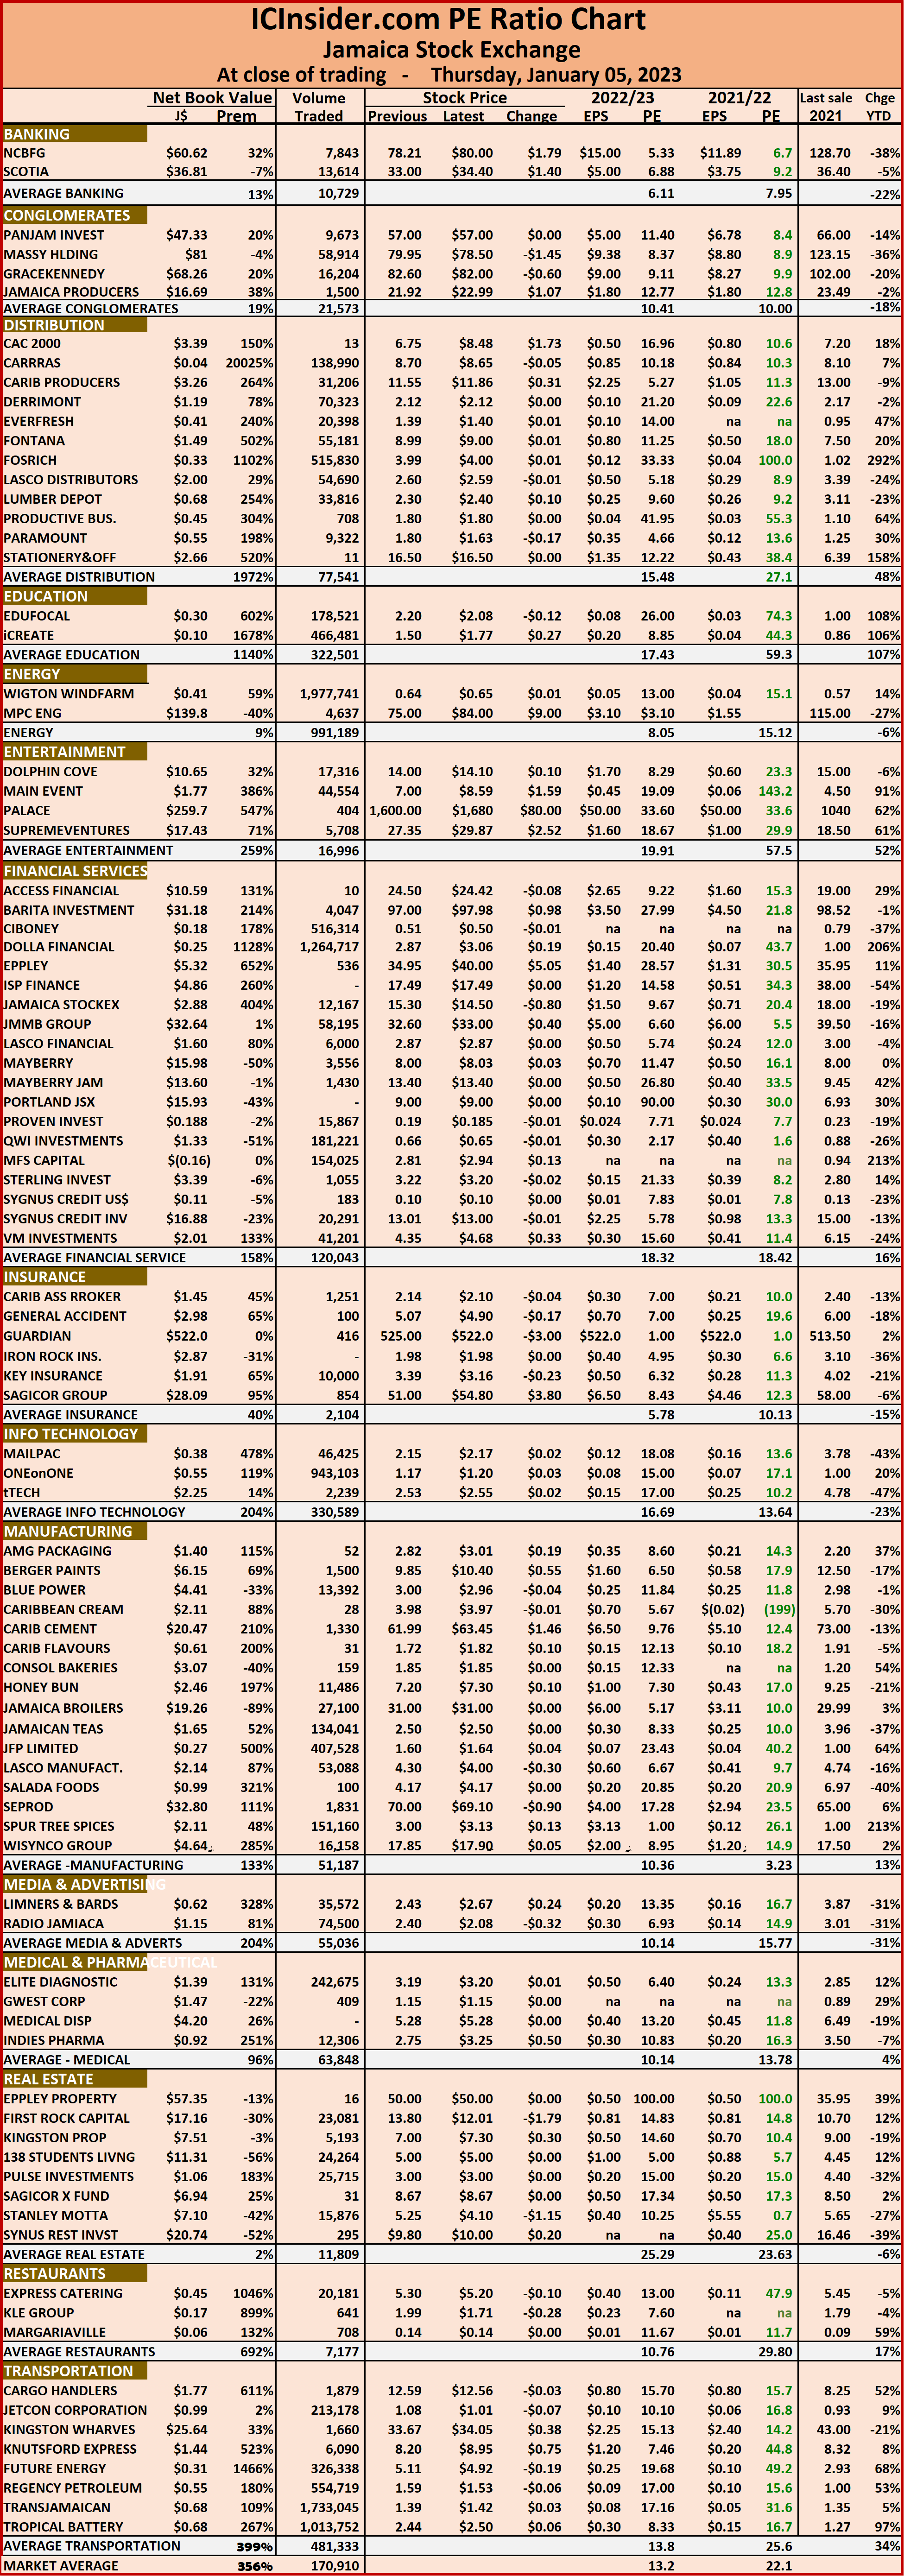 Dividends payable and yields for each company are shown in the Main and Junior Markets’ daily report charts that show the closing volume for the bids and offers.
The EPS & PE ratios are based on 2021 and 2022 actual or projected earnings, excluding major one off items. The PE Ratio is the most popular measure used to determine the value of stocks.
All JSE Markets drop
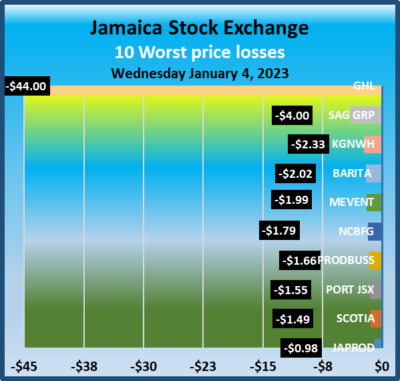
All JSE Markets dropped as stocks mostly fell on Wednesday, with the JSE Main Market breaking its winning streak from the last two weeks, while the Junior Market slipped further for a second trading day and the JSE USD market dipped a few points after being in positive territory until the dying minutes of trading.
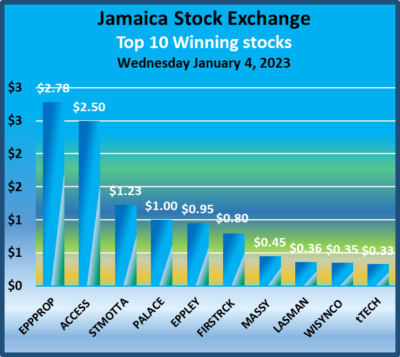 Trading ended, with an exchange of 18,423,695 shares from 16,287,615 units on Tuesday, with the value dropping to $84.7 million down from $87.4 million on the previous day. The JSE USD market ended with the value of stocks traded amounting to US$3,524 down from US$11,129 on Tuesday.
At the close, the Combined Market Index dropped 8,910.35 points to 359,650.24, the All Jamaican Composite Index dived 9,718.27 points to 394,631.15, the JSE Main Index shed 9,089.39 points to 347,149.59, the Junior Market dropped 47.01 points to 3,901.24 and the JSE US dollar market dipped 0.57 points to 233.85.
The market’s PE ratio ended at 21.1 based on 2021-22 earnings and 12.9 times those for 2022-23 at the close of trading.
 Investors need pertinent information to successfully navigate many investment options in the local stock market. The ICInsider.com PE ratio chart and the more detailed daily report charts provide investors with regularly updated information to help decision-making.
Investors should use the chart to help make rational investment decisions by investing in stocks close to the average for the sector and not going too far from it unless there are compelling reasons to do so. This approach helps to remove emotions from investment decisions and put in on fundamentals while at the same time not being too far from the majority of investors. Investors who buy when the price of a stock is close to the average will find that they are not inclined to overpay for a stock.
The ICInsider.com PE Ratio chart covers all ordinary shares on the Jamaica Stock Exchange. It shows companies grouped on an industry basis, allowing easy comparisons between the same sector companies and the overall market.
The net asset value of each company is reported as a guide to assess the value of stocks based on this measure quickly. The chart also shows daily changes in stock prices and the percentage year to date price movement based on the last traded prices. Dividends payable and yields for each company are shown in the 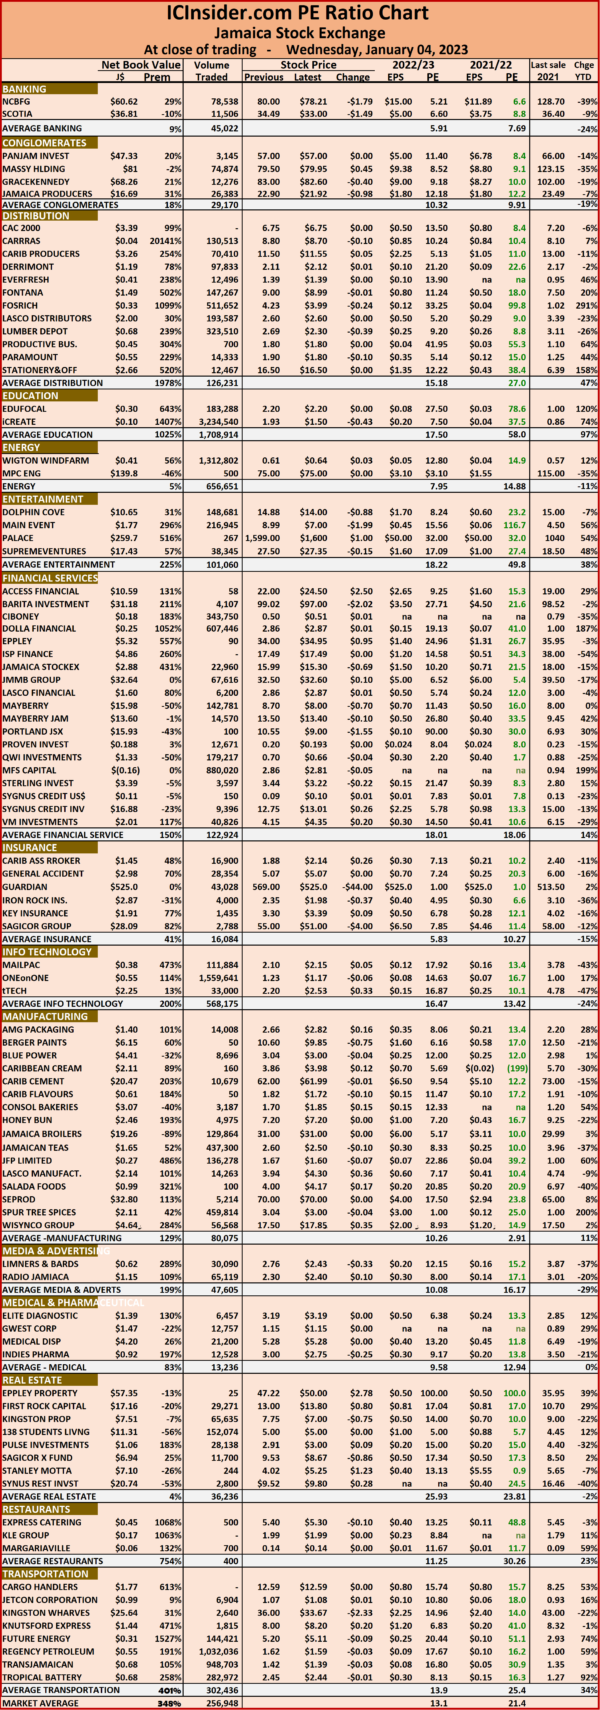 Main and Junior Markets’ daily report charts that show the closing volume for the bids and offers.
The EPS & PE ratios are based on 2021 and 2022 actual or projected earnings, excluding major one off items. The PE Ratio is the most popular measure used to determine the value of stocks.
JSE Main Market up Juniors down
The JSE Main Market continued its winning streak from the last two weeks of 2022 and the JSE USD market popped a few points to start off 2023 on a winning note, but the Junior Market fell more than 50 points to give back quite a bit of Friday’s gains.
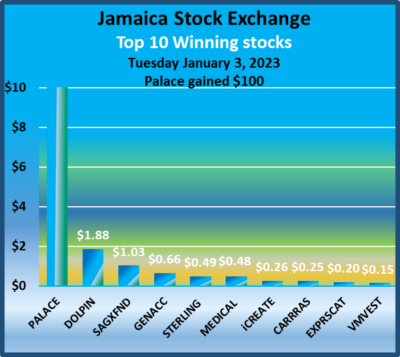 Trading ended, with an exchange of 16,287,615 shares from 205,547,234 units on Friday, with a value dropping sharply to $87.4 million down from $1.62 billion on the previous trading day. The JSE USD market ended with the value of stocks traded amounting to US$11,129 up from US$5,053 on Friday.
At the close, the Combined Market Index dipped 31.39 points to 368,560.59, the All Jamaican Composite Index rose 1,269.06 points to 404,349.42, the JSE Main Index rallied 342.34 points to 356,238.98, the Junior Market dropped 38.19 points to 3,948.25 and the JSE US dollar market popped 0.45 points to 234.42.
The market’s PE ratio ended at 22.4 based on 2021-22 earnings and 13.3 times those for 2022-23 at the close of trading.
Investors need pertinent information to successfully navigate many investment options in the local stock market. 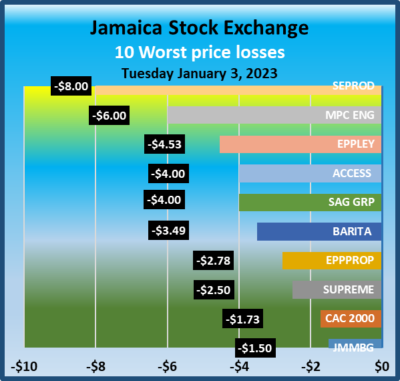 The ICInsider.com PE ratio chart and the more detailed daily report charts provide investors with regularly updated information to help decision-making.
Investors should use the chart to help make rational investment decisions by investing in stocks close to the average for the sector and not going too far from it unless there are compelling reasons to do so. This approach helps to remove emotions from investment decisions and put in on fundamentals while at the same time not being too far from the majority of investors. Investors who buy when the price of a stock is close to the average will find that they are not inclined to overpay for a stock.
The ICInsider.com PE Ratio chart covers all ordinary shares on the Jamaica Stock Exchange. It shows companies grouped on an industry basis, allowing easy comparisons between the same sector companies and the overall market.
The net asset value of each company is reported as a guide to assess the value of stocks based on this measure quickly. The chart also shows daily changes in stock prices and the percentage year to date price movement based on the last traded prices. Dividends payable and yields for each company are shown in the 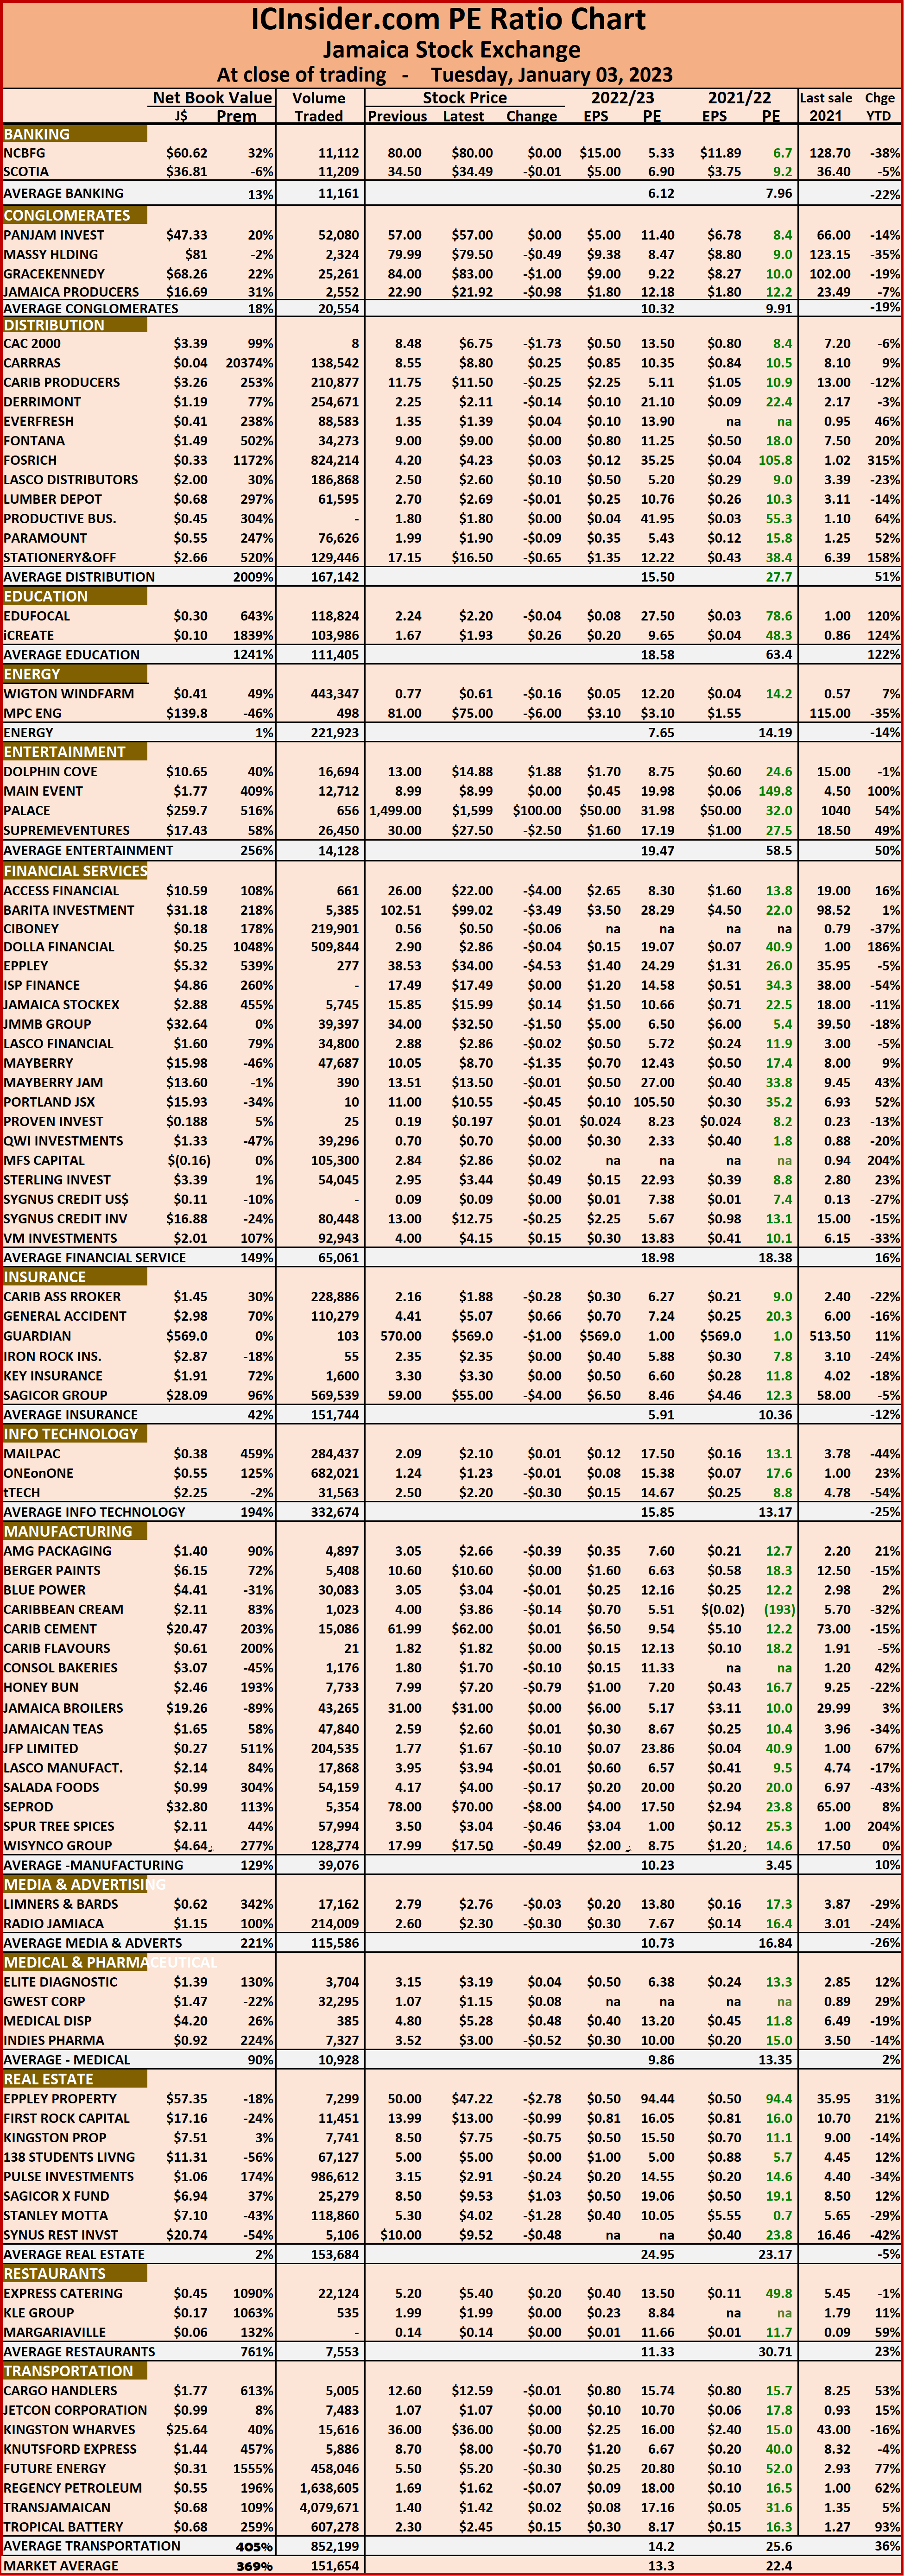 Main and Junior Markets’ daily report charts that show the closing volume for the bids and offers.
The EPS & PE ratios are based on 2021 and 2022 actual or projected earnings, excluding major one off items. The PE Ratio is the most popular measure used to determine the value of stocks.
JSE All Jamaica jumps 18,791 points in 2 days
The JSE Main Market enjoyed another big day of trading on Friday to close out the year with strong two days gains, while the Junior Market jumped to sit just below the 4,000 index mark as it closed the year with gains that were less than that of 2021. The US dollar market index had a mild bounce as the year ended with that market rising 19.7 percent for the year.
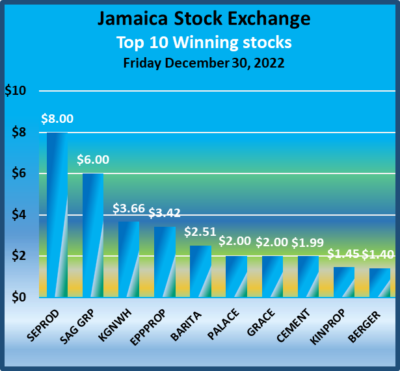 Trading ended with an exchange of 205,547,234s hares from 19,368,737 units on Thursday, valued at $1.62 billion versus $113.6 million on the previous day. Kingston Properties contributed the most to trading, with 136 million changing hands for $1.05 billion. The JSE USD market ended with the value of stocks traded amounting to US$5,053 up from US$42,021 on Thursday.
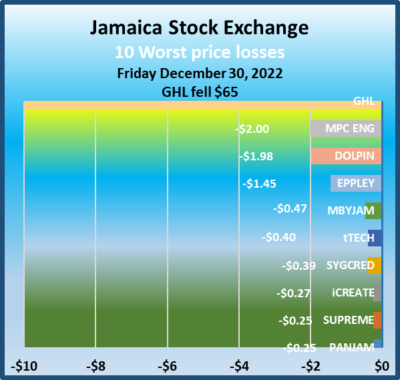
At the close, the Combined Market Index jumped 5,046.42 points to 368,591.98, the All Jamaican Composite Index surged 8,864.59 points to 403,080.36, the JSE Main Index climbed 4,672.83 points to 355,896.64, the Junior Market jumped 74.89 points to 3,986.44 and the JSE US dollar market popped 2.39 points to 233.97.
The market’s PE ratio ended at 22.8 based on 2021-22 earnings and 13.7 times those for 2022-23 at the close of trading.
 Investors need pertinent information to successfully navigate many investment options in the local stock market. The ICInsider.com PE ratio chart and the more detailed daily report charts provide investors with regularly updated information to help decision-making.
Investors should use the chart to help make rational investment decisions by investing in stocks close to the average for the sector and not going too far from it unless there are compelling reasons to do so. This approach helps to remove emotions from investment decisions and put in on fundamentals while at the same time not being too far from the majority of investors. Investors who buy when the price of a stock is close to the average will find that they are not inclined to overpay for a stock.
The ICInsider.com PE Ratio chart covers all ordinary shares on the Jamaica Stock Exchange. It shows companies grouped on an industry basis, allowing easy comparisons between the same sector companies and the overall market.
The net asset value of each company is reported as a guide to assess the value of stocks based on this measure quickly. The chart also shows daily changes in stock prices and the percentage year to date price movement based on the last traded prices. 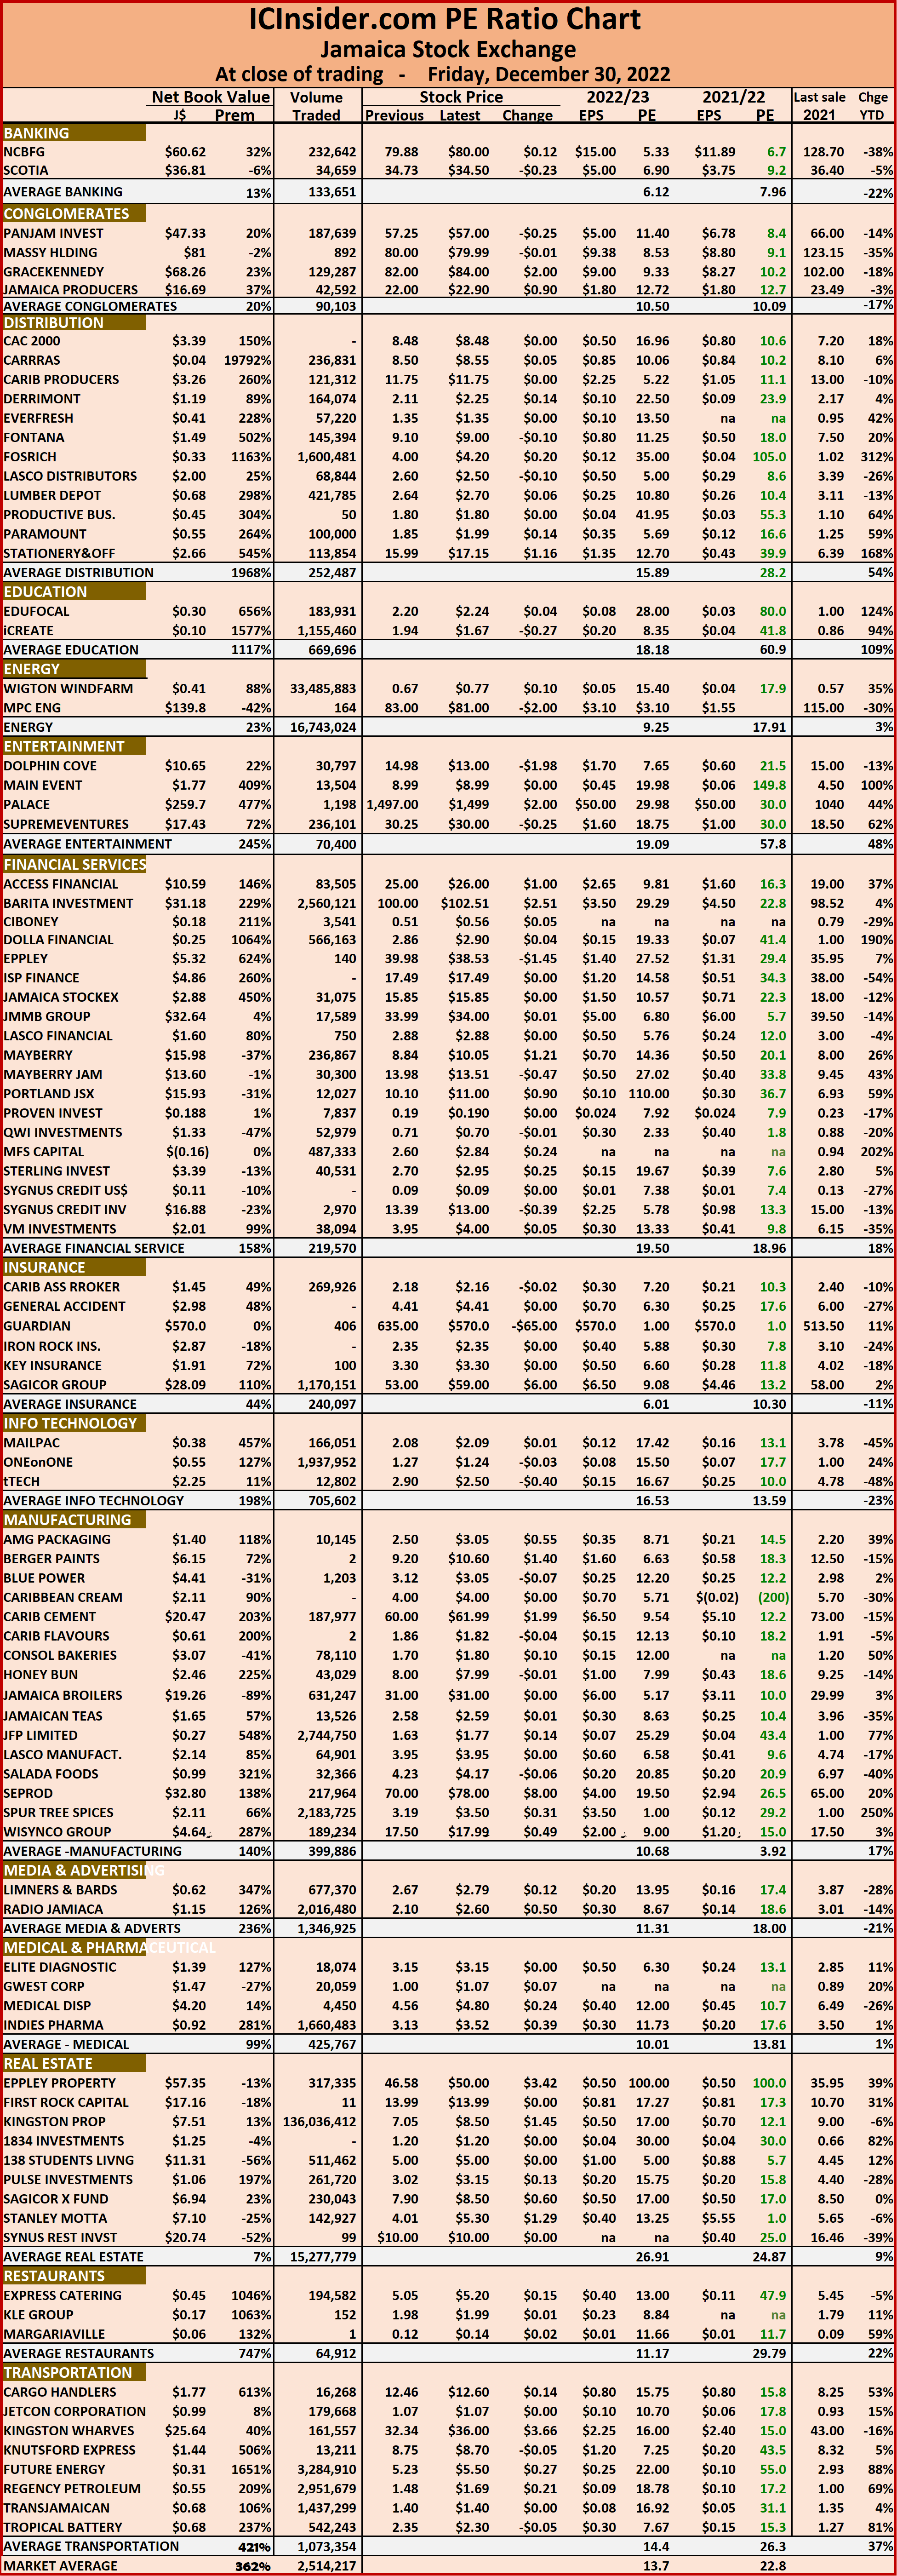 Dividends payable and yields for each company are shown in the Main and Junior Markets’ daily report charts that show the closing volume for the bids and offers.
The EPS & PE ratios are based on 2021 and 2022 actual or projected earnings, excluding major one off items. The PE Ratio is the most popular measure used to determine the value of stocks.
Big JSE Main Market surge
The JSE Main Market index surged sharply on Thursday, while the Junior Market rose moderately and the US dollar market index suffered a sharp reversal after the Jamaica Stock Exchange closed.
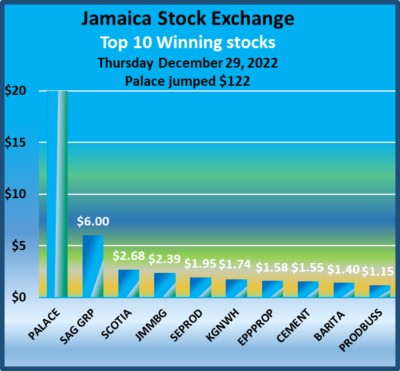 Trading ended, with an exchange of 19,368,737 shares from 32,490,607 units on Wednesday, with a value of $113.6 million versus $98 million on the previous day. The JSE USD market ended with the value of stocks traded amounting to US$42,021 up from US$14,629 on Wednesday.
At the close, the Combined Market Index jumped 5,958.87 points to 363,545.56, the All Jamaican Composite Index surged 9,926.38 points to 394,215.77, the JSE Main Index rose 6,090.77 points to 351,223.81, the Junior Market Index climbed 30.17 points to 3,911.55 and the JSE US dollar market dropped 26.46 points to 231.58.
The market’s PE ratio ended at 22.4 based on 2021-22 earnings and 13.3 times those for 2022-23 at the close of trading.
Investors need pertinent information to successfully navigate many investment options in the local stock market. 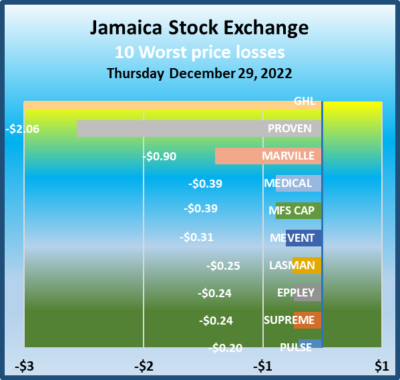 The ICInsider.com PE ratio chart and the more detailed daily report charts provide investors with regularly updated information to help decision-making.
Investors should use the chart to help make rational investment decisions by investing in stocks close to the average for the sector and not going too far from it unless there are compelling reasons to do so. This approach helps to remove emotions from investment decisions and put in on fundamentals while at the same time not being too far from the majority of investors. Investors who buy when the price of a stock is close to the average will find that they are not inclined to overpay for a stock.
The ICInsider.com PE Ratio chart covers all ordinary shares on the Jamaica Stock Exchange. It shows companies grouped on an industry basis, allowing easy comparisons between the same sector companies and the overall market.
The net asset value of each company is reported as a guide to assess the value of stocks based on this measure quickly. The chart also shows daily changes in stock prices and the percentage year to date price movement based on the last traded prices. 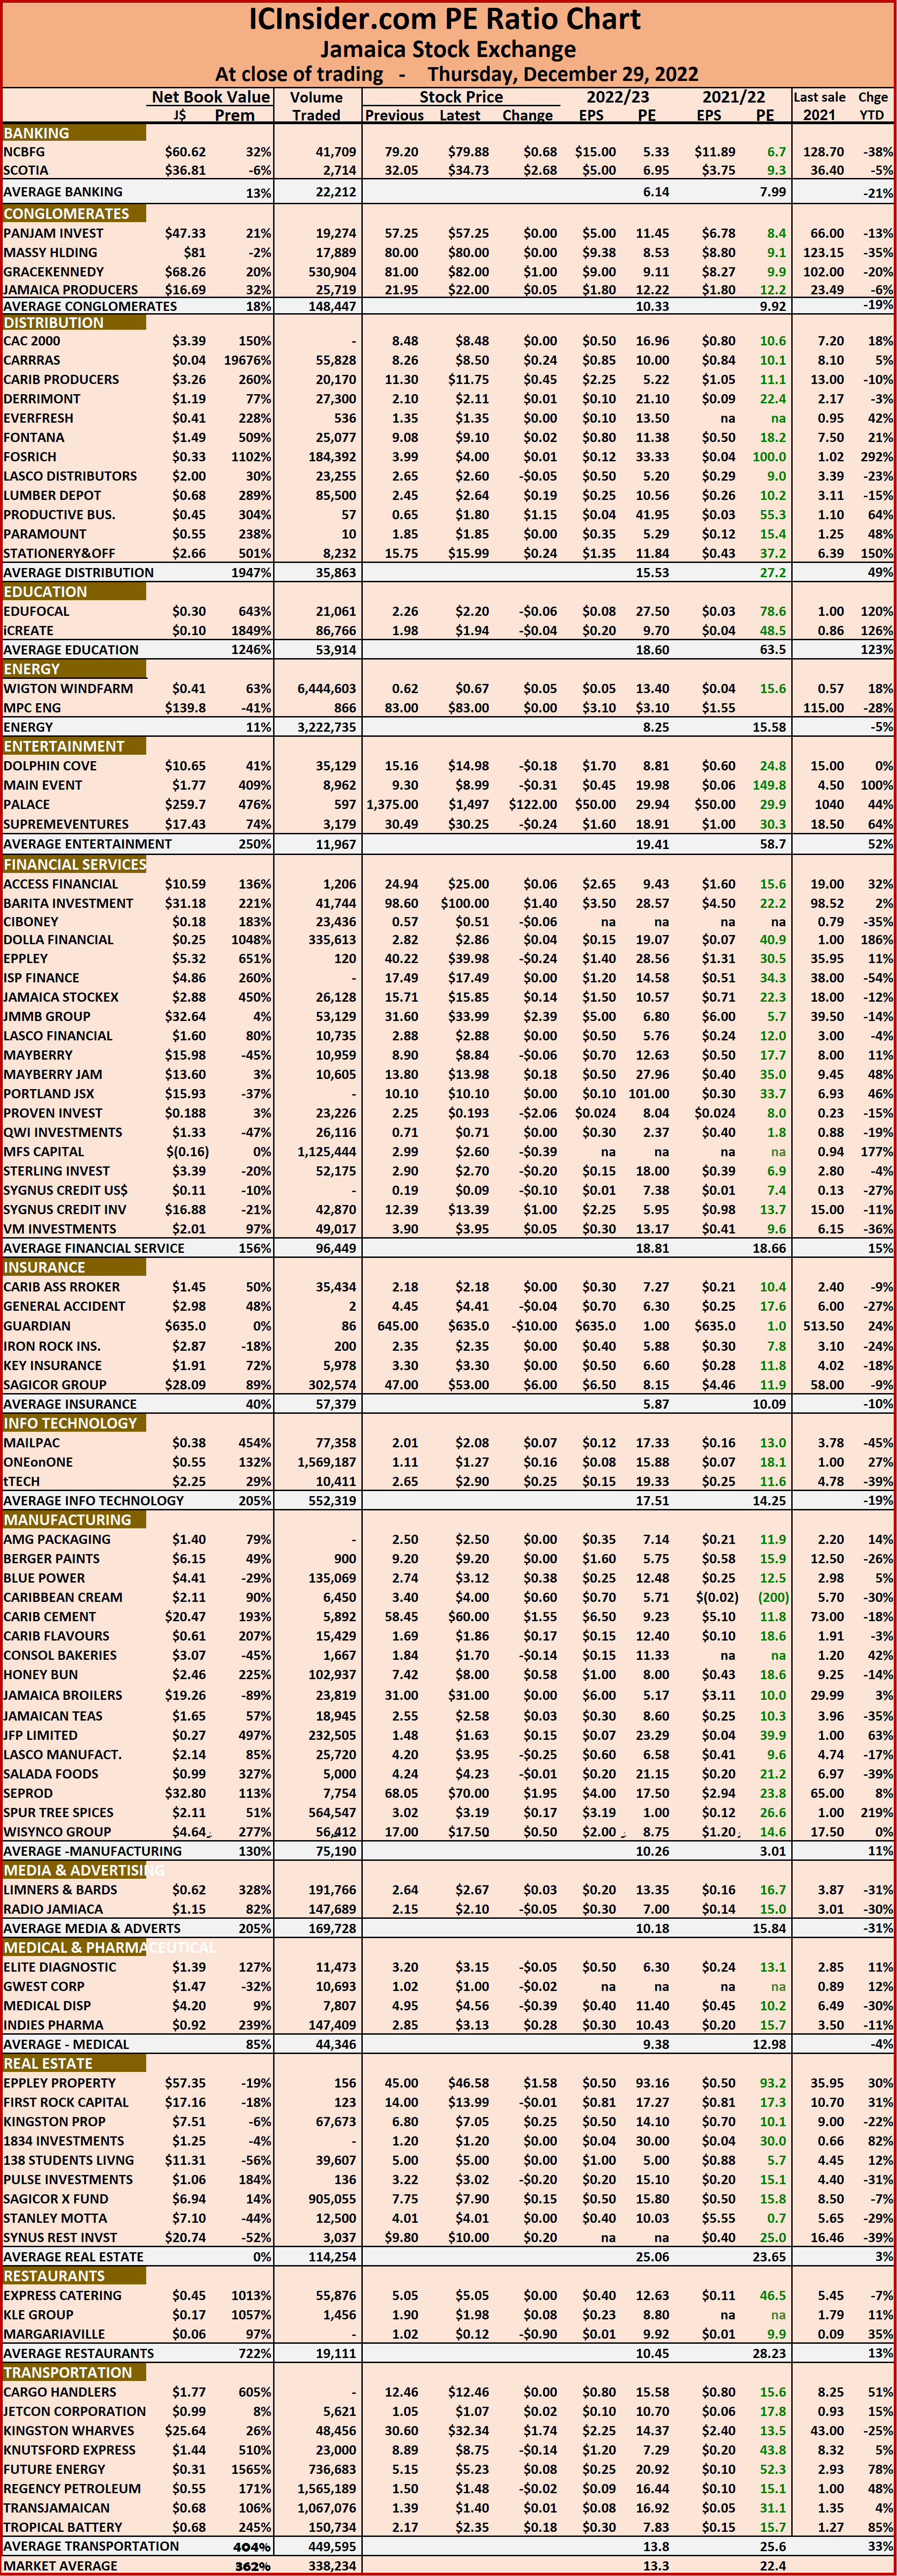 Dividends payable and yields for each company are shown in the Main and Junior Markets’ daily report charts that show the closing volume for the bids and offers.
The EPS & PE ratios are based on 2021 and 2022 actual or projected earnings, excluding major one off items. The PE Ratio is the most popular measure used to determine the value of stocks.
Jamaica Stock Exchange nearly stable,
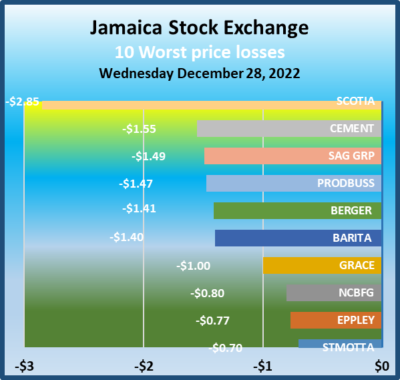
The JSE Main Market index and the US dollar market index rose on Wednesday after the Jamaica Stock Exchange was closed for the long Christmas holidays, but the Junior Market slipped moderately to start off the last week of the year.
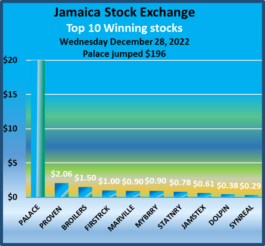 Trading ended with an exchange of 32,490,607 shares from 57,304,112 units last Friday, with a value of $98 million versus $258.7 million on the previous day. The JSE USD market ended with stocks traded with a value of US$14,629 versus US$699 last Friday.
The Combined Market Index fell 89.14 points to 357,586.69, the All Jamaican Composite Index dipped 178.44 points to 384,289.39, the JSE Main Index rose 169.81 points to 345,133.04, the Junior Market slipped 26.97 points to 3,881.38 and the JSE US dollar market rose 5.46 points to 258.04.
The market’s PE ratio ended at 25 based on 2021-22 earnings and 15 times those for 2022-23 at the close of trading.
Investors need pertinent information to successfully navigate many investment options in the local stock market. The ICInsider.com PE ratio chart and the more detailed daily report charts provide investors with regularly updated information to help decision-making.
 Investors should use the chart to help make rational investment decisions by investing in stocks close to the average for the sector and not going too far from it unless there are compelling reasons to do so. This approach helps to remove emotions from investment decisions and put in on fundamentals while at the same time not being too far from the majority of investors. Investors who buy when the price of a stock is close to the average will find that they are not inclined to overpay for a stock.
The ICInsider.com PE Ratio chart covers all ordinary shares on the Jamaica Stock Exchange. It shows companies grouped on an industry basis, allowing easy comparisons between the same sector companies and the overall market.
The net asset value of each company is reported as a guide to assess the value of stocks based on this measure quickly. The chart also shows daily changes in stock prices and the percentage year to date price movement based on the last traded prices. 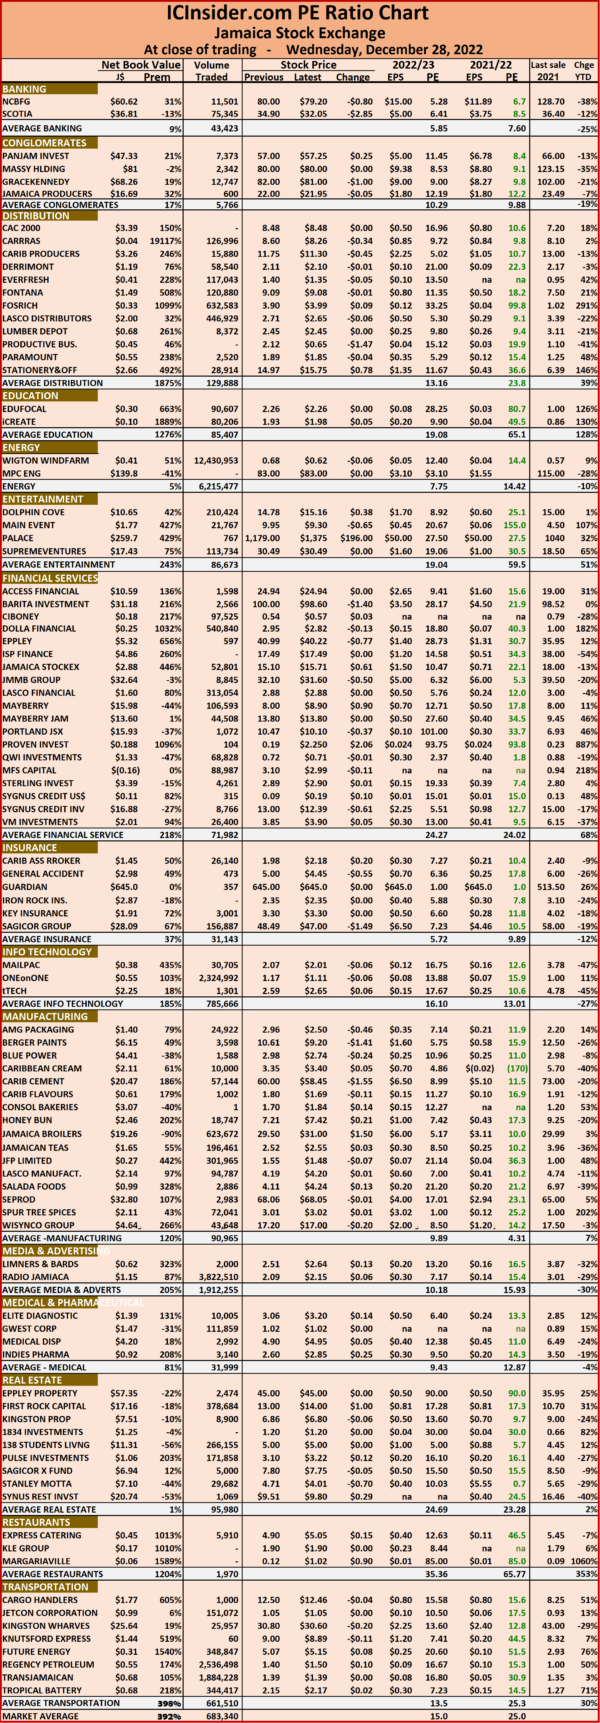 Dividends payable and yields for each company are shown in the Main and Junior Markets’ daily report charts that show the closing volume for the bids and offers.
The EPS & PE ratios are based on 2021 and 2022 actual or projected earnings, excluding major one off items. The PE Ratio is the most popular measure used to determine the value of stocks.
JSE Main Market bounce, Juniors fall
The JSE Main Market and the US dollar market bounced on Friday ahead of the Christmas holidays and before the market reopens next week Wednesday, but the Junior Market slipped moderately to close off the week slightly higher than the previous week, as the volume of stocks trading in the Junior Market surged well above the 7.3 million shares that were traded on Thursday, with just over 36 million units changing hands on Friday.
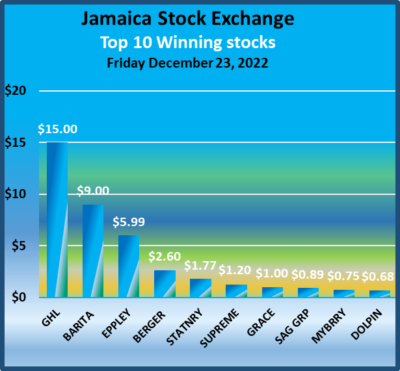 Trading ended with an exchange of 57,304,112 shares compared with 14,915,848 units on Thursday, with the value dropping to $258.7 million from $134.4 million on the previous day.
The JSE USD market ended with the value of stocks traded amounting to just US$699, down from US$24,703 on Friday.
At the close, the Combined Market Index climbed 2,679.19 points to close at 357,675.83, the All Jamaican Composite Index surged 3,483.04 points to 384,467.83, the JSE Main Index jumped 2,968.48 points to end at 344,963.23, the Junior Market slipped 9.80 points to settle at 3,908.35 and the JSE US dollar market rose 2.02 points to 252.58.
The market’s PE ratio ended at 22.5 based on 2021-22 earnings and 12.8 times those for 2022-23 at the close of trading.
Investors need pertinent information to successfully navigate many investment options in the local stock market. The ICInsider.com PE ratio chart and the more detailed daily report charts provide investors with regularly updated information to help decision-maki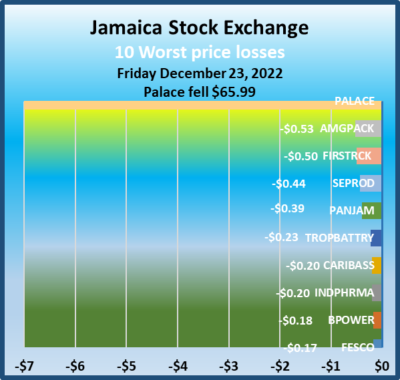 ng.
Investors should use the chart to help make rational investment decisions by investing in stocks close to the average for the sector and not going too far from it unless there are compelling reasons to do so. This approach helps to remove emotions from investment decisions and put in on fundamentals while at the same time not being too far from the majority of investors. Investors who buy when the price of a stock is close to the average will find that they are not inclined to overpay for a stock.
The ICInsider.com PE Ratio chart covers all ordinary shares on the Jamaica Stock Exchange. It shows companies grouped on an industry basis, allowing easy comparisons between the same sector companies and the overall market.
The net asset value of each company is reported as a guide to assess the value of stocks based on this measure quickly. 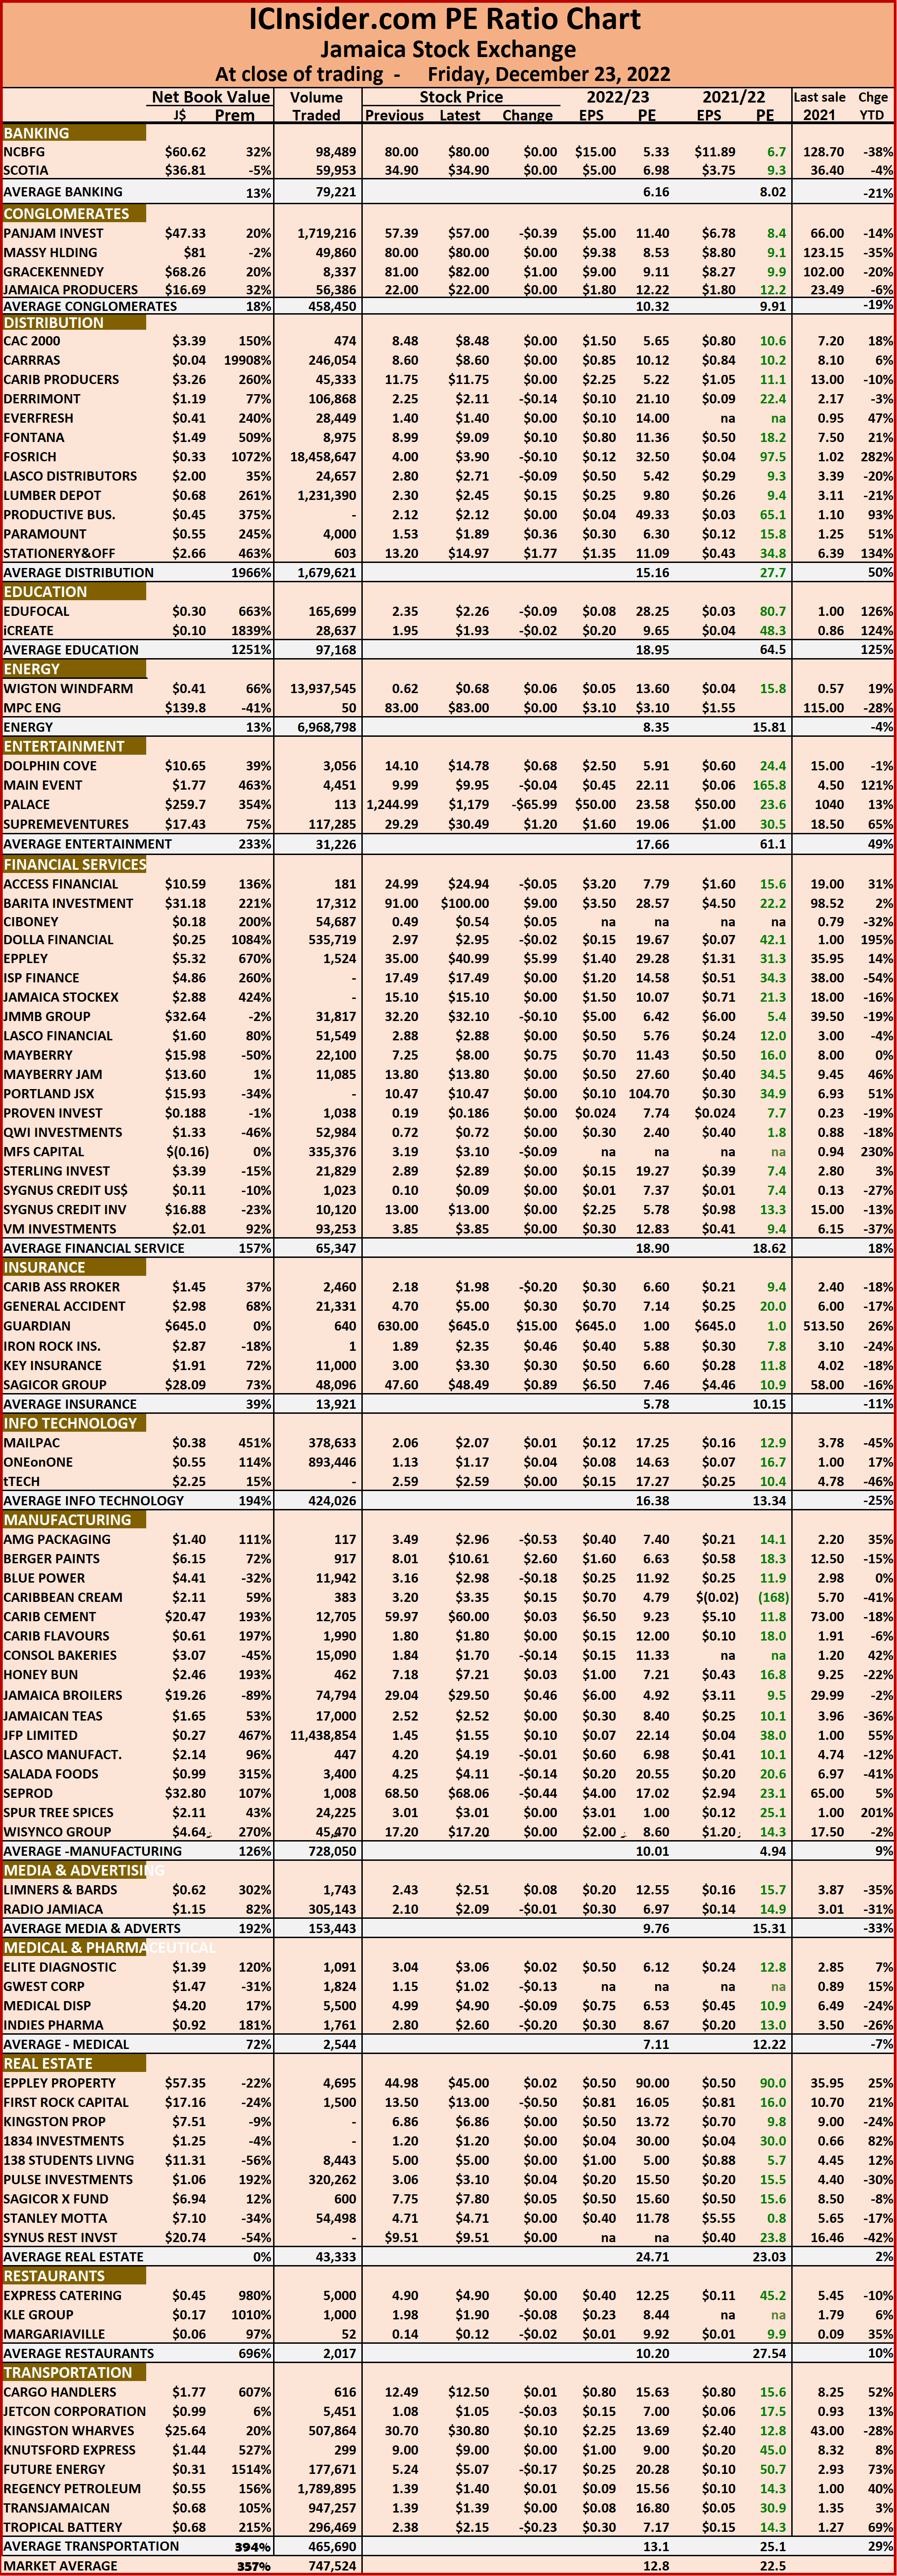 The chart also shows daily changes in stock prices and the percentage year to date price movement based on the last traded prices. Dividends payable and yields for each company are shown in the Main and Junior Markets’ daily report charts that show the closing volume for the bids and offers.
The EPS & PE ratios are based on 2021 and 2022 actual or projected earnings, excluding major one off items. The PE Ratio is the most popular measure used to determine the value of stocks.
JSE markets rise as Jamaica stocks lost value
The JSE US dollar market jumped sharply for a second day on Thursday following Wednesday’s big jump and the Junior Market rallied further following Wednesday’s big recovery but Main Market closed higher in the fading seconds of trading after it was in decline for most of the day’s session, Jamaica stocks suffered losses as shown by a declining index.
 Trading ended with an exchange of 14,915,848 shares up from 125,922,690 units on Wednesday, with the value dropping to $134.4 million from $948.7 million on the previous day. The JSE USD market ended with the value of stocks traded amounting to US$24,703 up from US$12,842 on Thursday.
At the close, the Combined Market Index climbed 1,721.80 points to 354,996.64, the All Jamaican Composite Index fell 1,195.13 points to 380,984.79, the JSE Main Index rose 1,526.78 points to 341,994.74, the Junior Market Index rallied 32.42 points to settle at 3,918.16 and the JSE US dollar market popped 6.41 points to 250.56.
The market’s PE ratio ended at 22.5 based on 2021-22 earnings and 12.8 times those for 2022-23 at the close of trading.
 Investors need pertinent information to successfully navigate many investment options in the local stock market. The ICInsider.com PE ratio chart and the more detailed daily report charts provide investors with regularly updated information to help decision-making.
Investors should use the chart to help make rational investment decisions by investing in stocks close to the average for the sector and not going too far from it unless there are compelling reasons to do so. This approach helps to remove emotions from investment decisions and put in on fundamentals while at the same time not being too far from the majority of investors. Investors who buy when the price of a stock is close to the average will find that they are not inclined to overpay for a stock.
The ICInsider.com PE Ratio chart covers all ordinary shares on the Jamaica Stock Exchange. It shows companies grouped on an industry basis, allowing easy comparisons between the same sector companies and the overall market.
The net asset value of each company is reported as a guide to assess the value of stocks based on this measure quickly. The chart also shows daily changes in stock prices and the percentage year to date price movement based on the last traded prices. Dividends payable and yields for each company are shown in the Main and Junior Markets’ daily report charts that show the closing volume for the bids and offers.
The EPS & PE ratios are based on 2021 and 2022 actual or projected earnings, excluding major one off items. The PE Ratio is the most popular measure used to determine the value of stocks.