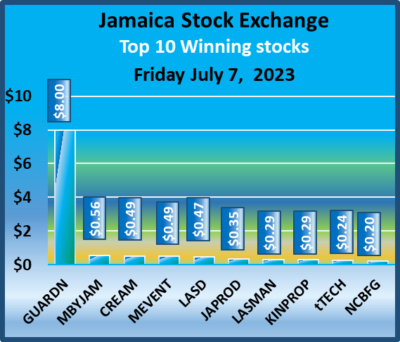
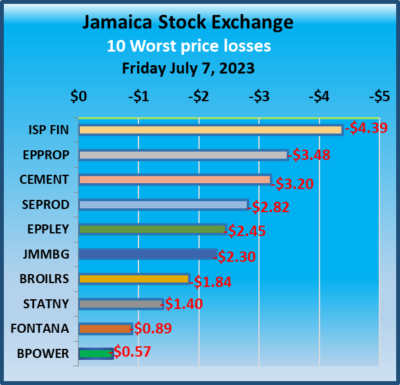
The Junior Market climbed even higher than Friday’s close to its highest level since the end of January this year and the JSE USD market closed higher but the Main Market slipped, with volume and value trading rising moderately above that of Friday.
 At the close, the JSE Combined Market Index fell 1,248.89 points to close at 340,233.71, the All Jamaican Composite Index gained 91.60 points to end at 363,379.58, the JSE Main Index shed 1,424.39 points to close at 325,201.53, while the Junior Market Index added 8.76 points to end trading at 4,019.99 and the JSE USD Market Index popped 3.80 points to close at 247.63.
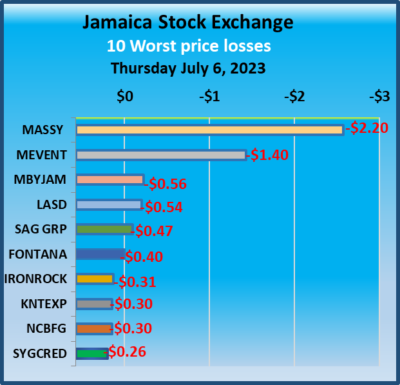
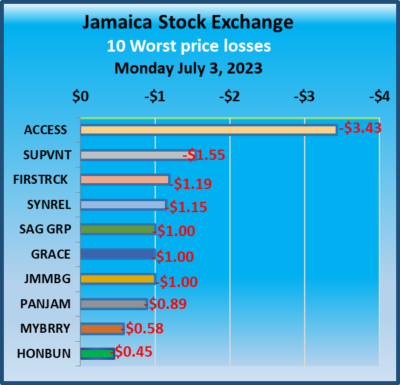
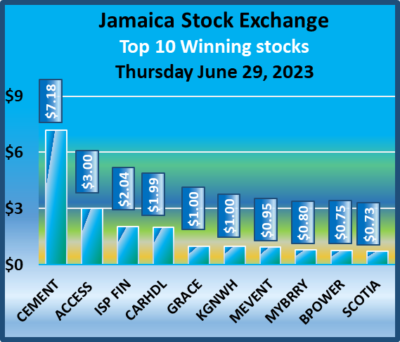
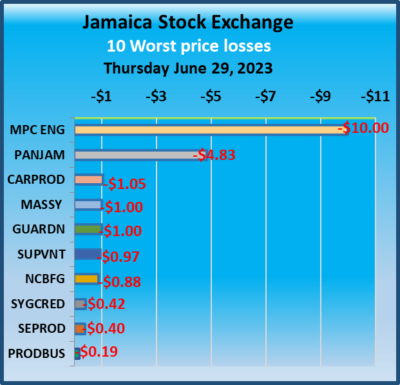
Preference shares with notable price movements but not in the Main Market TOP10 graphs are Jamaica Public Service 7% lost $7.50 to close at $42.50 and Jamaica Public Service 9.5% surged $446.70 to $3424.70.
At the close, investors exchanged 28,770,036 shares in all three markets, up from 18,632,454 stocks on Friday. The value of stocks trading in the Junior and Main markets was $96.24 million, from $59.33 million on Friday. Trading on the JSE USD market ended with investors exchanging 628,194 shares for US$15,064 from 684,072 units at US$37,141 on Friday.
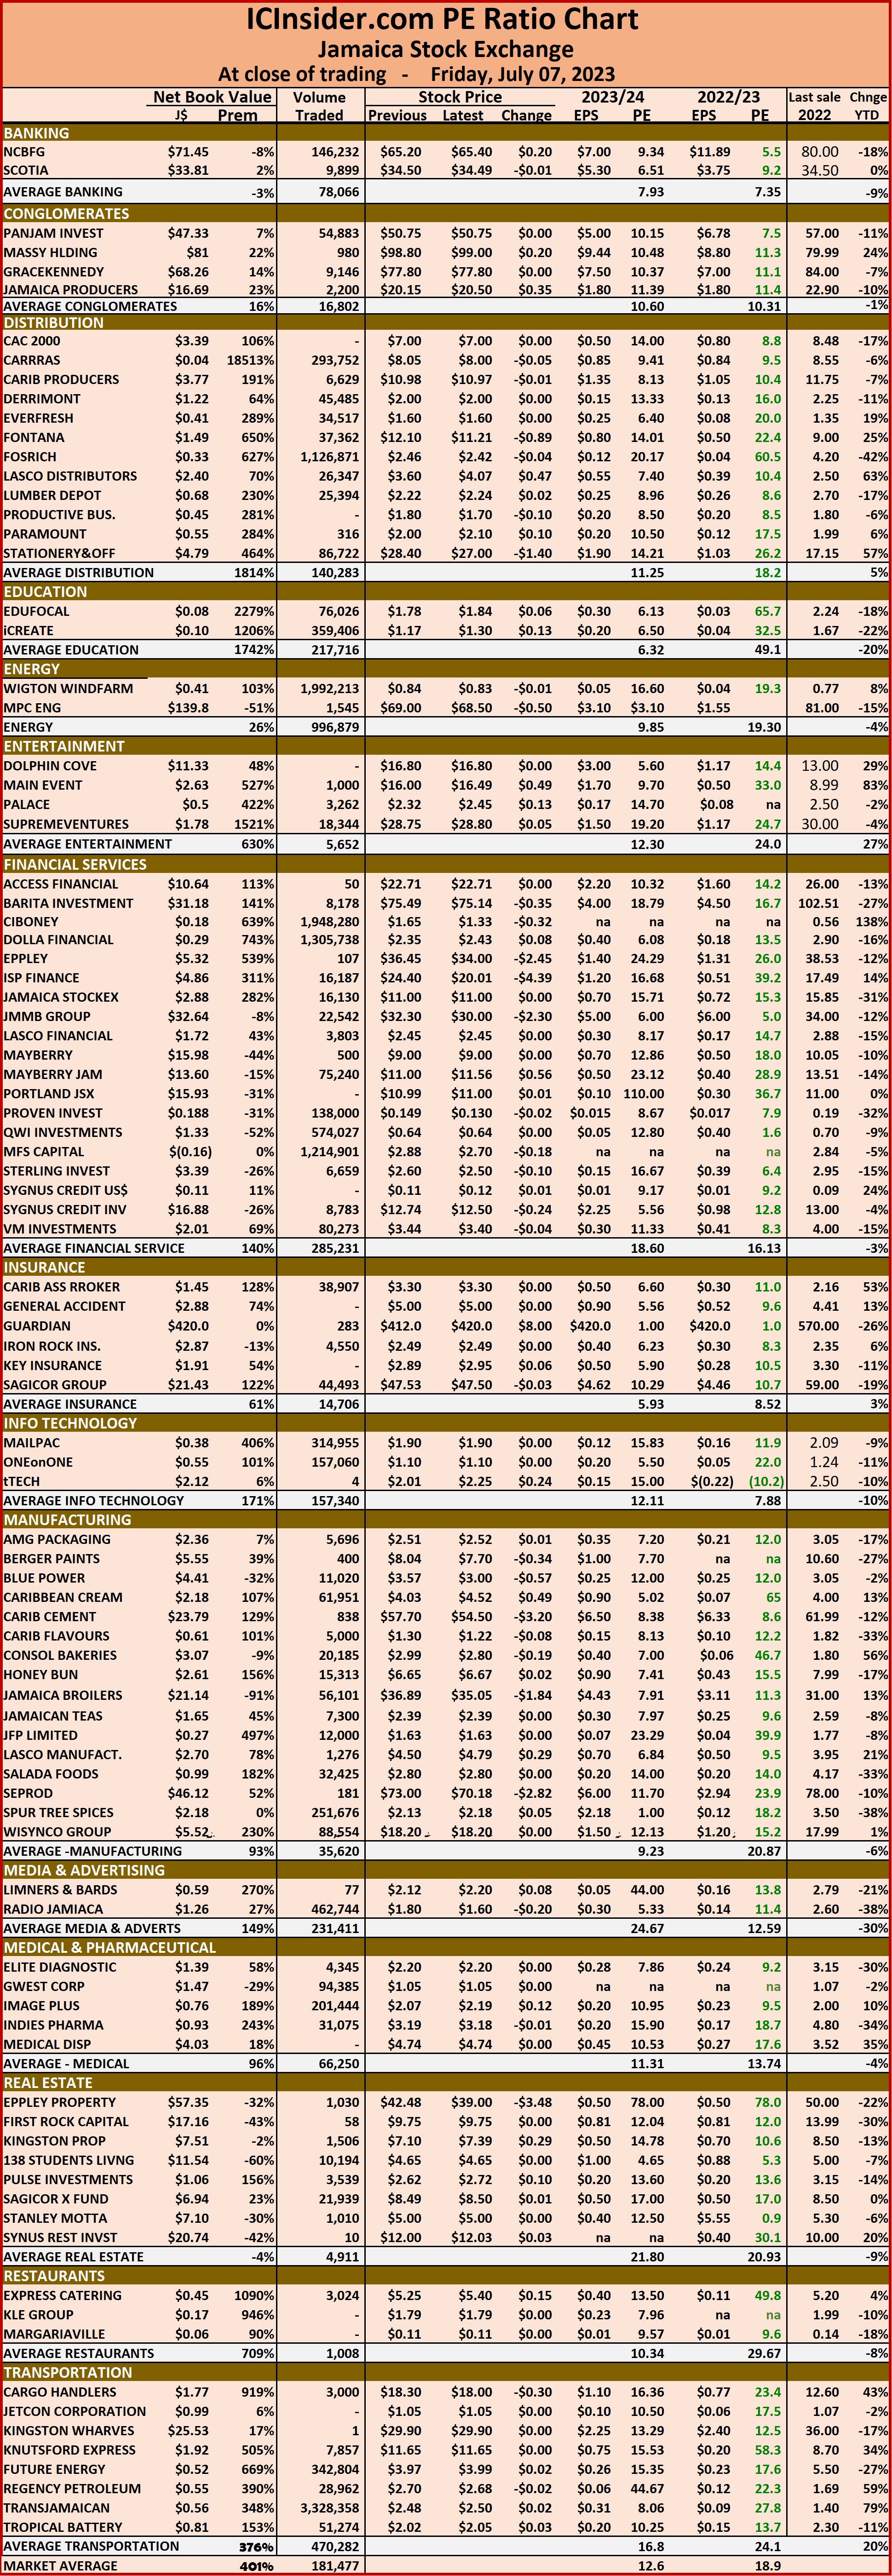
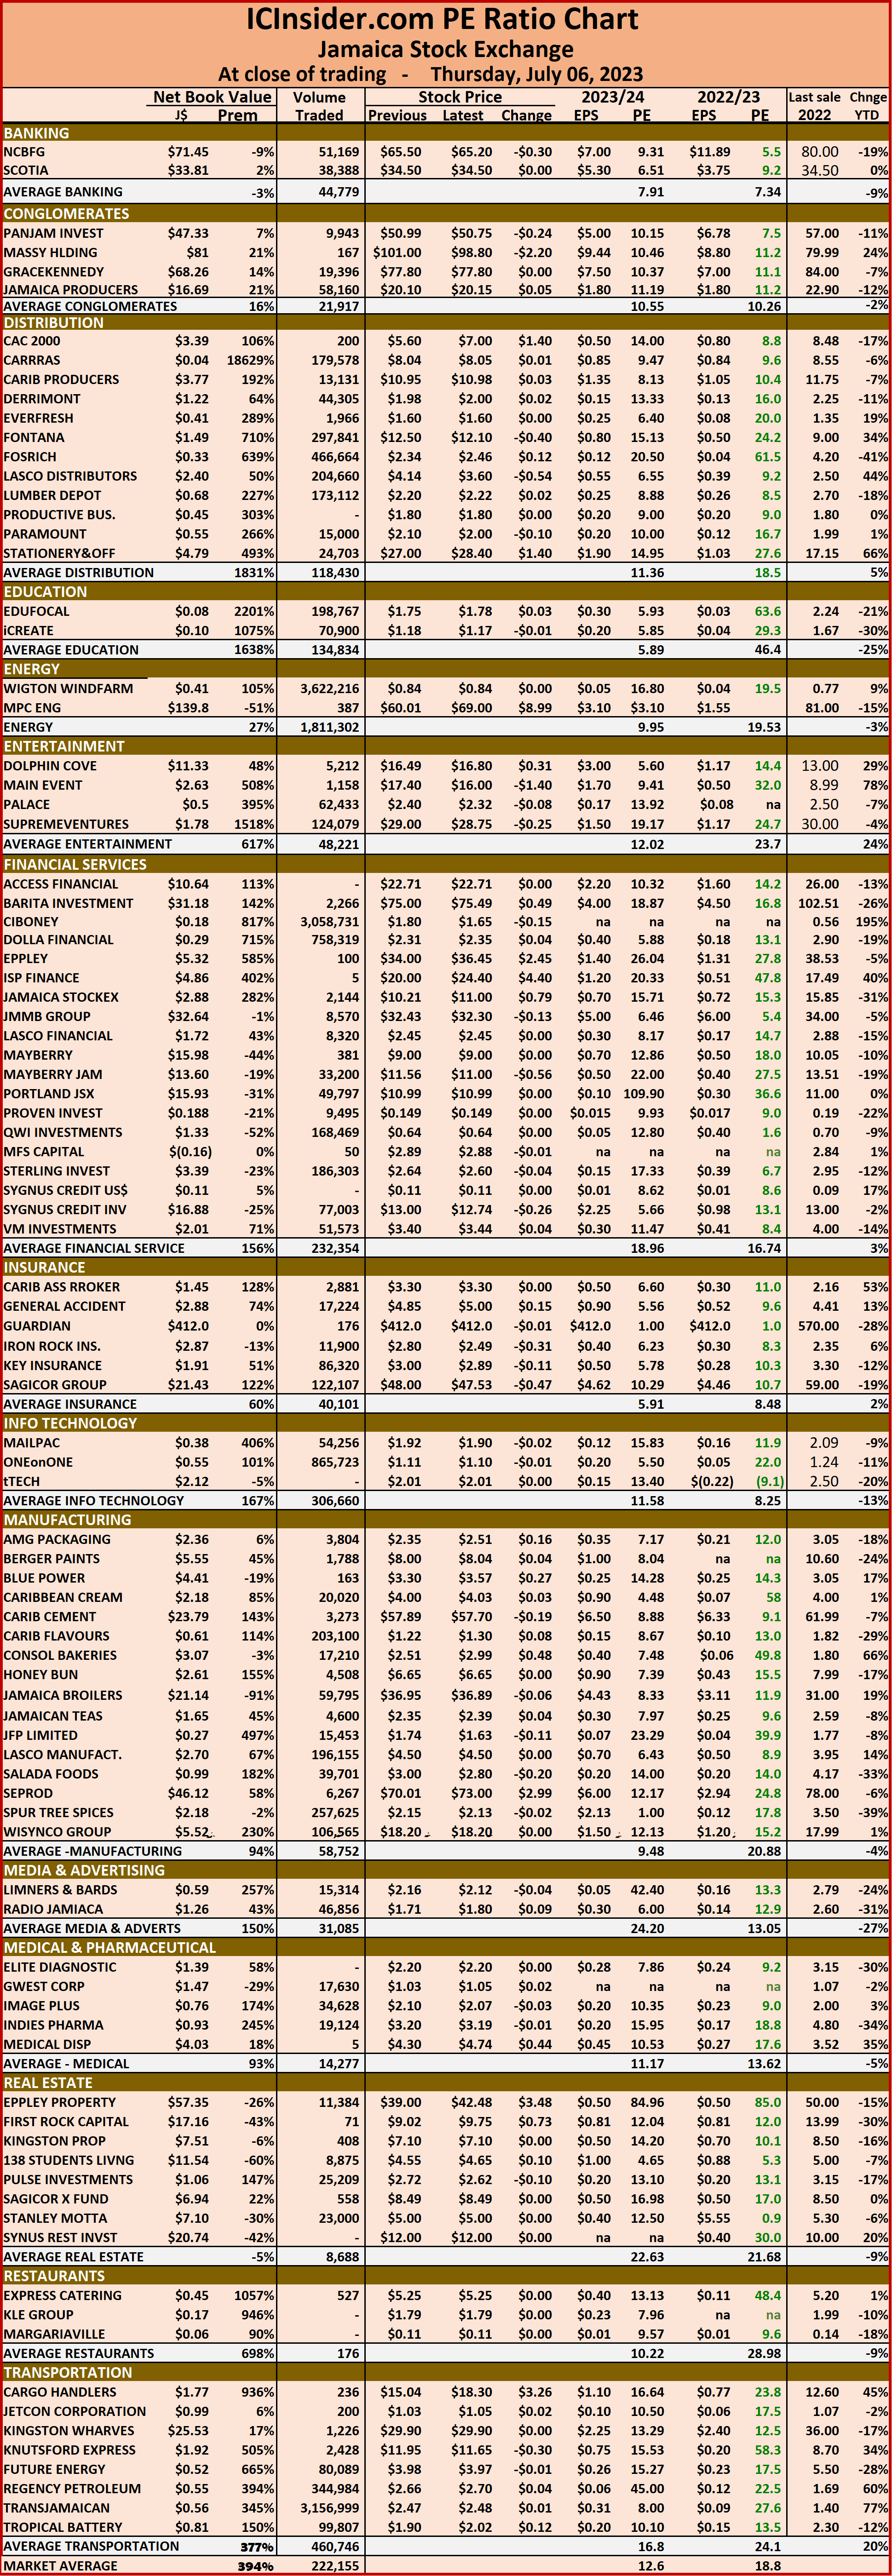
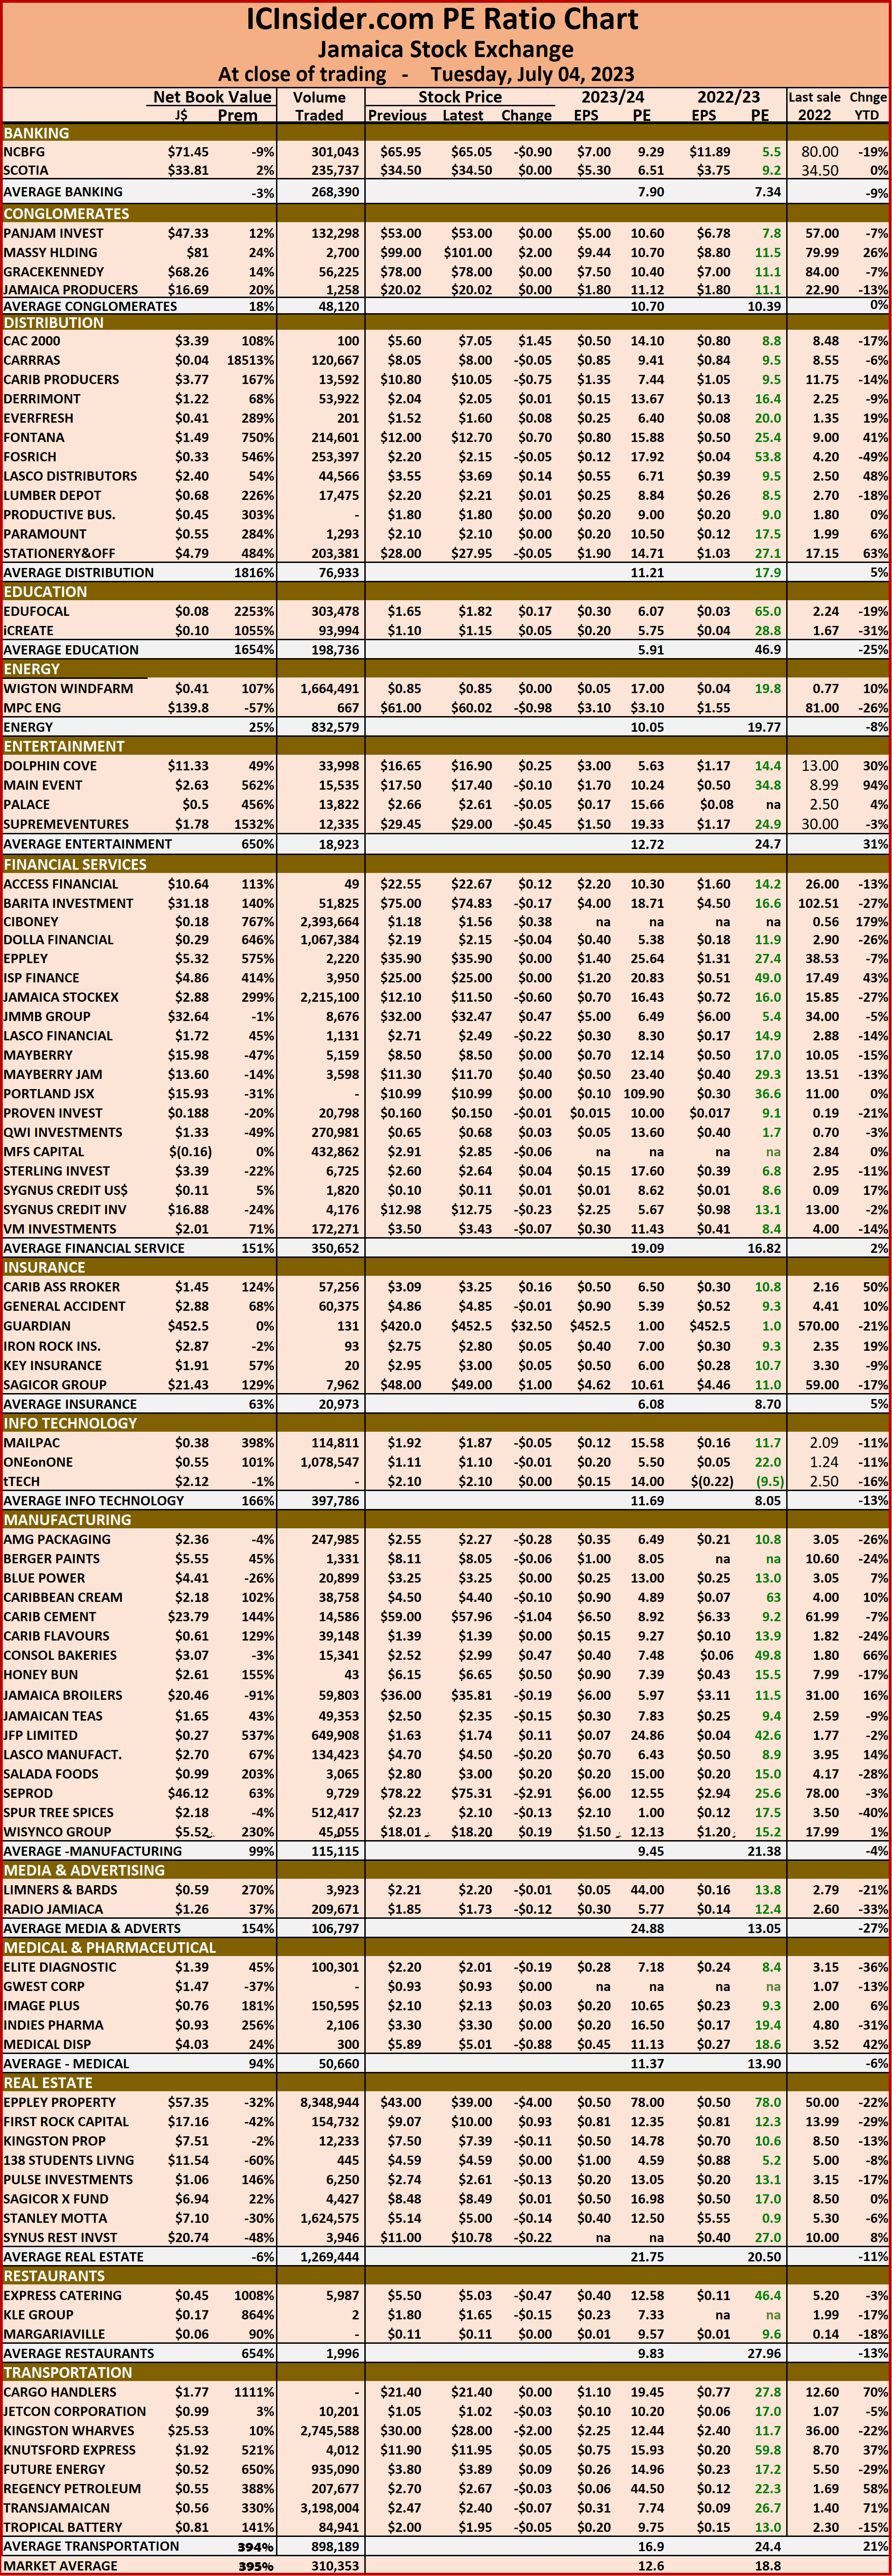
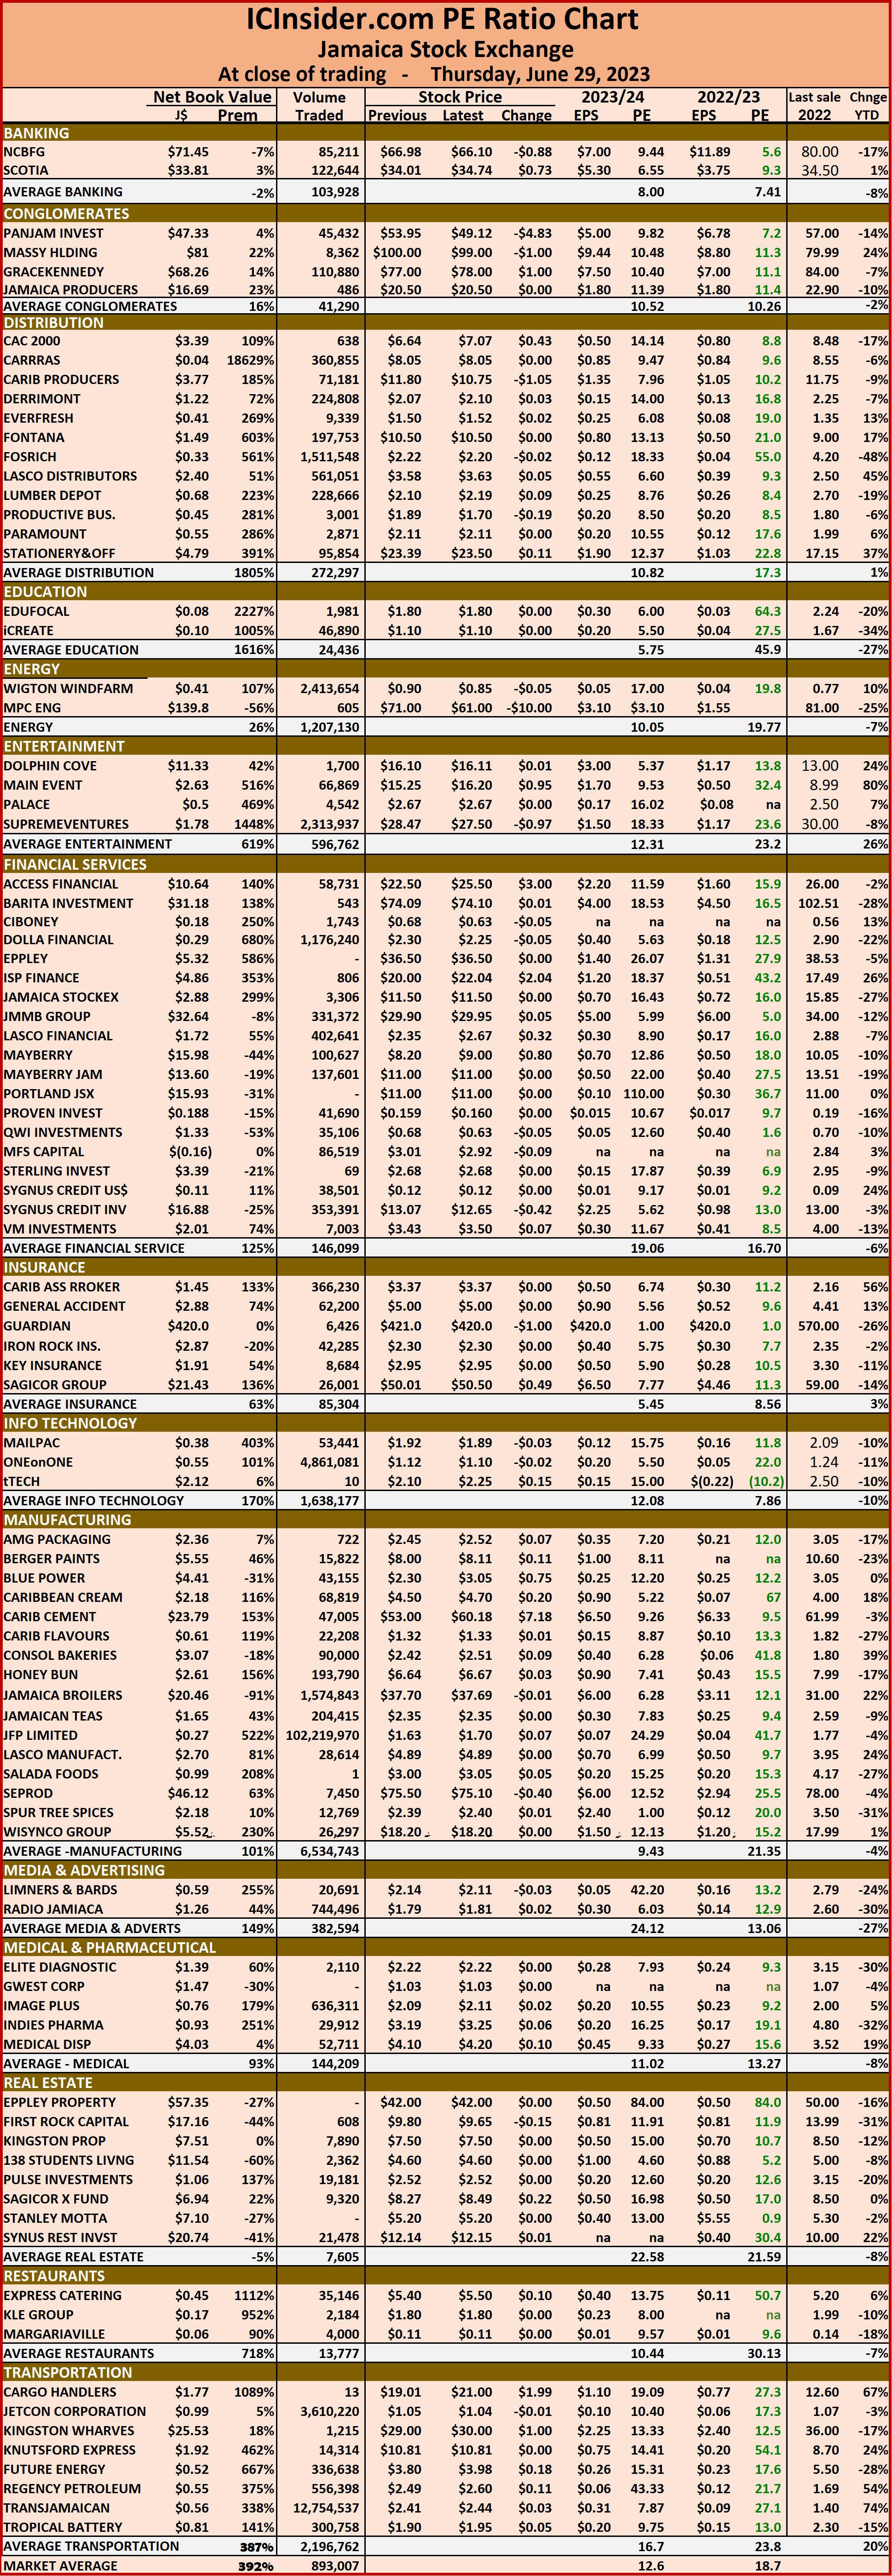
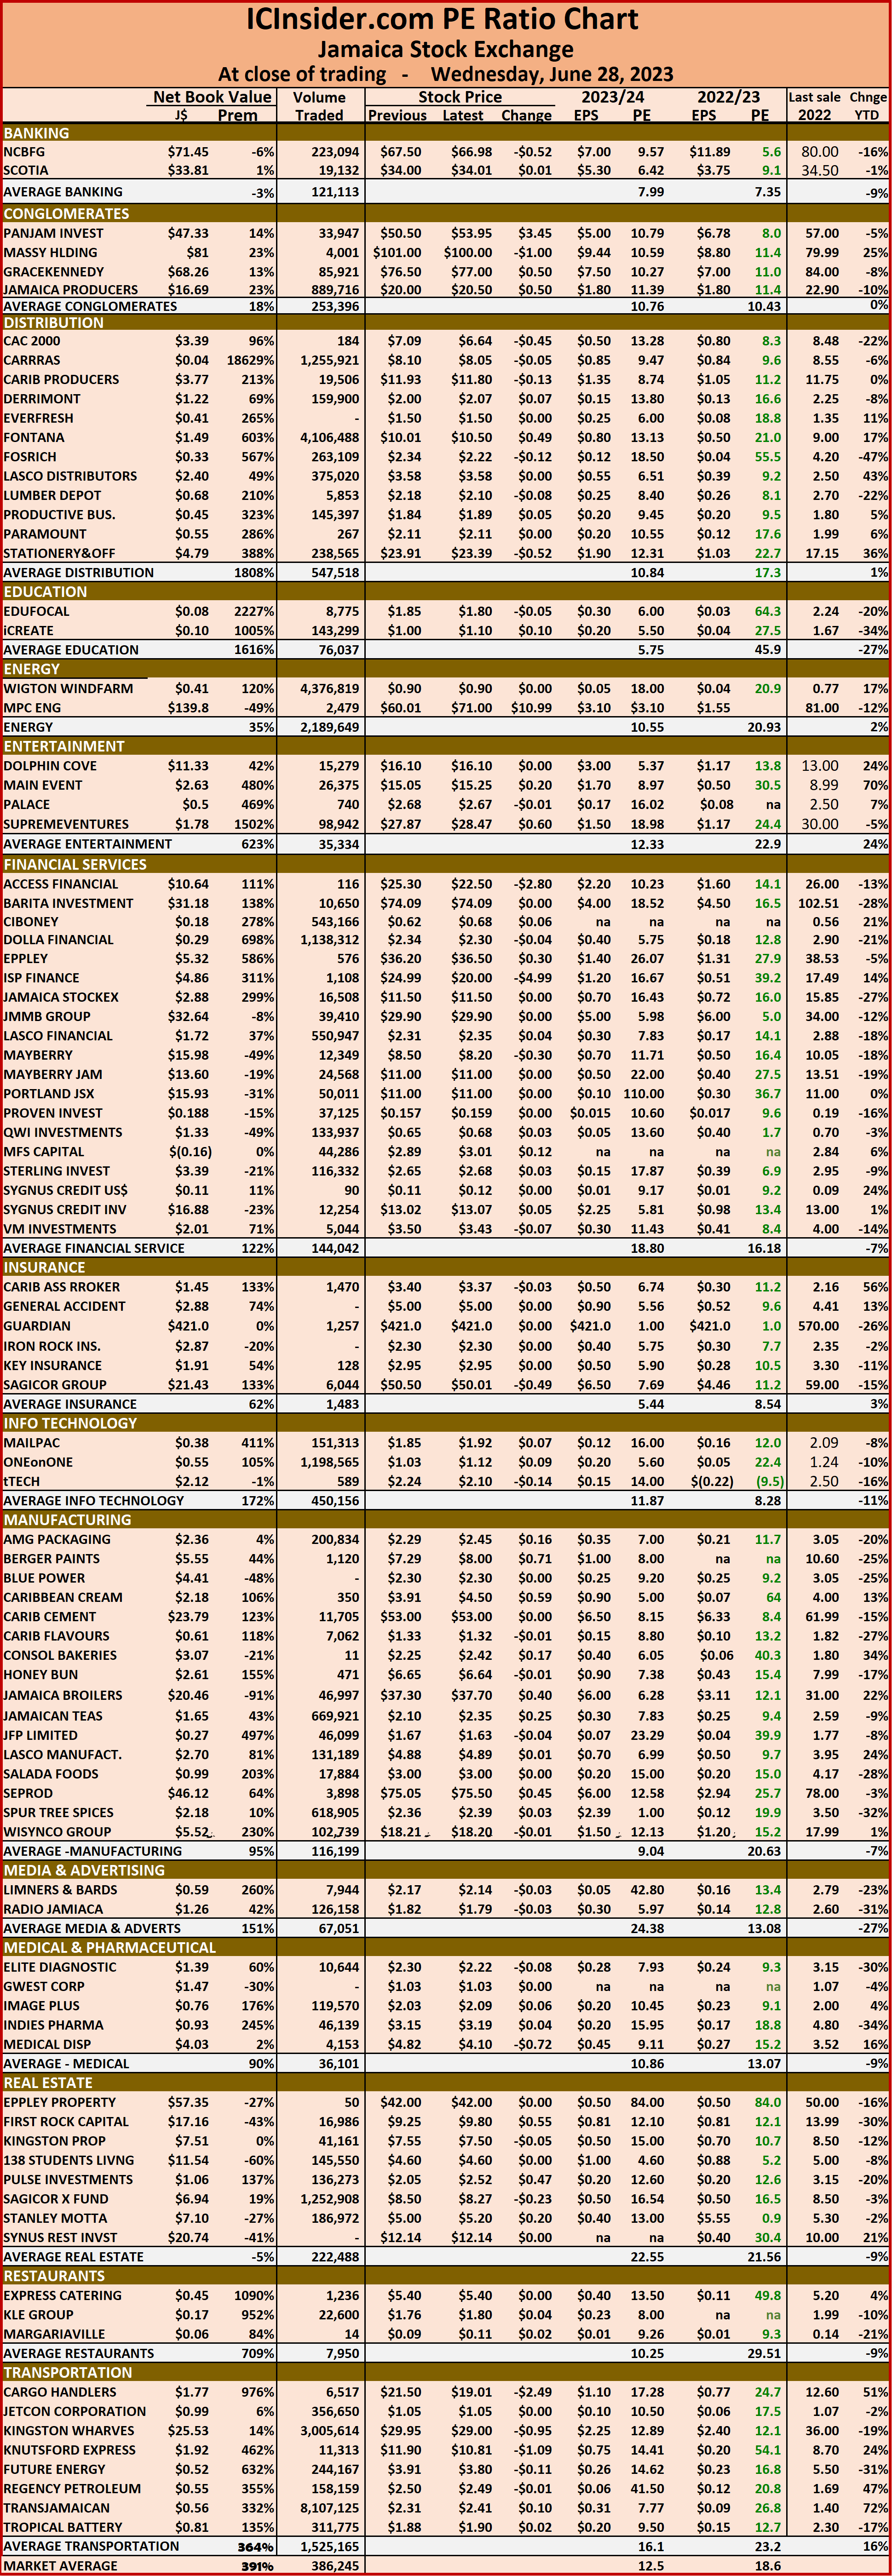
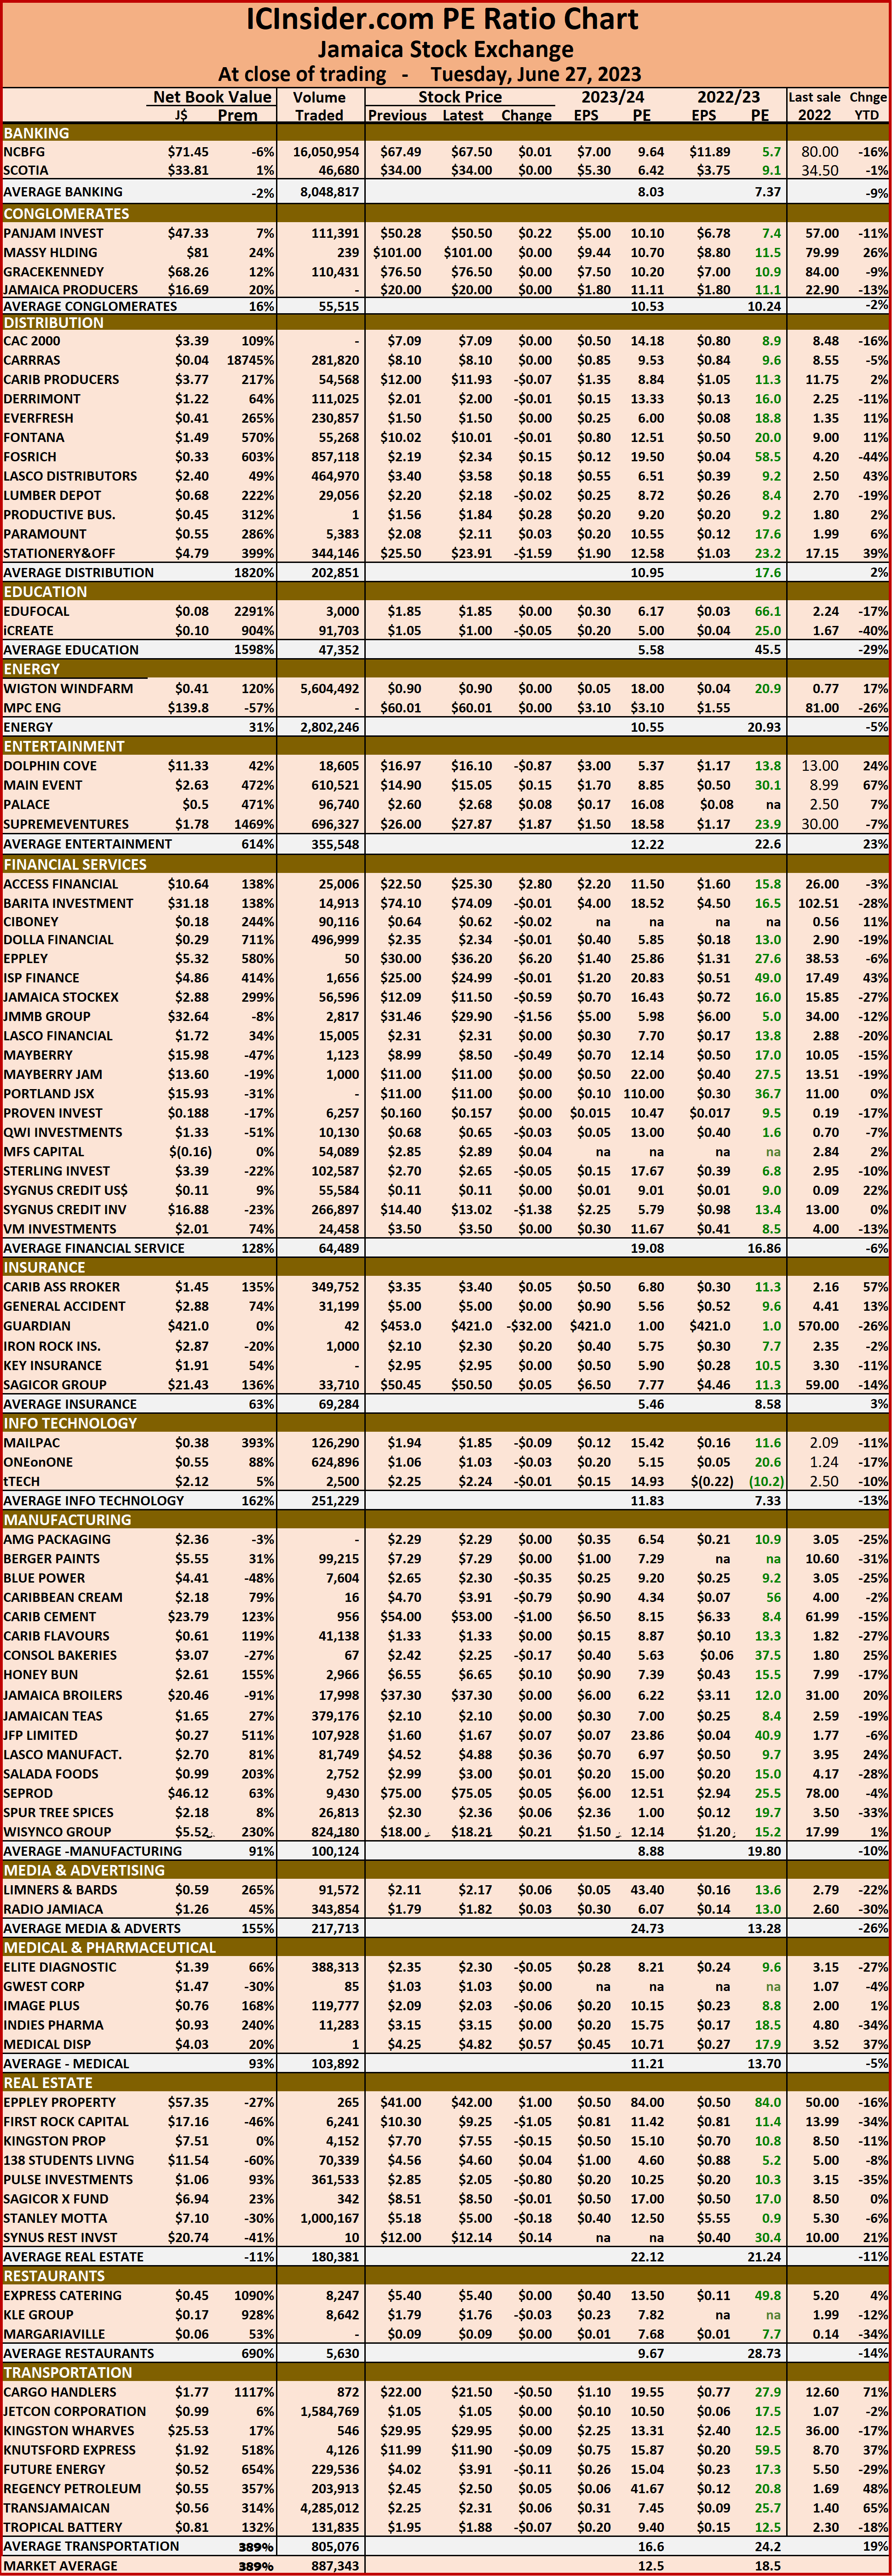
 The market’s PE ratio, the most popular measure used to determine the value of stocks ended at 18.7 on 2022-23 earnings and 12.5 times those for 2023-24 at the close of trading. ICInsider.com PE ratio chart and the more detailed daily report charts provide investors with regularly updated information to help decision-making.
The PE ratio chart covers all ordinary shares on the Jamaica Stock Exchange and shows companies grouped by industry, allowing for easy comparisons between the same sector companies and the overall market. The EPS & PE ratios are based on 2023 and 2024 actual or projected earnings, excluding major one off items.
Investors need pertinent information to successfully navigate numerous investment options in the local stock market. The ICInsider.com PE ratio chart and the more detailed daily report charts provide investors with regularly updated information to help decision-making.
Investors should use the chart to help make rational decisions when investing in stocks close to the average for the sector and not going too far from it unless there are compelling reasons to do so. This approach helps to remove emotions from investment decisions and place them on fundamentals while at the same time not being too far from the majority of investors. Investors who buy when the price of a stock is close to the average will find that they are not inclined to overpay for a stock.
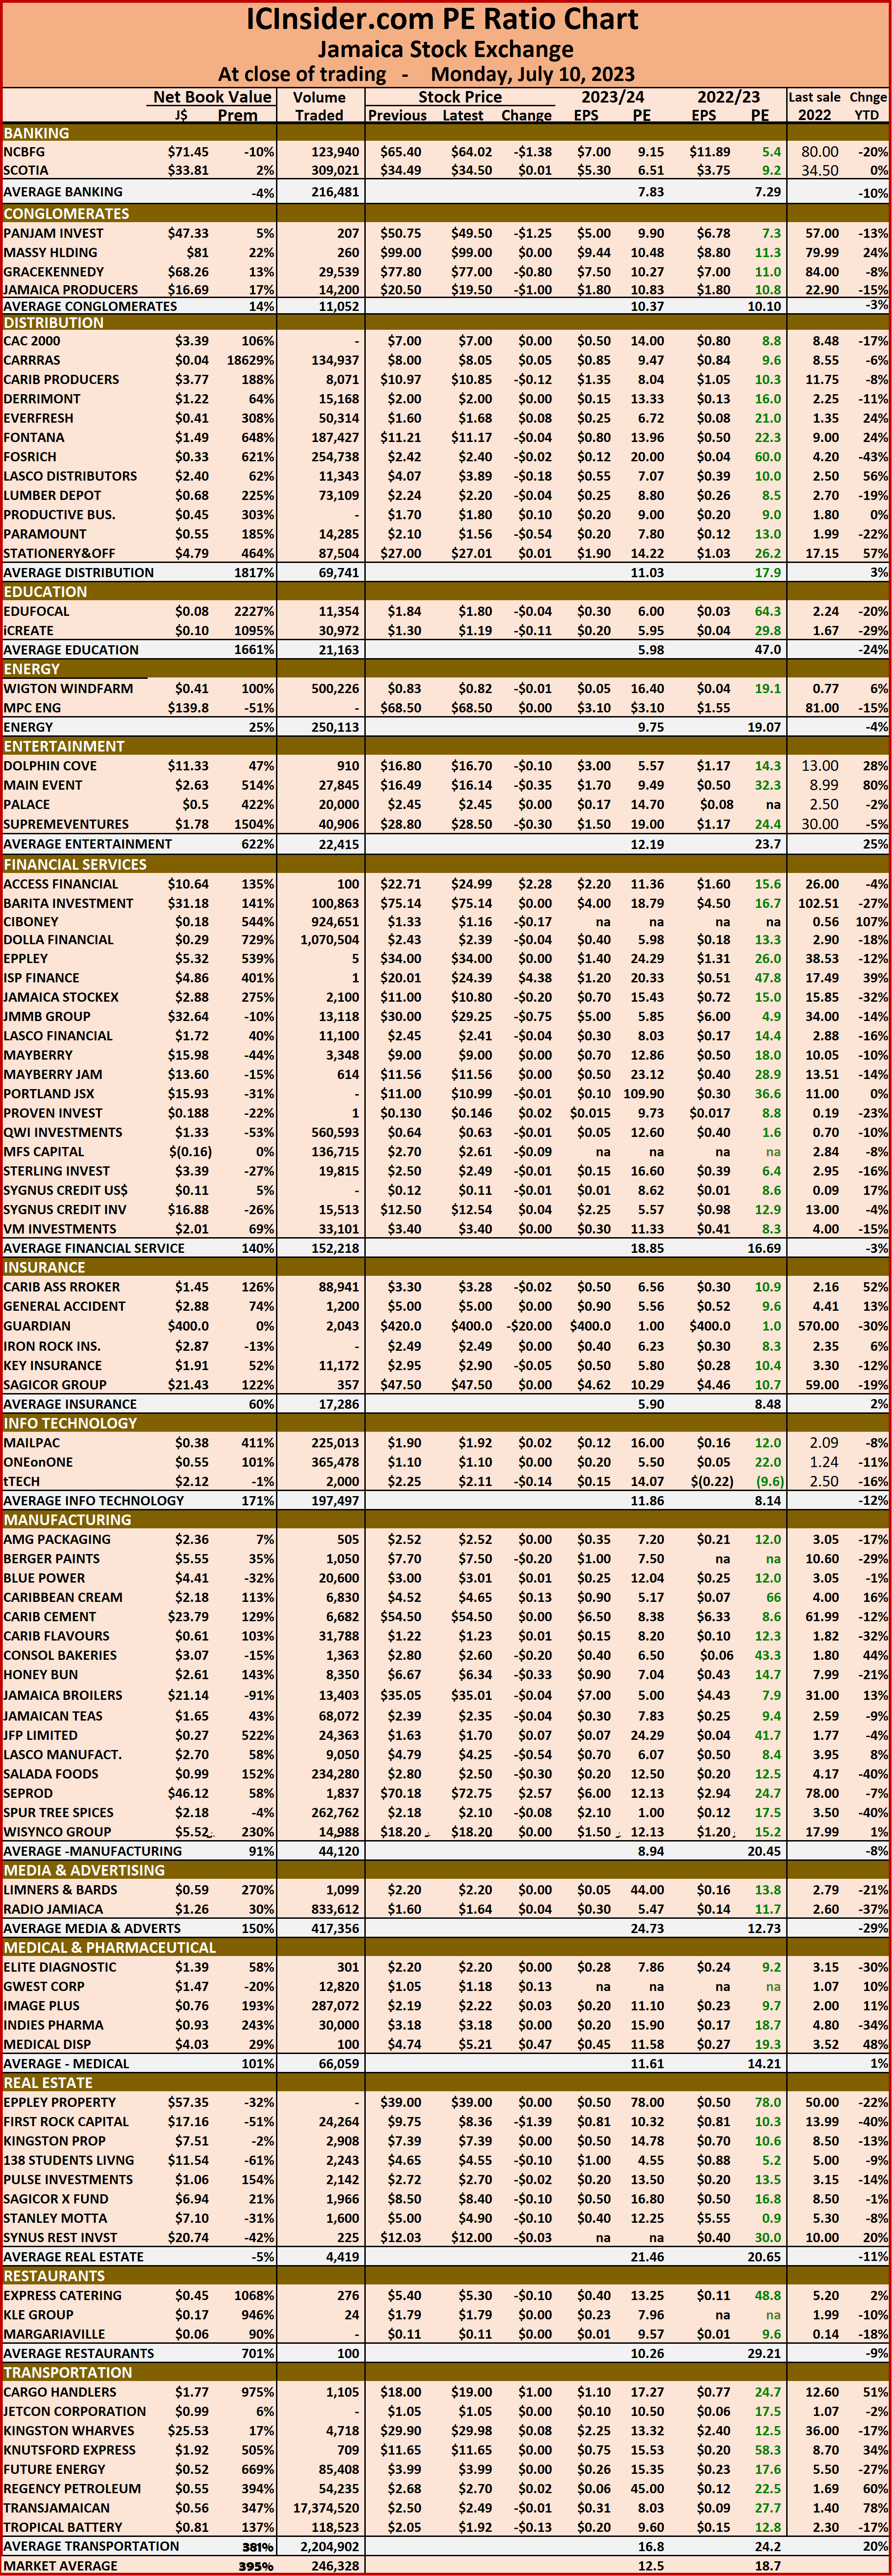 The net asset value of each company is reported as a guide to assess the value of stocks based on this measure quickly. The chart also shows daily changes in stock prices and the percentage year to date price movement based on the last traded prices.
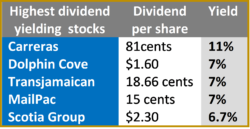
Dividends paid or payable and yields for each company are shown in the Main and Junior Markets’ daily report charts along with the closing volume pertaining to the highest bid and the lowest offer for each company.
Junior Market in black after 6 months
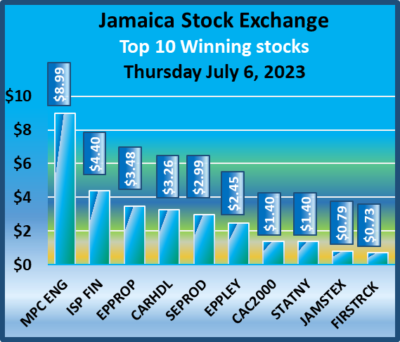
On a day when the Main Market slipped moderately and the JSE USD market recorded modest gains, the Junior Market climbed to its highest level since the end of January this year and closed in positive territory for the first time in just over five months, having crossed over 4,000 points mark at the close as it continues to consolidate in pursuit of much higher levels as indicated by technical readings, as the overall market ended trading activities below that on Thursday.
 At the close, the JSE Combined Market Index lost 969.18 points to close at 341,482.60, the All Jamaican Composite Index dropped 2,051.59 points to end at 363,287.98, the JSE Main Index fell 1,305.66 points to 326,625.92, while the Junior Market Index popped 27.22 points to close at 4,011.23 and the JSE USD Market Index popped 0.95 points to close at 243.83.
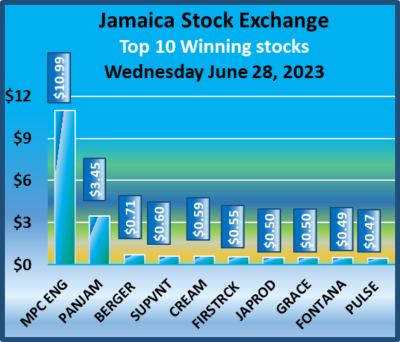
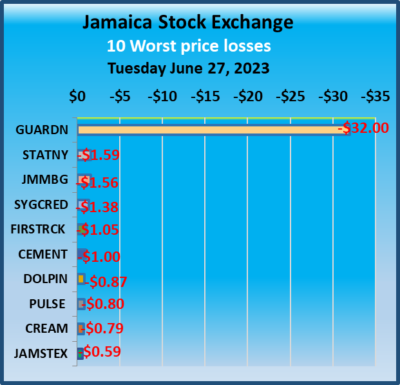
Preference shares with notable price movements but not included in the Main Market TOP10 graphs include Productive Business 10.50% pref share that declined by $99.99 to $1100.01 and Jamaica Public Service 7% fell $6.21 to close at $50.
At the close, investors exchanged 18,632,454 shares in all three markets, down from 24,344,007 stocks on Thursday. The value of stocks trading in the Junior and Main markets was $59.33 million, compared with $61.37 million on Thursday. Trading on the JSE USD market ended with investors exchanging 684,072 shares for US$37,141, up from 266,681 units at US$6,174 on Thursday.
 The market’s PE ratio, the most popular measure used to determine the value of stocks ended at 18.9 on 2022-23 earnings and 12.6 times those for 2023-24 at the close of trading. ICInsider.com PE ratio chart and the more detailed daily report charts provide investors with regularly updated information to help decision-making.
The PE ratio chart covers all ordinary shares on the Jamaica Stock Exchange and shows companies grouped by industry, allowing for easy comparisons between the same sector companies and the overall market. The EPS & PE ratios are based on 2023 and 2024 actual or projected earnings, excluding major one off items.
Investors need pertinent information to successfully navigate numerous investment options in the local stock market. The ICInsider.com PE ratio chart and the more detailed daily report charts provide investors with regularly updated information to help decision-making.
Investors should use the chart to help make rational decisions when investing in stocks close to the average for the sector and not going too far from it unless there are compelling reasons to do so. This approach helps to remove emotions from investment decisions and place them on fundamentals while at the same time not being too far from the majority of investors. Investors who buy when the price of a stock is close to the average will find that they are not inclined to overpay for a stock.
 The net asset value of each company is reported as a guide to assess the value of stocks based on this measure quickly. The chart also shows daily changes in stock prices and the percentage year to date price movement based on the last traded prices.
Dividends paid or payable and yields for each company are shown in the Main and Junior Markets’ daily report charts along with the closing volume pertaining to the highest bid and the lowest offer for each company.
Trading dives on the Jamaica Exchange
Trading ended with mixed fortunes on Thursday, with trading levels falling below that on Wednesday and resulted in the JSE Main index and JSE USD market indices declining but the Junior Markets and the All Jamaican index rose.
 At the close, the JSE Combined Market Index fell 385.17 points to end at 342,451.78, the All Jamaican Composite Index rallied 655.47 points to 365,339.57, but the JSE Main Index dipped 445.92 points to 327,931.58 while the Junior Market Index popped 3.37 points to close at 3,984.01, after closing in on 4,040 points up to last 30 minutes left in the day’s session. The JSE USD Market Index slipped 3.45 points to 242.88.
Preference share with notable price movements but not in the Main Market TOP10 graphs was Jamaica Public Service 7% gaining $1.21 to $56.21.
At the close, investors exchanged 24,344,007 shares in all three markets, up from 23,127,467 stocks on Thursday. The value of stocks trading in the Junior and Main markets was $61.37 million, down from $108.2 million on Thursday. Trading on the JSE USD market ended with investors exchanging 266,681 shares for US$6,174 from 230,849 units at US$10,905 on Thursday.
 The market’s PE ratio, the most popular measure used to determine the value of stocks ended at 18.8 on 2022-23 earnings and 12.6 times those for 2023-24 at the close of trading. ICInsider.com PE ratio chart and the more detailed daily report charts provide investors with regularly updated information to help decision-making.
The PE ratio chart covers all ordinary shares on the Jamaica Stock Exchange and shows companies grouped by industry, allowing for easy comparisons between the same sector companies and the overall market. The EPS & PE ratios are based on 2023 and 2024 actual or projected earnings, excluding major one off items.
Investors need pertinent information to successfully navigate numerous investment options in the local stock market. The ICInsider.com PE ratio chart and the more detailed daily report charts provide investors with regularly updated information to help decision-making.
Investors should use the chart to help make rational decisions when investing in stocks close to the average for the sector and not going too far from it unless there are compelling reasons to do so. This approach helps to remove emotions from investment decisions and place them on fundamentals while at the same time not being too far from the majority of investors. Investors who buy when the price of a stock is close to the average will find that they are not inclined to overpay for a stock.
 The net asset value of each company is reported as a guide to assess the value of stocks based on this measure quickly. The chart also shows daily changes in stock prices and the percentage year to date price movement based on the last traded prices.
Dividends paid or payable and yields for each company are shown in the Main and Junior Markets’ daily report charts along with the closing volume pertaining to the highest bid and the lowest offer for each company.
Trading pull back on the Jamaica Exchange
Trading pulled back from a bounce on Tuesday and return to more recent levels as the Main and Junior Markets index slipped at the close of the Jamaica Stock Exchange on Wednesday and the USD markets rose after the volume and value of stocks traded dropped compared to Tuesday.
 At the close, the JSE Combined Market Index dropped 489.22 points to 342,836.95, the All Jamaican Composite Index dropped 1,461.79 points to finish at 364,684.10, the JSE Main Index fell 487.98 points to settle at 328,377.50. The Junior Market Index slipped 3.70 points to close at 3,980.64. The JSE USD Market Index popped 3.85 points to close at 246.33.
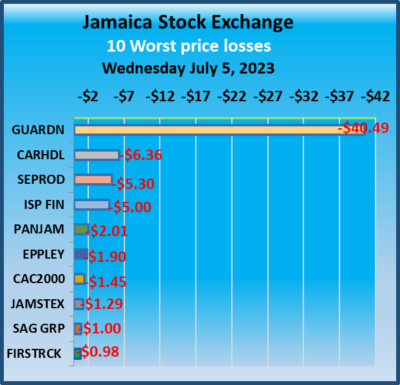
Preference shares with notable price movements but not in the Main Market TOP10 graphs are Eppley 5% preference share gained $2.87 and ended at $20, Eppley 7.50% preference share rallied 61 cents to end at $6.70 and Jamaica Public Service7% advanced $6.12 to $55.
At the close, investors exchanged 23,127,467 shares, in all three markets, down sharply from 83,893,459 stocks on Tuesday. The value of stocks trading in the Junior and Main markets was $108.2 million, a big climb from $654.8 million on Tuesday. Trading on the JSE USD market ended with investors exchanging 230,849 shares for US$10,905 from 447,072 units at US$12,058 on Tuesday.
 The market’s PE ratio, the most popular measure used to determine the value of stocks ended at 18.6 on 2022-23 earnings and 12.5 times those for 2023-24 at the close of trading. ICInsider.com PE ratio chart and the more detailed daily report charts provide investors with regularly updated information to help decision-making.
The PE ratio chart covers all ordinary shares on the Jamaica Stock Exchange and shows companies grouped by industry, allowing for easy comparisons between the same sector companies and the overall market. The EPS & PE ratios are based on 2023 and 2024 actual or projected earnings, excluding major one off items.
Investors need pertinent information to successfully navigate numerous investment options in the local stock market. The ICInsider.com PE ratio chart and the more detailed daily report charts provide investors with regularly updated information to help decision-making.
Investors should use the chart to help make rational decisions when investing in stocks close to the average for the sector and not going too far from it unless there are compelling reasons to do so. This approach helps to remove emotions from investment decisions and place them on fundamentals while at the same time not being too far from the majority of investors. Investors who buy when the price of a stock is close to the average will find that they are not inclined to overpay for a stock.
 The net asset value of each company is reported as a guide to assess the value of stocks based on this measure quickly. The chart also shows daily changes in stock prices and the percentage year to date price movement based on the last traded prices.
Dividends paid or payable and yields for each company are shown in the Main and Junior Markets’ daily report charts along with the closing volume pertaining to the highest bid and the lowest offer for each company.
Trading bumped up over Monday
Trading surged on the Jamaica Stock Exchange on Tuesday, as the Junior Market index rose but the Main and the USD markets declined after trading level more than doubled that on Monday as Eppley traded 8.4 million shares at a value of $358 million and JMMB Group 7.25C preference share traded 5 million units for $96.5 million
 At the close, the JSE Combined Market Index dipped 113.78 points to end at 343,326.17, the All Jamaican Composite Index fell 659.59 points to 366,145.89, the JSE Main Index slipped 272.83 points to 328,865.48 fell 659.59 points to 366,145.89, the JSE Main Index declined 272.83 points to 328,865.48. The Junior Market Index rose 15.38 points to close at 3,984.34. The JSE USD Market Index fell 6.53 points to close at 242.48.
Preference shares with notable price movements but not in the Main Market TOP10 graphs are Eppley 7.50% preference share that dipped $1.08 to $6.09, Jamaica Public Service 7% dropping $8.62 to close at $48.88. Jamaica Public Service 9.5% fell $22 to end at $2978, 138 Student Living preference share rose $17 to end at $105 and Productive Business Solutions 9.75% preference share rallied $12.90 to $103.
At the close, investors exchanged 83,893,459 shares in all three markets, up sharply from 24,673,817 stocks on Monday. The value of stocks trading in the Junior and Main markets was $654.8 million, a big climb from $192.4 million on Monday.  Trading on the JSE USD market ended with an exchange of 447,072 shares for US$12,058 from 1,296,152 units at US$10,636 on Monday.
The market’s PE ratio, the most popular measure used to determine the value of stocks ended at 18.8 on 2022-23 earnings and 12.6 times those for 2023-24 at the close of trading. ICInsider.com PE ratio chart and the more detailed daily report charts provide investors with regularly updated information to help decision-making. The PE ratio chart covers all ordinary shares on the Jamaica Stock Exchange and shows companies grouped by industry, allowing for easy comparisons between the same sector companies and the overall market. The EPS & PE ratios are based on 2023 and 2024 actual or projected earnings, excluding major one off items.
Investors need pertinent information to successfully navigate numerous investment options in the local stock market and should use the chart to help make rational decisions when investing in stocks close to the average for the sector and not going too far from it unless there are compelling reasons to do so. This approach helps to remove emotions from investment decisions and base them on fundamentals while at the same time not being too far from the majority of investors. Investors who buy when the price of a stock is close to the average will find that they are not inclined to overpay for a stock.

The net asset value of each company is reported as a guide to assess the value of stocks based on this measure quickly. The chart also shows daily changes in stock prices and the percentage year to date price movement based on the last traded prices.
Dividends paid or payable and yields for each company are shown in the Main and Junior Markets’ daily report charts along with the closing volume pertaining to the highest bid and the lowest offer for each company.
JSE markets fall in welcoming July
All three markets on Jamaica Stock Exchange closed lower on Monday, but the Junior Market made solid gains throughout the trading session after it opened down to just over 3,909 points within minutes of opening, thanks to a big jump in the prices of Fontana and Stationery and Office Supplies, the market index ended much higher at the close, but the Main and the USD Market suffered sharp reversal to Friday’s close.
 At the close, the JSE Combined Market Index dropped 2,842.58 points to close at 343,439.95, the All Jamaican Composite Index dived 3,768.45 points to 366,805.48, the JSE Main Index declined 2,896.62 points to finish at 329,138.31. The Junior Market Index lost 15.27 points to close at 3,968.96. The JSE USD Market Index fell 7.39 points to close at 249.01.
Preference shares with notable price movements but not in the Main Market TOP10 graphs are Jamaica Public Service 7% shed $9.50 and ended at $57.50 and 138 Student Living preference share advanced $3 in closing at $88.
At the close, investors exchanged 24,673,817 shares, in all three markets, down sharply from 48,899,684 stocks on Friday. The value of stocks trading in the Junior and Main markets was $192.4 million, down from $307.37 million on Friday. Trading on the JSE USD market ended with investors exchanging 1,296,152 shares for US$10,636 down from 179,896 units at US$10,636 on Friday.
 The market’s PE ratio ended at 18.8 on 2022-23 earnings and 12.8 times those for 2023-24 at the close of trading. Investors need pertinent information to successfully navigate numerous investment options in the local stock market. The ICInsider.com PE ratio chart and the more detailed daily report charts provide investors with regularly updated information to help decision-making.
Investors should use the chart to help make rational decisions when investing in stocks close to the average for the sector and not going too far from it unless there are compelling reasons to do so. This approach helps to remove emotions from investment decisions and put in on fundamentals while at the same time not being too far from the majority of investors. Investors who buy when the price of a stock is close to the average will find that they are not inclined to overpay for a stock.
The ICInsider.com PE ratio chart covers all ordinary shares on the Jamaica Stock Exchange and shows companies grouped per industry, allowing easy comparisons between the same sector companies and the overall market.
 The net asset value of each company is reported as a guide to assess the value of stocks based on this measure quickly. The chart also shows daily changes in stock prices and the percentage year to date price movement based on the last traded prices.
Dividends paid or payable and yields for each company are shown in the Main and Junior Markets’ daily report charts along with the closing volume pertaining to the highest bid and the lowest offer for each company.
The EPS & PE ratios are based on 2021 and 2022 actual or projected earnings, excluding major one off items. The PE Ratio is the most popular measure used to determine the value of stocks.
Trading drops as the JSE rises to close June
Stocks closed higher on Jamaica Stock Exchange on Friday, with all three markets recording moderate gains following a decline in the volume and the value of stocks trading on the final day of June.
 In closing, the JSE Combined Market Index climbed 1,755.88 points to end trading at 346,282.53, at the same time, the All Jamaican Composite Index jumped 2,559.69 points to 370,573.93 and the JSE Main Index popped 1,645.95 points to end at 332,034.93. The Junior Market Index rose 24.04 points to 3,984.23, with all the gains coming within a few minutes of closing as the market ended at the highest point since the first day in February this year and is now down a mere 0.01 percent for the year to date. The JSE USD Market Index rose 9.49 points to 256.40.
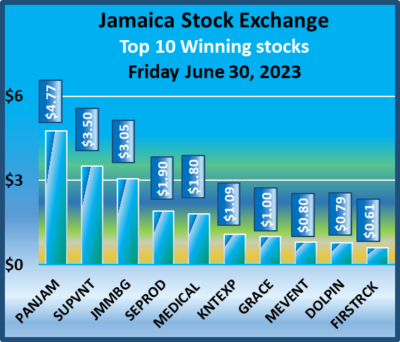
Preference shares with notable price change but not in the Main Market TOP10 graphs are Eppley 7.50% preference share gained 47 cents to close at $7.17, Jamaica Public Service 7% advanced $9.50 to close at $67 and 138 Student Living preference share rallied $10.20 ended at $85.
At the close, investors exchanged 48,899,684 shares, in all three markets, down sharply from 141,130,337 stocks on Thursday. 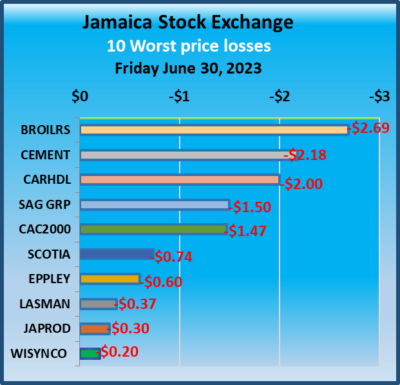 The value of stocks trading in the Junior and Main markets was $307.37 million, down from $415.4 million on Thursday. Trading on the JSE USD market ended with investors exchanging 179,896 shares for US$10,636 down from 323,116 units at US$20,789 on Thursday.
The market’s PE ratio ended at 19.2 on 2022-23 earnings and 12.9 times those for 2023-24 at the close of trading. Investors need pertinent information to successfully navigate numerous investment options in the local stock market. The ICInsider.com PE ratio chart and the more detailed daily report charts provide investors with regularly updated information to help decision-making.
Investors should use the chart to help make rational decisions when investing in stocks close to the average for the sector and not going too far from it unless there are compelling reasons to do so. This approach helps to remove emotions from investment decisions and put in on fundamentals while at the same time not being too far from the majority of investors. Investors who buy when the price of a stock is close to the average will find that they are not inclined to overpay for a stock.
The ICInsider.com PE ratio chart covers all ordinary shares on the Jamaica Stock Exchange and shows companies grouped per industry, allowing easy comparisons between the same sector companies and the overall market.
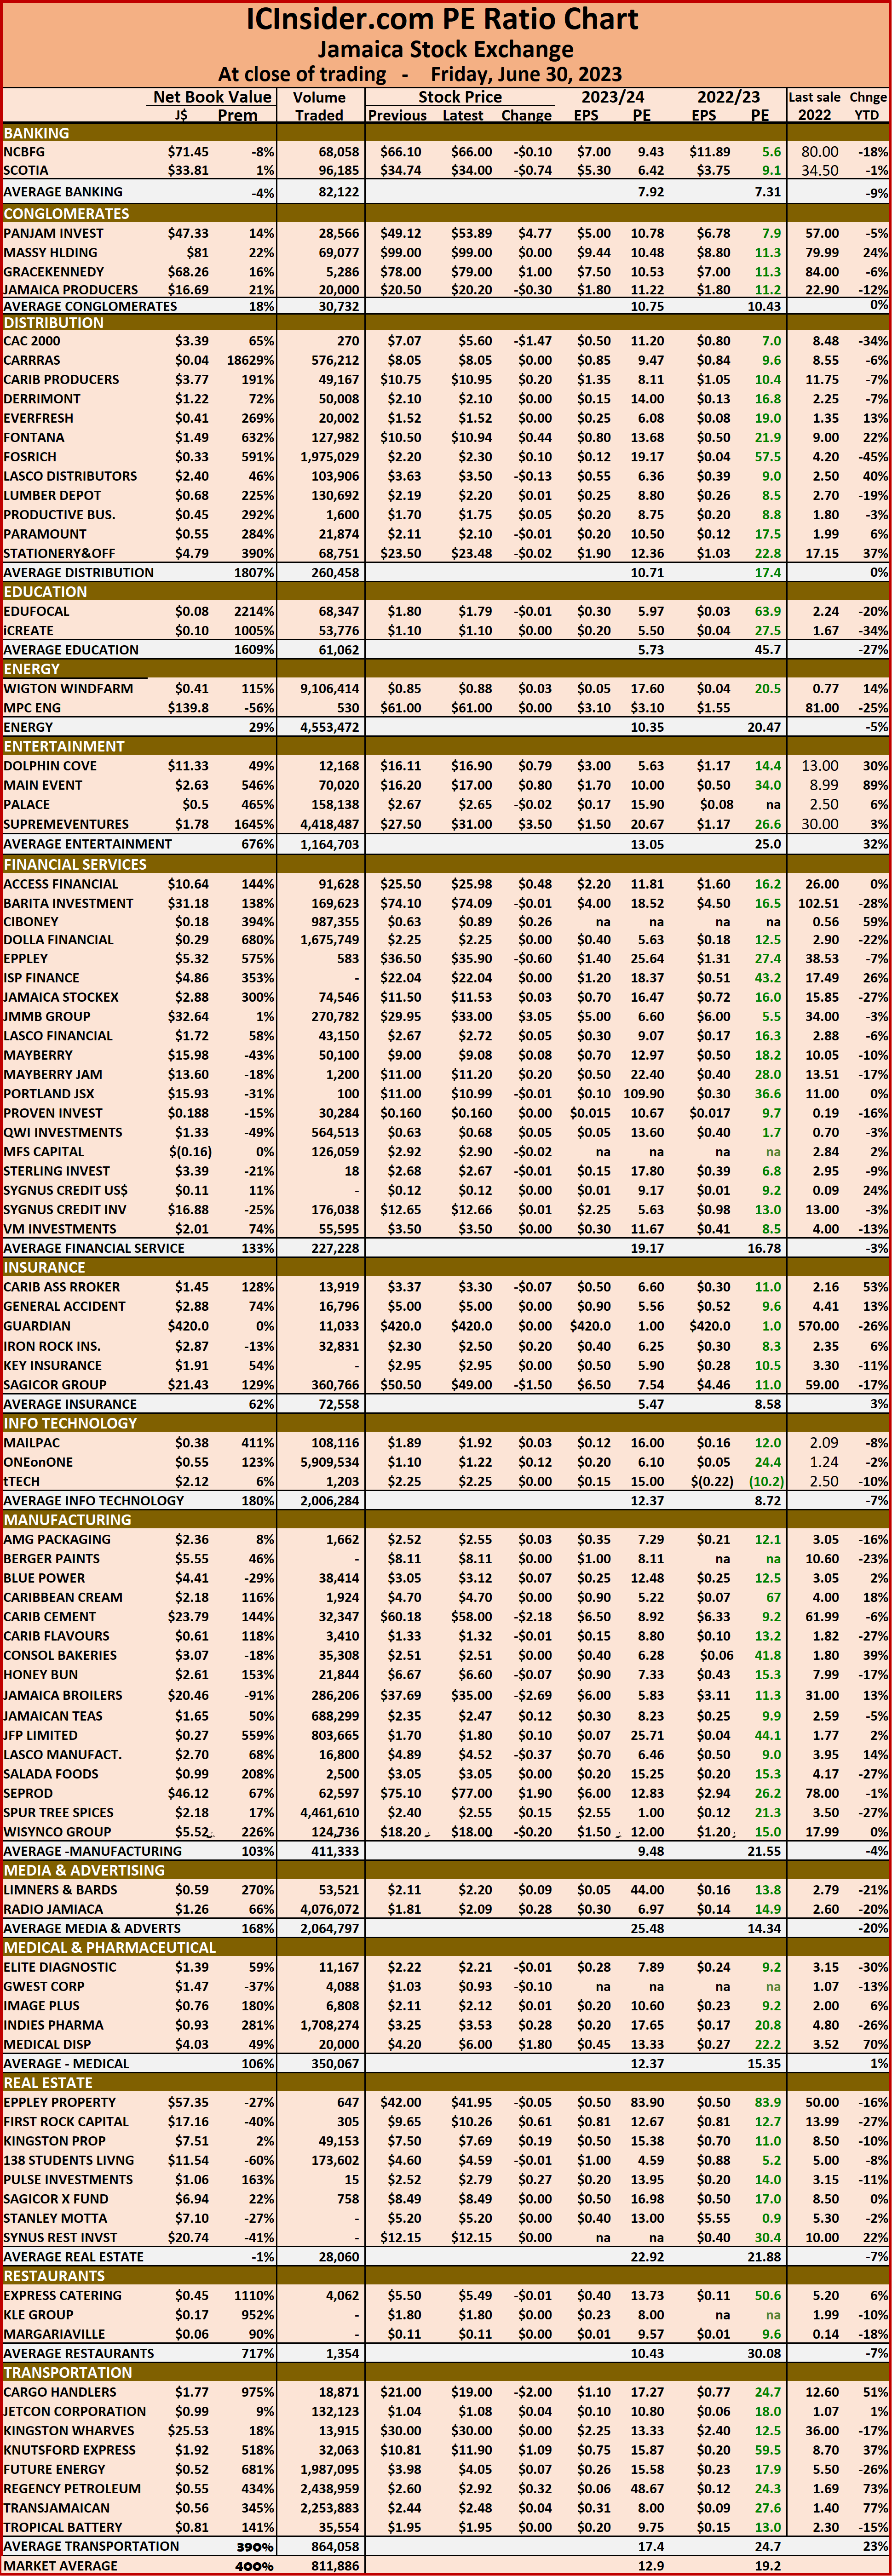 The net asset value of each company is reported as a guide to assess the value of stocks based on this measure quickly. The chart also shows daily changes in stock prices and the percentage year to date price movement based on the last traded prices.
Dividends paid or payable and yields for each company are shown in the Main and Junior Markets’ daily report charts along with the closing volume pertaining to the highest bid and the lowest offer for each company.
The EPS & PE ratios are based on 2021 and 2022 actual or projected earnings, excluding major one off items. The PE Ratio is the most popular measure used to determine the value of stocks.
Jamaican Stock Exchange trading jumps
The volume of stocks trading surged sharply on Thursday on Jamaica Stock Exchange, with JFP Ltd dominating, with 102 million shares for $173 million, with overall trading leading to a bounce in the Main and Junior Market with a slight fall for the JSE USD Market.
 At the close, the JSE Combined Market Index rallied 1,075.36 points to close at 344,526.65, the All Jamaican Composite Index rose 710.07 points to 368,014.24, the JSE Main Index popped 630.80 points to close at 330,388.98. The Junior Market Index jumped 53.19 points to 3,960.19 and fully recovered the 52.33 points loss on Tuesday, while the JSE USD Market Index lost 1.51 points to end trading at 246.91.
Preference share with notable price movements but not in the Main Market TOP10 graphs is Jamaica Public Service 7% advanced $7.50 to $57.50.
At the close, investors exchanged 141,130,337 shares, in all three markets, up sharply from 33,998,142 stocks on Wednesday. The value of stocks trading in the Junior and Main markets was $415.4 million, up from $253.9 million on Wednesday. Trading on the JSE USD market ended with investors exchanging 323,116 shares for US$20,789 down from 490,501 units at US$293,958 on Wednesday.
 The market’s PE ratio ended at 18.7 on 2022-23 earnings and 12.6 times those for 2023-24 at the close of trading. Investors need pertinent information to successfully navigate numerous investment options in the local stock market. The ICInsider.com PE ratio chart and the more detailed daily report charts provide investors with regularly updated information to help decision-making.
Investors should use the chart to help make rational decisions when investing in stocks close to the average for the sector and not going too far from it unless there are compelling reasons to do so. This approach helps to remove emotions from investment decisions and put in on fundamentals while at the same time not being too far from the majority of investors. Investors who buy when the price of a stock is close to the average will find that they are not inclined to overpay for a stock.
The ICInsider.com PE ratio chart covers all ordinary shares on the Jamaica Stock Exchange and shows companies grouped per industry, allowing easy comparisons between the same sector companies and the overall market.
The net asset value of each company is reported as a guide to assess the value of stocks based on this measure quickly. The chart also shows daily changes in stock prices and the percentage year to date price movement based on the last traded prices.
 Dividends paid or payable and yields for each company are shown in the Main and Junior Markets’ daily report charts along with the closing volume pertaining to the highest bid and the lowest offer for each company.
The EPS & PE ratios are based on 2021 and 2022 actual or projected earnings, excluding major one off items. The PE Ratio is the most popular measure used to determine the value of stocks.
Gains in all 3 JSE markets
Stocks gained in all three Jamaica Stock Exchange markets on Wednesday but the Junior Market failed to make major inroads into the sharp fall on Tuesday. Trading dropped back from the previous day’s heightened trades that were boosted by the above average daily trade in NCB Financial of 16.05 million shares for $1.06 billion.
 At the close, the JSE Combined Market Index climbed 869.73 points to close at 343,451.29, the All Jamaican Composite Index rose 2,113.23 points to 367,304.17, the JSE Main Index popped 902.81 points to 329,758.18, the Junior Market Index inched 2.98 points higher to 3,907.00, while the JSE USD Market Index jumped 7.05 points to finish at 248.42.
Preference shares with notable price movements but are not in the Main Market TOP10 graphs are Productive Business 10.50% preference share lost $50 to close at $1200, Eppley 7.25% preference share dropped $2.81 to $16.19, Eppley 7.50% preference share lost $1.08 in closing at $6.09 and Jamaica Public Service 7% advanced $10.57 to close at $50.
At the close, investors exchanged 33,998,142 shares in all three markets, down from 41,956,342 stocks on Tuesday. The value of stocks trading in the Junior and Main markets was $253.9 million, up from $1.18 billion on Tuesday. 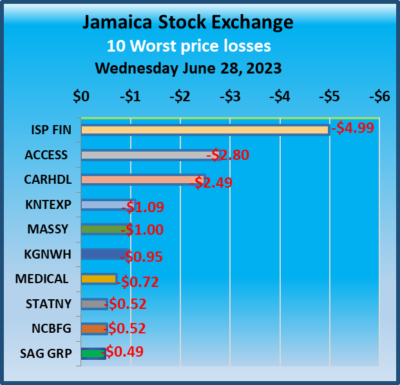 Trading on the JSE USD market resulted in investors exchanging 490,501 shares for US$293,958 up from 183,070 units at US$17,969 on Tuesday.
The market’s PE ratio ended at 18.6 on 2022-23 earnings and 12.5 times those for 2023-24 at the close of trading. Investors need pertinent information to successfully navigate numerous investment options in the local stock market. The ICInsider.com PE ratio chart and the more detailed daily report charts provide investors with regularly updated information to help decision-making.
Investors should use the chart to help make rational decisions when investing in stocks close to the average for the sector and not going too far from it unless there are compelling reasons to do so. This approach helps to remove emotions from investment decisions and put in on fundamentals while at the same time not being too far from the majority of investors. Investors who buy when the price of a stock is close to the average will find that they are not inclined to overpay for a stock.
The ICInsider.com PE ratio chart covers all ordinary shares on the Jamaica Stock Exchange and shows companies grouped per industry, allowing easy comparisons between the same sector companies and the overall market.
 The net asset value of each company is reported as a guide to assess the value of stocks based on this measure quickly. The chart also shows daily changes in stock prices and the percentage year to date price movement based on the last traded prices.
Dividends paid or payable and yields for each company are shown in the Main and Junior Markets’ daily report charts along with the closing volume pertaining to the highest bid and the lowest offer for each company.
The EPS & PE ratios are based on 2021 and 2022 actual or projected earnings, excluding major one off items. The PE Ratio is the most popular measure used to determine the value of stocks.
NCB pushes trading on JSE
The Jamaica stock market failed to hold on to Monday’s gains as the Junior Market had a big fall, while the Main Market slipped but the JSE USD Market jumped sharply as trading picked up considerably compared with that on Monday with NCB Financial swelling trading with 16.05 million shares, with a value of $1.06 billion.
 At the close, the JSE Combined Market Index fell 958.7points to 342,581.56, the All Jamaican Composite Index rose 772.25 points to end at 365,190.94, the JSE Main Index shed 518.40 points to settle at 328,855.37, the Junior Market Index dropped 51.89 points to settle at 3,904.02, while the JSE USD Market Index jumped 1.07 points to finish at 241.37.
Preference shares with notable price movements but are not in the Main Market TOP10 graphs are
Eppley 7.75% preference share advanced $1.02 to $20.02, Jamaica Public Service 7% declined $6.96 to $39.43, JMMB Group 7.25% preference share dipped 53 cents to $3.53 and 138 Student Living preference share shed $6.20 in closing at $74.80.
At the close, investors exchanged 41,956,342 shares in all three markets, up from 22,226,900 stocks on Monday. The value of stocks trading in the Junior and Main markets was $1.18 billion, up from $158.6 million on Monday. Trading on the JSE USD market resulted in investors exchanging 183,070 shares for US$17,969 compared to 261,038 units at US$25,992 on Monday.
 The market’s PE ratio ended at 18.5 on 2022-23 earnings and 12.5 times those for 2023-24 at the close of trading. Investors need pertinent information to successfully navigate numerous investment options in the local stock market. The ICInsider.com PE ratio chart and the more detailed daily report charts provide investors with regularly updated information to help decision-making.
Investors should use the chart to help make rational decisions when investing in stocks close to the average for the sector and not going too far from it unless there are compelling reasons to do so. This approach helps to remove emotions from investment decisions and put in on fundamentals while at the same time not being too far from the majority of investors. Investors who buy when the price of a stock is close to the average will find that they are not inclined to overpay for a stock.
The ICInsider.com PE ratio chart covers all ordinary shares on the Jamaica Stock Exchange and shows companies grouped on an industry basis, allowing easy comparisons between the same sector companies and the overall market.
The net asset value of each company is reported as a guide to assess the value of stocks based on this measure quickly. The chart also shows daily changes in stock prices and the percentage year to date price movement based on the last traded prices.
 Dividends paid or payable and yields for each company are shown in the Main and Junior Markets’ daily report charts along with the closing volume pertaining to the highest bid and the lowest offer for each company.
The EPS & PE ratios are based on 2021 and 2022 actual or projected earnings, excluding major one off items. The PE Ratio is the most popular measure used to determine the value of stocks.