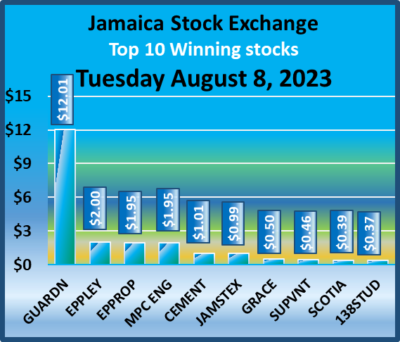
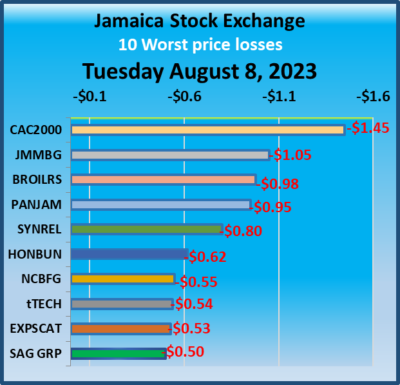
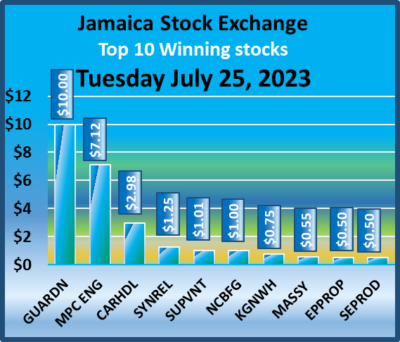
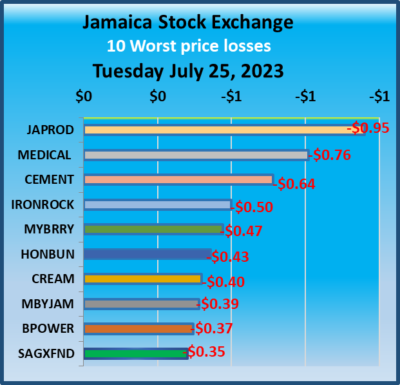
The Junior Market Index plunged 59.53 points to close at 3,882.497 points on the resumption of trading on Tuesday after the market was closed for the Independence holiday on Monday. In contrast, the Main Market and JSE US dollar Market rose moderately at the close of the Jamaica Stock Exchange on Tuesday while the volume of stocks traded declined from Friday level but with a higher value.
 At the close, the JSE Combined Market Index popped 197.70 points to close at 340,527.20, the All Jamaican Composite Index climbed 153.51 points to close at 361,747.17, the JSE Main Index advanced 653.62 points to 326,741.46, while the JSE USD Market Index popped 1.05 points to close at 241.67.
Preference shares that ended with notable price changes were Jamaica Public Service 7% declining $14 to close at $55, 138 Student Living preference share shedding $15 to close at $84.98 and Productive Business Solutions 9.75% preference share gaining $1.45 to end at $102.95.
At the close, investors had dealings in 23,473,622 shares in all three markets, up from 20,248,937 stocks on Friday. The value of stocks trading in the Junior and Main Markets ended at $71.38 million, down from $133.6 million on Friday. Trading on the JSE USD market ended with investors exchanging 37,378 shares for US$906, compared with 745,414 units at US$22,909 on Friday.
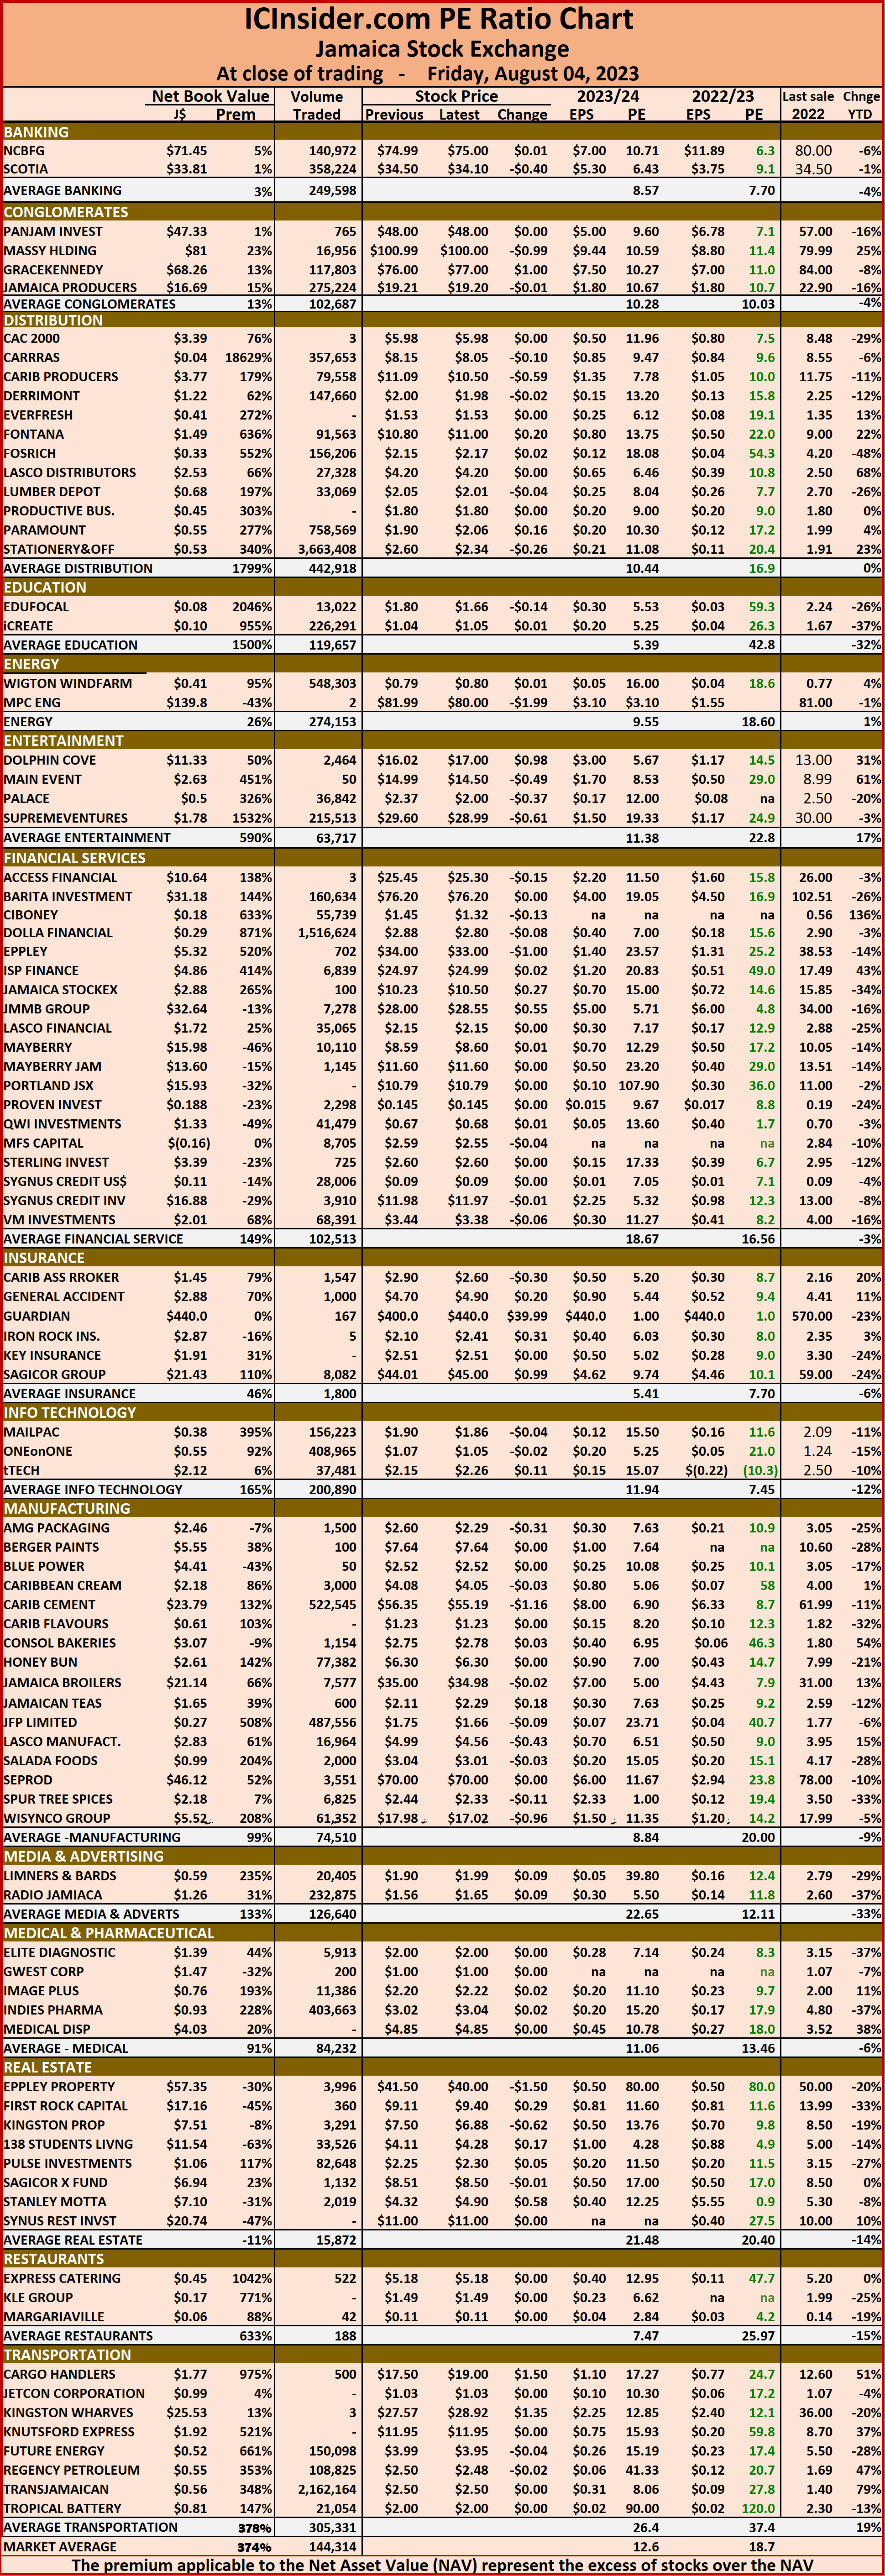
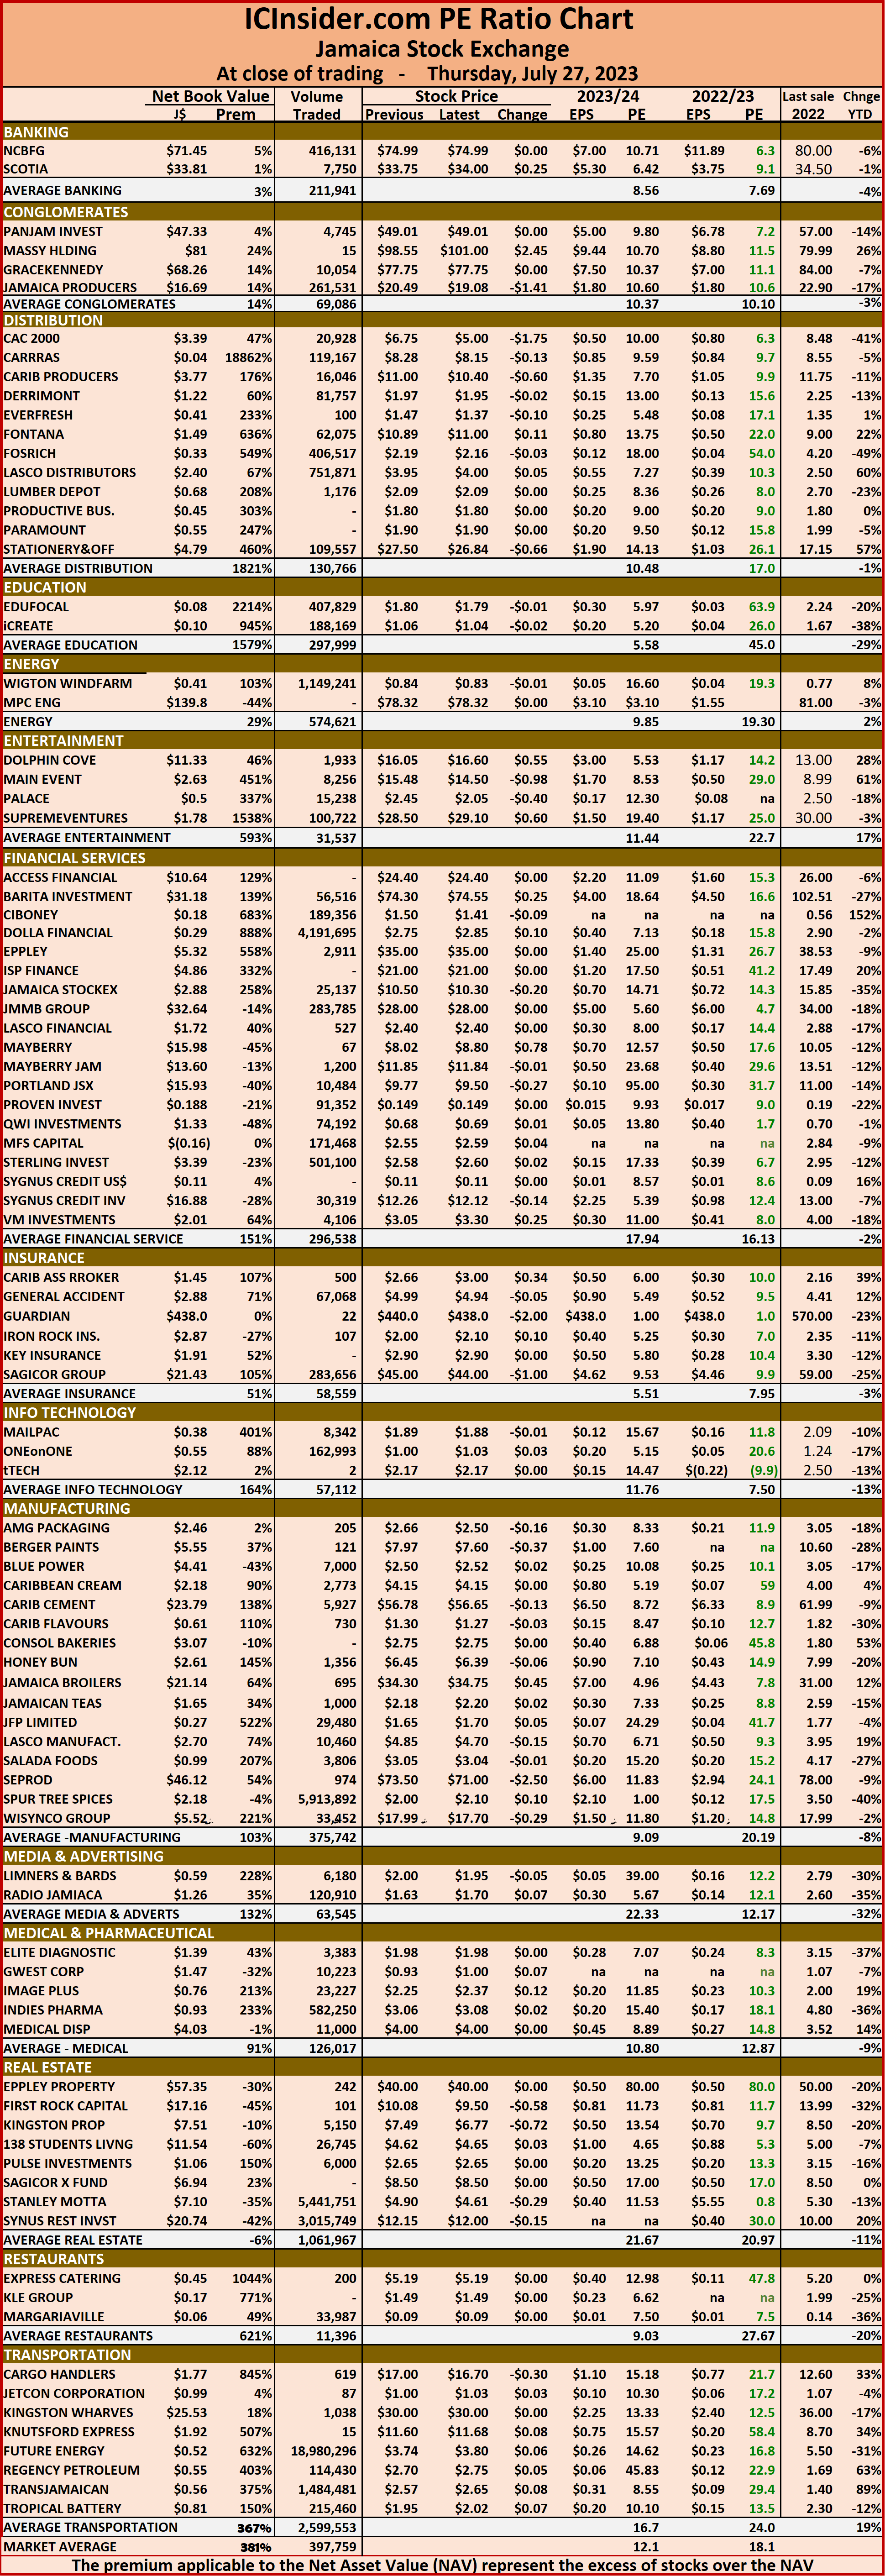
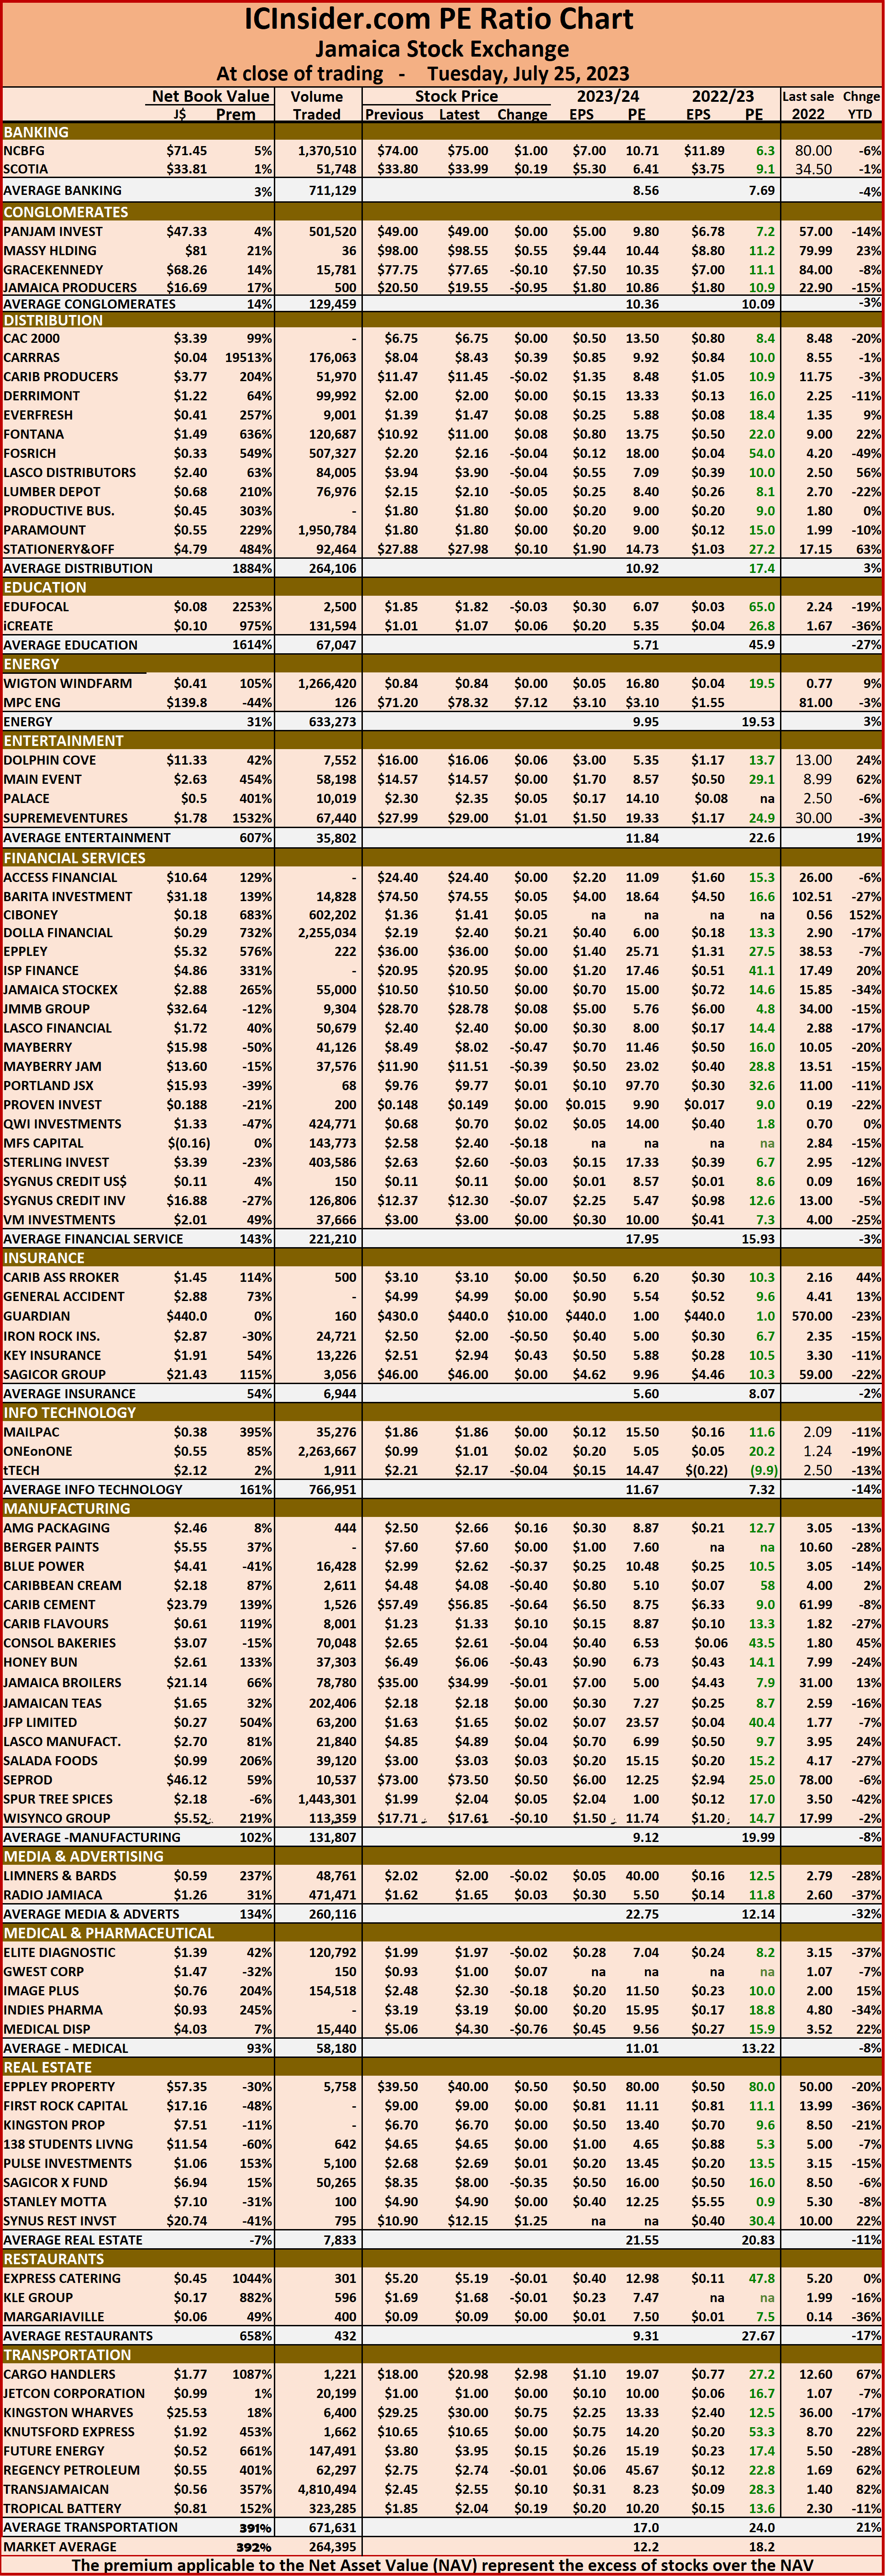
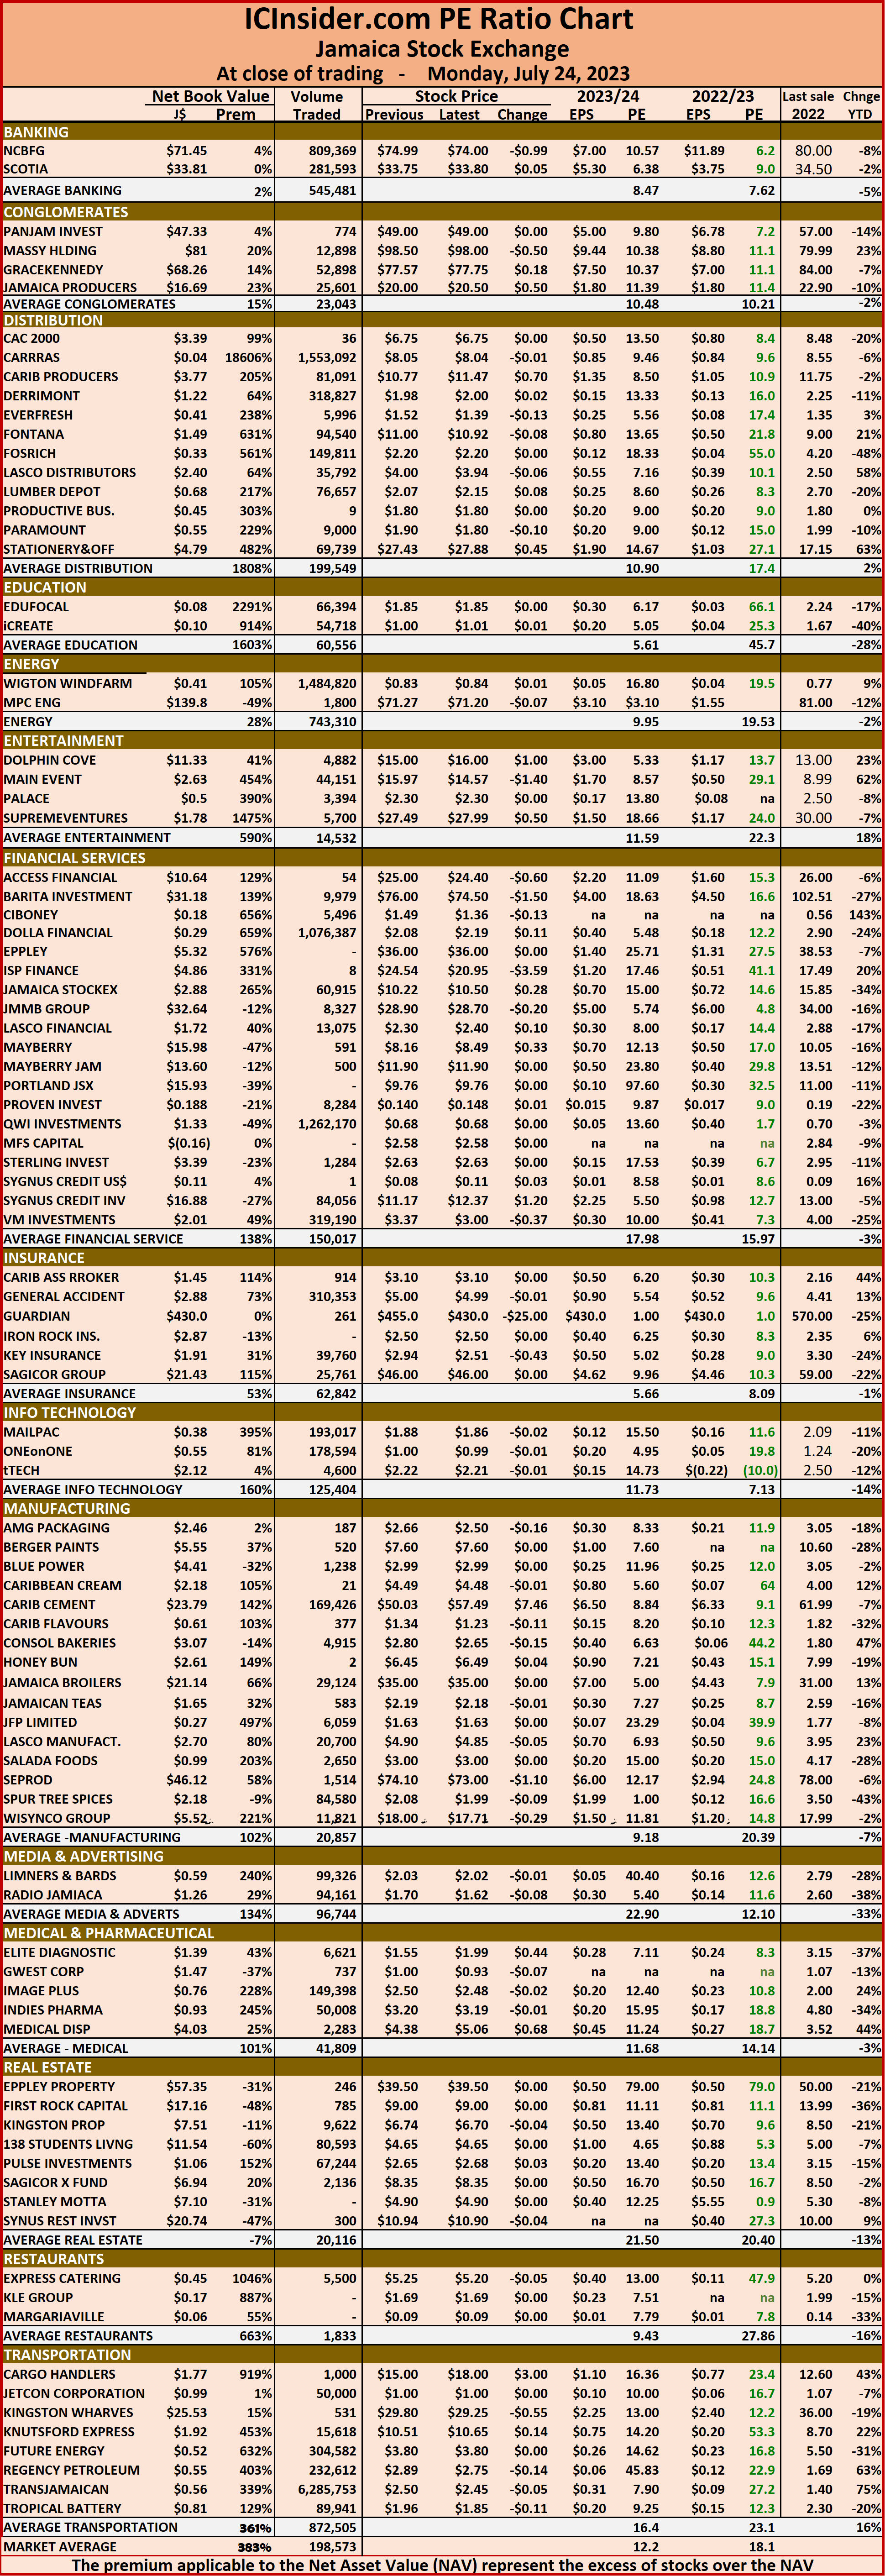
 The market’s PE ratio, the most popular measure used to determine the value of stocks, ended at 18.7 on 2022-23 earnings and 12.6 times those for 2023-24 at the close of trading. ICInsider.com PE ratio chart and the more detailed daily report charts provide investors with regularly updated information to help decision-making.
The PE ratio chart covers all ordinary shares on the Jamaica Stock Exchange. It shows companies grouped by industry, allowing for easy comparisons between the same sector companies and the overall market. The EPS & PE ratios are based on 2023 and 2024 actual or projected earnings, excluding major one off items.
Investors need pertinent information to successfully navigate numerous investment options in the local stock market. The ICInsider.com PE ratio chart and the more detailed daily report charts provide investors with regularly updated information to help decision-making.
Investors should use the chart to help make rational decisions when investing in stocks close to the average for the sector and not going too far from it unless there are compelling reasons to do so. This approach helps to remove emotions from investment decisions and place them on fundamentals while at the same time not being too far from the majority of investors. Investors who buy when the price of a stock is close to the average will find that they are not inclined to overpay for a stock.
 The net asset value of each company is reported as a guide to assess the value of stocks based on this measure quickly. The chart also shows daily changes in stock prices and the percentage year to date price movement based on the last traded prices.
Dividends paid or payable and yields for each company are shown in the Main and Junior Markets’ daily report charts, along with the closing volume pertaining to the highest bid and the lowest offer for each company.
Big slip for Juniors while majors rise
Main and Junior Markets rise
The JSE US dollar Market was the only of the three Jamaica Stock Exchanges that declined at the close on Friday while the volume and value of stocks traded plunged compared to Thursday’s trade which was boosted by trading of 113 million shares valued at $167 million in Transjamaican preference share.
 At the close, the JSE Combined Market Index dipped 197.70 points to close at 340,347.08, the All Jamaican Composite Index advanced 519.86 points to end at 361,593.66, the JSE Main Index declined 437.40 points to settle at 326,087.84, the Junior Market Index gained 22.99 points on top of the 24.51 points picked on Thursday to conclude trading at 3,942.02 and thus recovered all of Wednesday’s loss, while the JSE USD Market Index fell 7.39 points to close at 240.60.
Jamaica Public Service 7% was the only Preference shares that ended with notable price changes, with an advance of $7.52 to $69.
At the close, investors had dealings in 20,248,937 shares, in all three markets, up sharply down from 135,167,230 stocks on Thursday. The value of stocks trading in the Junior and Main Markets ended at $133.6 million, down from $261.89 million on Thursday. Trading on the JSE USD market ended with investors exchanging 745,414 shares for US$22,909, compared with 243,793 units at US$38,581 on Thursday.
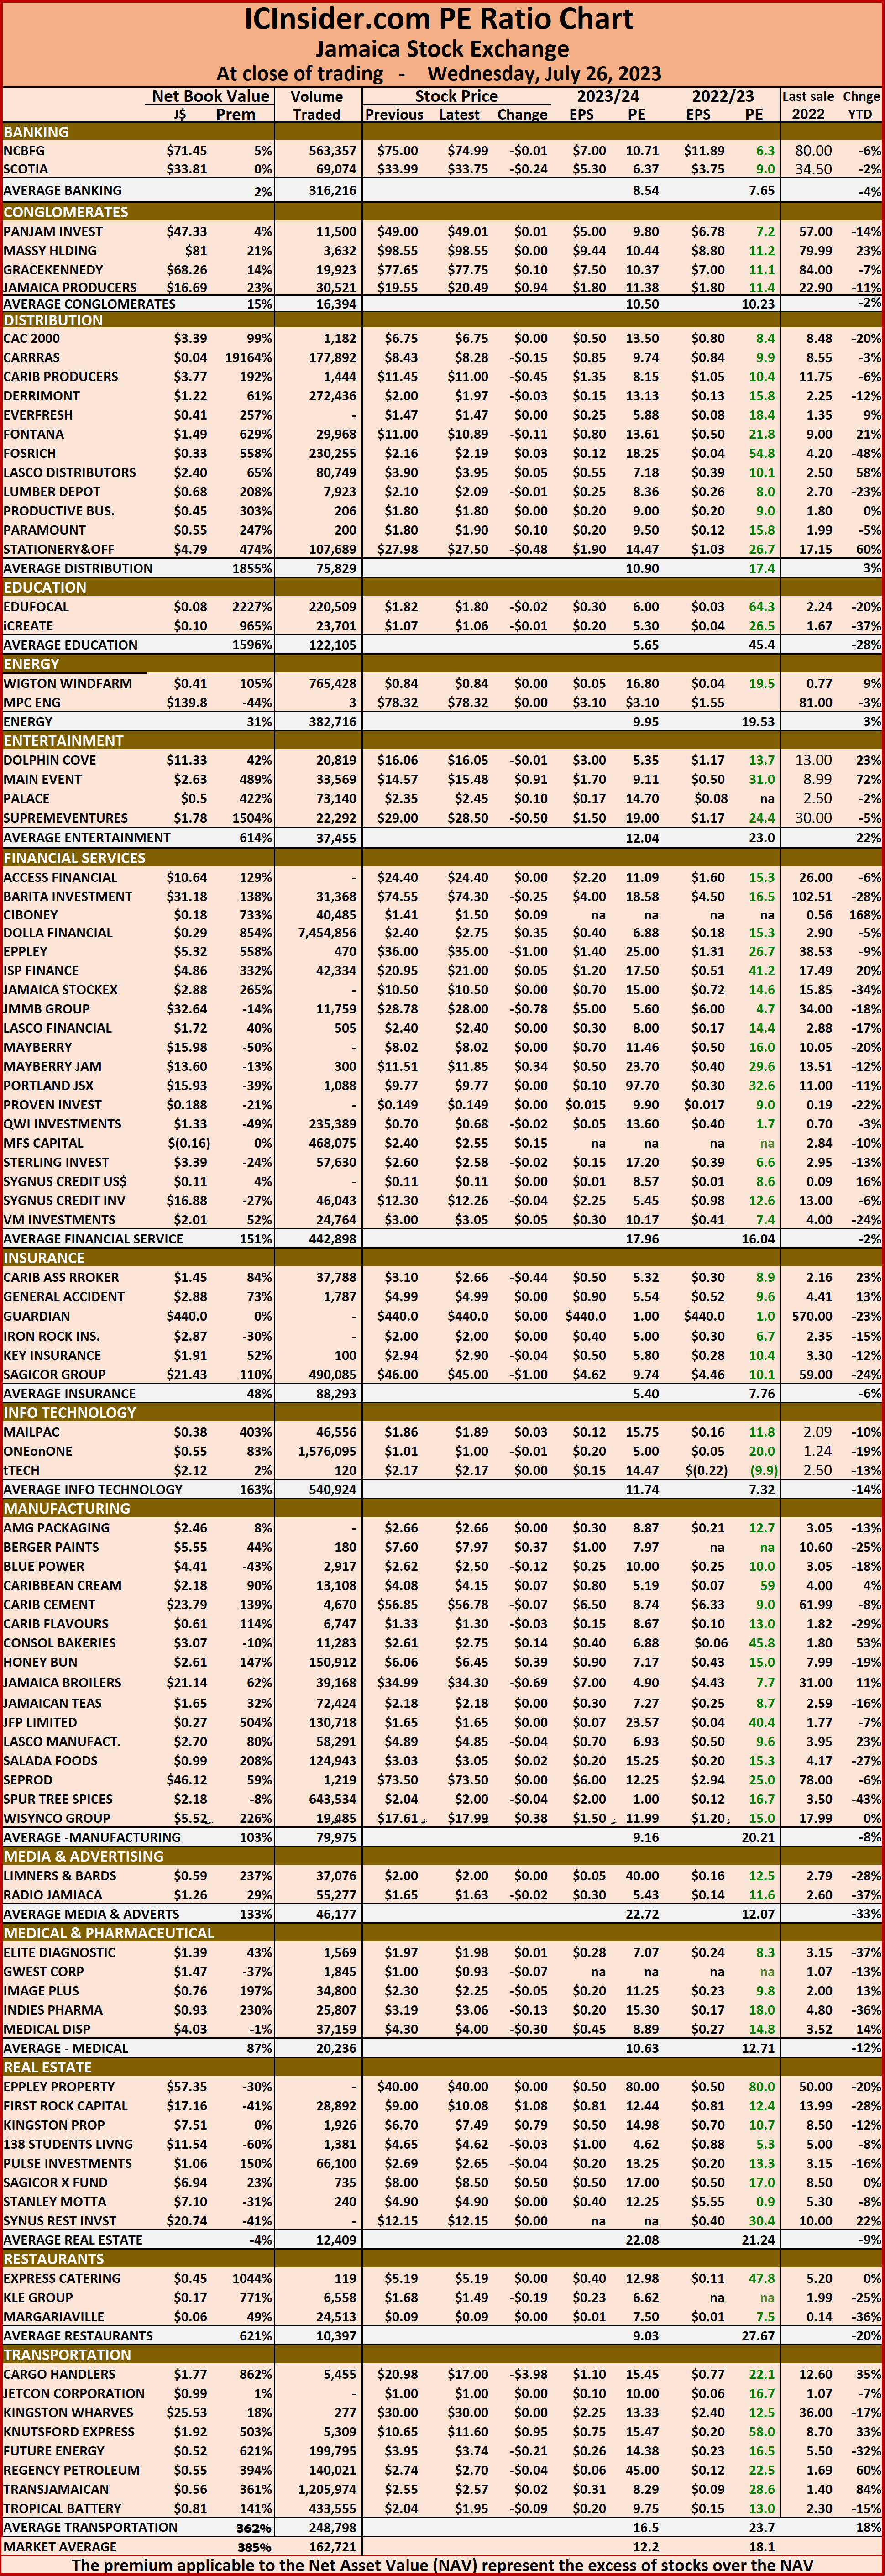
 The market’s PE ratio, the most popular measure used to determine the value of stocks ended at 18.7 on 2022-23 earnings and 12.6 times those for 2023-24 at the close of trading. ICInsider.com PE ratio chart and the more detailed daily report charts provide investors with regularly updated information to help decision-making.
The PE ratio chart covers all ordinary shares on the Jamaica Stock Exchange. It shows companies grouped by industry, allowing for easy comparisons between the same sector companies and the overall market. The EPS & PE ratios are based on 2023 and 2024 actual or projected earnings, excluding major one off items.
Investors need pertinent information to successfully navigate numerous investment options in the local stock market. The ICInsider.com PE ratio chart and the more detailed daily report charts provide investors with regularly updated information to help decision-making.
Investors should use the chart to help make rational decisions when investing in stocks close to the average for the sector and not going too far from it unless there are compelling reasons to do so. This approach helps to remove emotions from investment decisions and place them on fundamentals while at the same time not being too far from the majority of investors. Investors who buy when the price of a stock is close to the average will find that they are not inclined to overpay for a stock.
 The net asset value of each company is reported as a guide to assess the value of stocks based on this measure quickly. The chart also shows daily changes in stock prices and the percentage year to date price movement based on the last traded prices.
Dividends paid or payable and yields for each company are shown in the Main and Junior Markets’ daily report charts along with the closing volume pertaining to the highest bid and the lowest offer for each company.
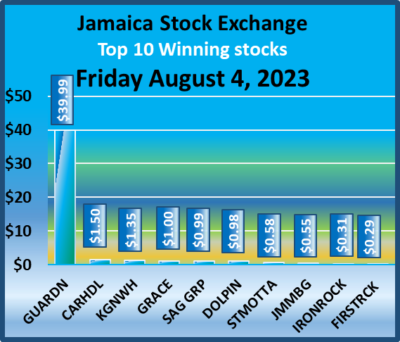
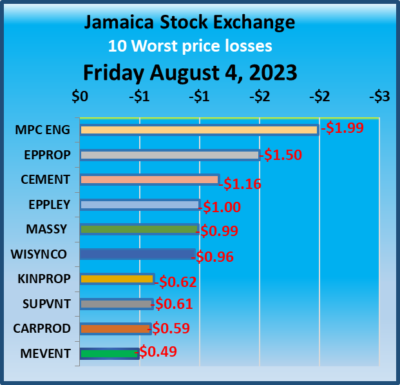
Drop in JSE Main and USD markets
The Main and JSE US dollar markets declined at the close of trading on the Jamaica Stock Exchange on Thursday while the Junior Market made a moderate recovery from Wednesday’s loss as the volume and value of stocks traded jumped sharply compared to Wednesday following trading of 113 million shares valued at $167 million in Transjamaican preference share.
 At the close, the JSE Combined Market Index shed 2,140.83 points to end at 340,544.78, the All Jamaican Composite Index declined 4,924.76 points to 361,073.80, the JSE Main Index fell 2,534.77 points to close at 326,525.24, while the Junior Market Index climbed 24.51 points to close at 3,919.03 and the JSE USD Market Index slipped 5.29 points to finish at 247.99.
Preference shares with notable price changes include Eppley 7.50% preference share shedding 61 cents to end at $6, Jamaica Public Service 7% advancing $11.48 to $61.48, Productive Business 10.50% preference share declining $55 to $1,100 and Productive Business Solutions 9.75% preference share popping $2.50 in closing at $101.50.
At the close, investors had dealings in 135,167,230 shares in all three markets, up sharply from 20,722,918 stocks on Wednesday.  The value of stocks trading in the Junior and Main Markets ended at $261.89 million, up from $80.9 million on Wednesday. Trading on the JSE USD market ended with investors exchanging 243,793 shares for US$38,581 compared with 174,417 units at US$27,278 on Wednesday.
The market’s PE ratio, the most popular measure used to determine the value of stocks ended at 18.8 on 2022-23 earnings and 12.6. times those for 2023-24 at the close of trading. ICInsider.com PE ratio chart and the more detailed daily report charts provide investors with regularly updated information to help decision-making.
The PE ratio chart covers all ordinary shares on the Jamaica Stock Exchange. It shows companies grouped by industry, allowing for easy comparisons between the same sector companies and the overall market. The EPS & PE ratios are based on 2023 and 2024 actual or projected earnings, excluding major one off items.
Investors need pertinent information to successfully navigate numerous investment options in the local stock market. The ICInsider.com PE ratio chart and the more detailed daily report charts provide investors with regularly updated information to help decision-making.
Investors should use the chart to help make rational decisions when investing in stocks close to the average for the sector and not going too far from it unless there are compelling reasons to do so. This approach helps to remove emotions from investment decisions and place them on fundamentals while at the same time not being too far from the majority of investors. Investors who buy when the price of a stock is close to the average will find that they are not inclined to overpay for a stock.
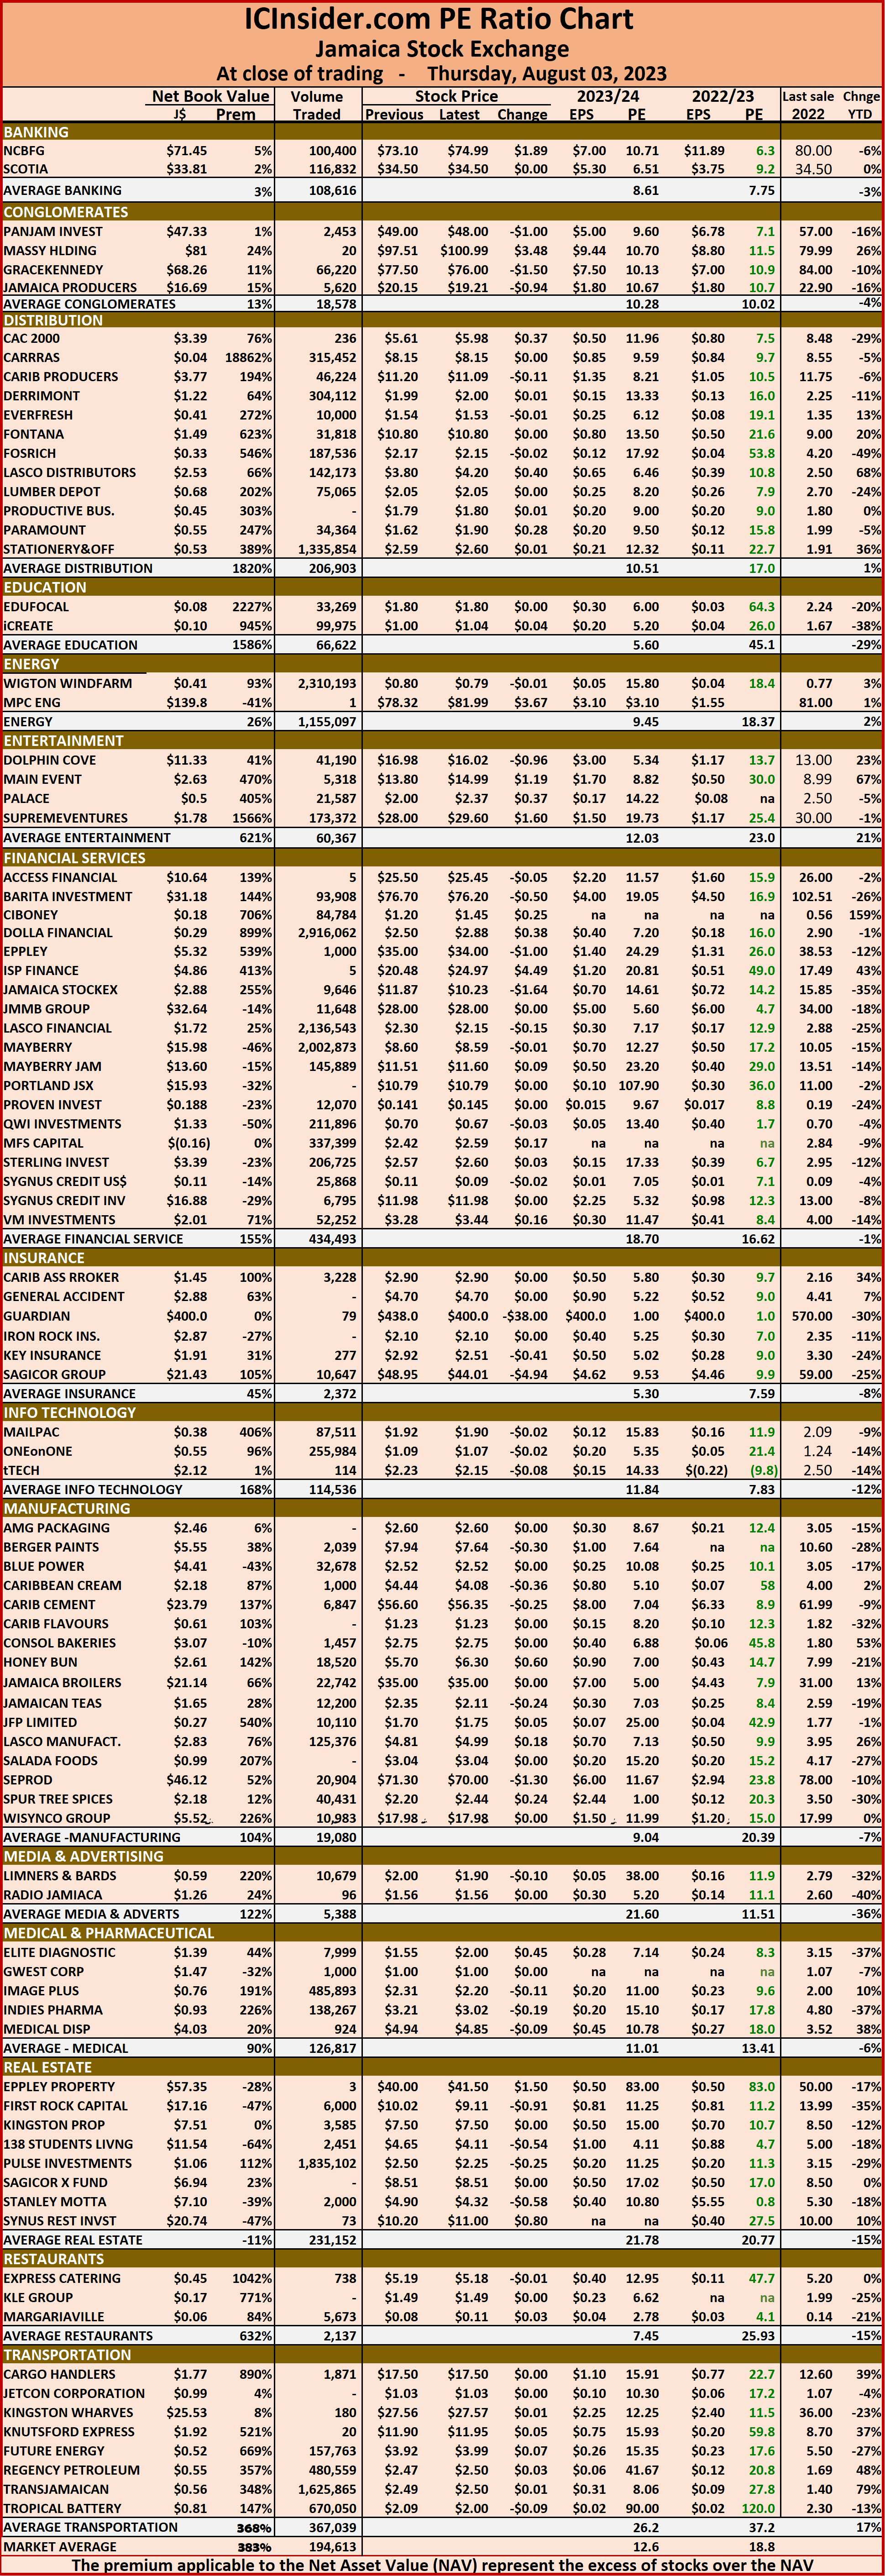 The net asset value of each company is reported as a guide to assess the value of stocks based on this measure quickly. The chart also shows daily changes in stock prices and the percentage year to date price movement based on the last traded prices.
Dividends paid or payable and yields for each company are shown in the Main and Junior Markets’ daily report charts along with the closing volume pertaining to the highest bid and the lowest offer for each company.
Main Market and JSE stocks start August with gains
The Main and JSE US dollar markets gained at the close of trading on the Jamaica Stock Exchange to start the new month on a positive note on Tuesday, but the Junior Market suffered a tidy fall as the volume and value of stocks traded fell compared to that on Monday.
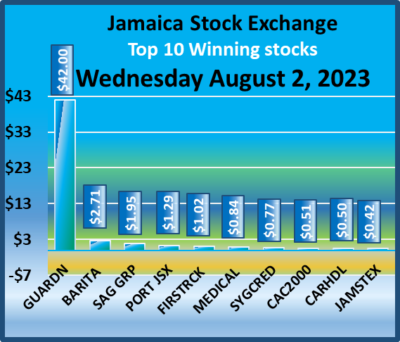 At the close, the JSE Combined Market Index jumped 2,060.70 points to 342,685.61, the All Jamaican Composite Index climbed 809.52 points to 365,998.56, the JSE Main Index rallied 2,654.62 points to 329,060.01, while the Junior Market Index declined 45.48 points to 3,894.52 and the JSE USD Market Index rallied 8.29 points to finish at 253.28.
Trading of Preference shares ended with notable price changes for Productive Business 10.50% preference share increasing by $5 to $1,155, Jamaica Public Service 7% declining $2.02 to end at $50, 138 Student Living preference share advancing $1.98 to close at $99.98 and Productive Business Solutions 9.75% preference share dropped $2.50 to end at $99.
At the close, investors exchanged 20,722,918 shares in all three markets, down from 35,539,078 stocks on Monday. The value of stocks trading in the Junior and Main Markets ended at $80.9 million, down from $139.59 million on Monday. 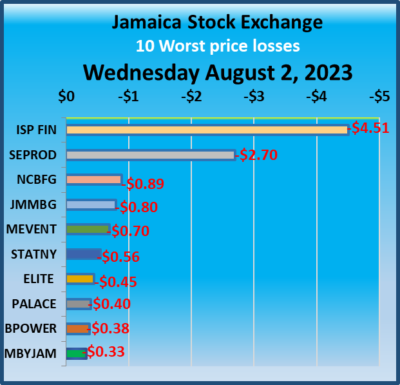 Trading on the JSE USD market ended with investors trading 174,417 shares for US$27,278, compared with 953,823 units at US$22,262 on Monday.
The market’s PE ratio, the most popular measure used to determine the value of stocks ended at 18.8 on 2022-23 earnings and 12.6.
times those for 2023-24 at the close of trading. ICInsider.com PE ratio chart and the more detailed daily report charts provide investors with regularly updated information to help decision-making.
The PE ratio chart covers all ordinary shares on the Jamaica Stock Exchange. It shows companies grouped by industry, allowing for easy comparisons between the same sector companies and the overall market. The EPS & PE ratios are based on 2023 and 2024 actual or projected earnings, excluding major one off items.
Investors need pertinent information to successfully navigate numerous investment options in the local stock market. The ICInsider.com PE ratio chart and the more detailed daily report charts provide investors with regularly updated information to help decision-making.
Investors should use the chart to help make rational decisions when investing in stocks close to the average for the sector and not going too far from it unless there are compelling reasons to do so. This approach helps to remove emotions from investment decisions and place them on fundamentals while at the same time not being too far from the majority of investors. Investors who buy when the price of a stock is close to the average will find that they are not inclined to overpay for a stock.
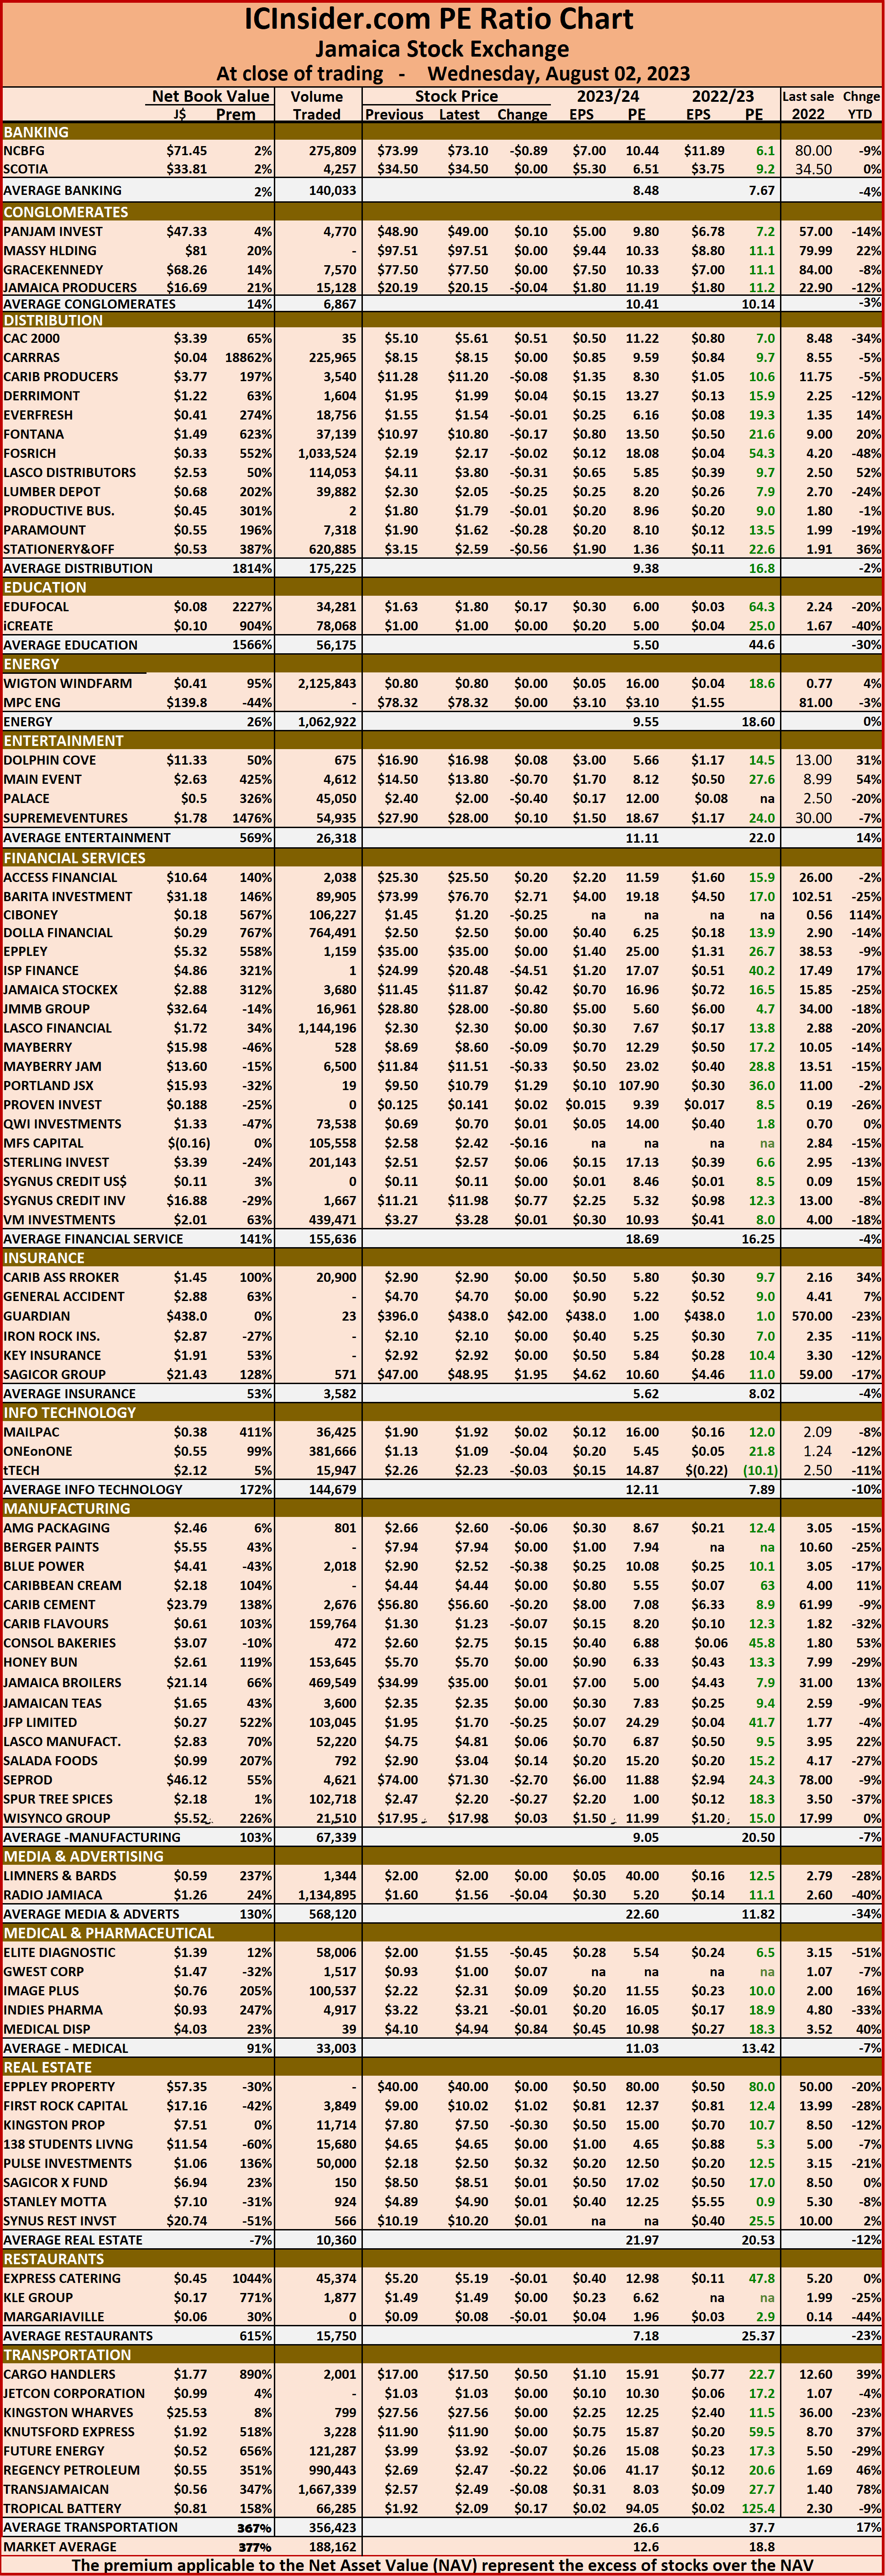 The net asset value of each company is reported as a guide to assess the value of stocks based on this measure quickly. The chart also shows daily changes in stock prices and the percentage year to date price movement based on the last traded prices.
Dividends paid or payable and yields for each company are shown in the Main and Junior Markets’ daily report charts along with the closing volume pertaining to the highest bid and the lowest offer for each company.
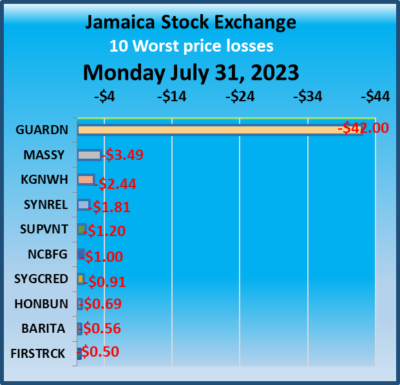
Stocks closed out July with gains on JSE Markets
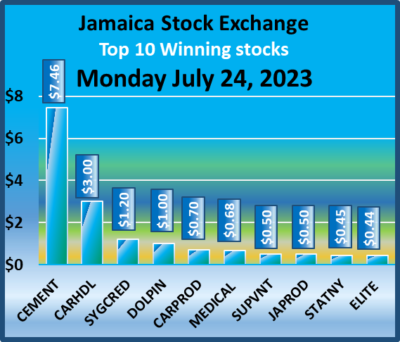
All three markets recorded gains at the close of trading on the Jamaica Stock Exchange to close out July on a positive note on Monday, with an increase in the volume of stocks traded but with a lower value than Friday.
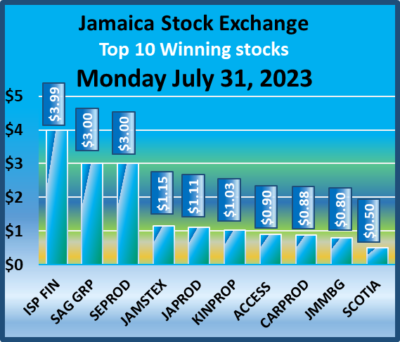 At the end of trading, the JSE Combined Market Index climbed 1,304.64 points to close at 340,624.91, the All Jamaican Composite Index rose 5,102.37 points to end at 365,189.04, the JSE Main Index rallied 1,135.31 points to 326,405.39, while the Junior Market Index added 30.73 points to 3,940.00 and the JSE USD Market Index added 0.94 points to end at 244.99.
Trading of Preference shares with notable price changes are Productive Business 10.50% preference share with a fall of $100 in closing at $1150, Jamaica Public Service 7% losing $9.18 and ending at $52.02 and 138 Student Living preference share dropping $2 to $9.
At the close, investors exchanged 35,539,078 shares in all three markets, up sharply from 22,196,180 stocks on Friday. The value of stocks trading in the Junior and Main Markets ended at $139.59 million, down from $151.67 million on Friday. Trading on the JSE USD market ended with investors exchanging 953,823 shares for US$22,262, up from 394,211 units at US$7,160 on Friday.
 The market’s PE ratio, the most popular measure used to determine the value of stocks ended at 18.6 on 2022-23 earnings and 12.6.
times those for 2023-24 at the close of trading. ICInsider.com PE ratio chart and the more detailed daily report charts provide investors with regularly updated information to help decision-making.
The PE ratio chart covers all ordinary shares on the Jamaica Stock Exchange. It shows companies grouped by industry, allowing for easy comparisons between the same sector companies and the overall market. The EPS & PE ratios are based on 2023 and 2024 actual or projected earnings, excluding major one off items.
Investors need pertinent information to successfully navigate numerous investment options in the local stock market. The ICInsider.com PE ratio chart and the more detailed daily report charts provide investors with regularly updated information to help decision-making.
Investors should use the chart to help make rational decisions when investing in stocks close to the average for the sector and not going too far from it unless there are compelling reasons to do so. This approach helps to remove emotions from investment decisions and place them on fundamentals while at the same time not being too far from the majority of investors. 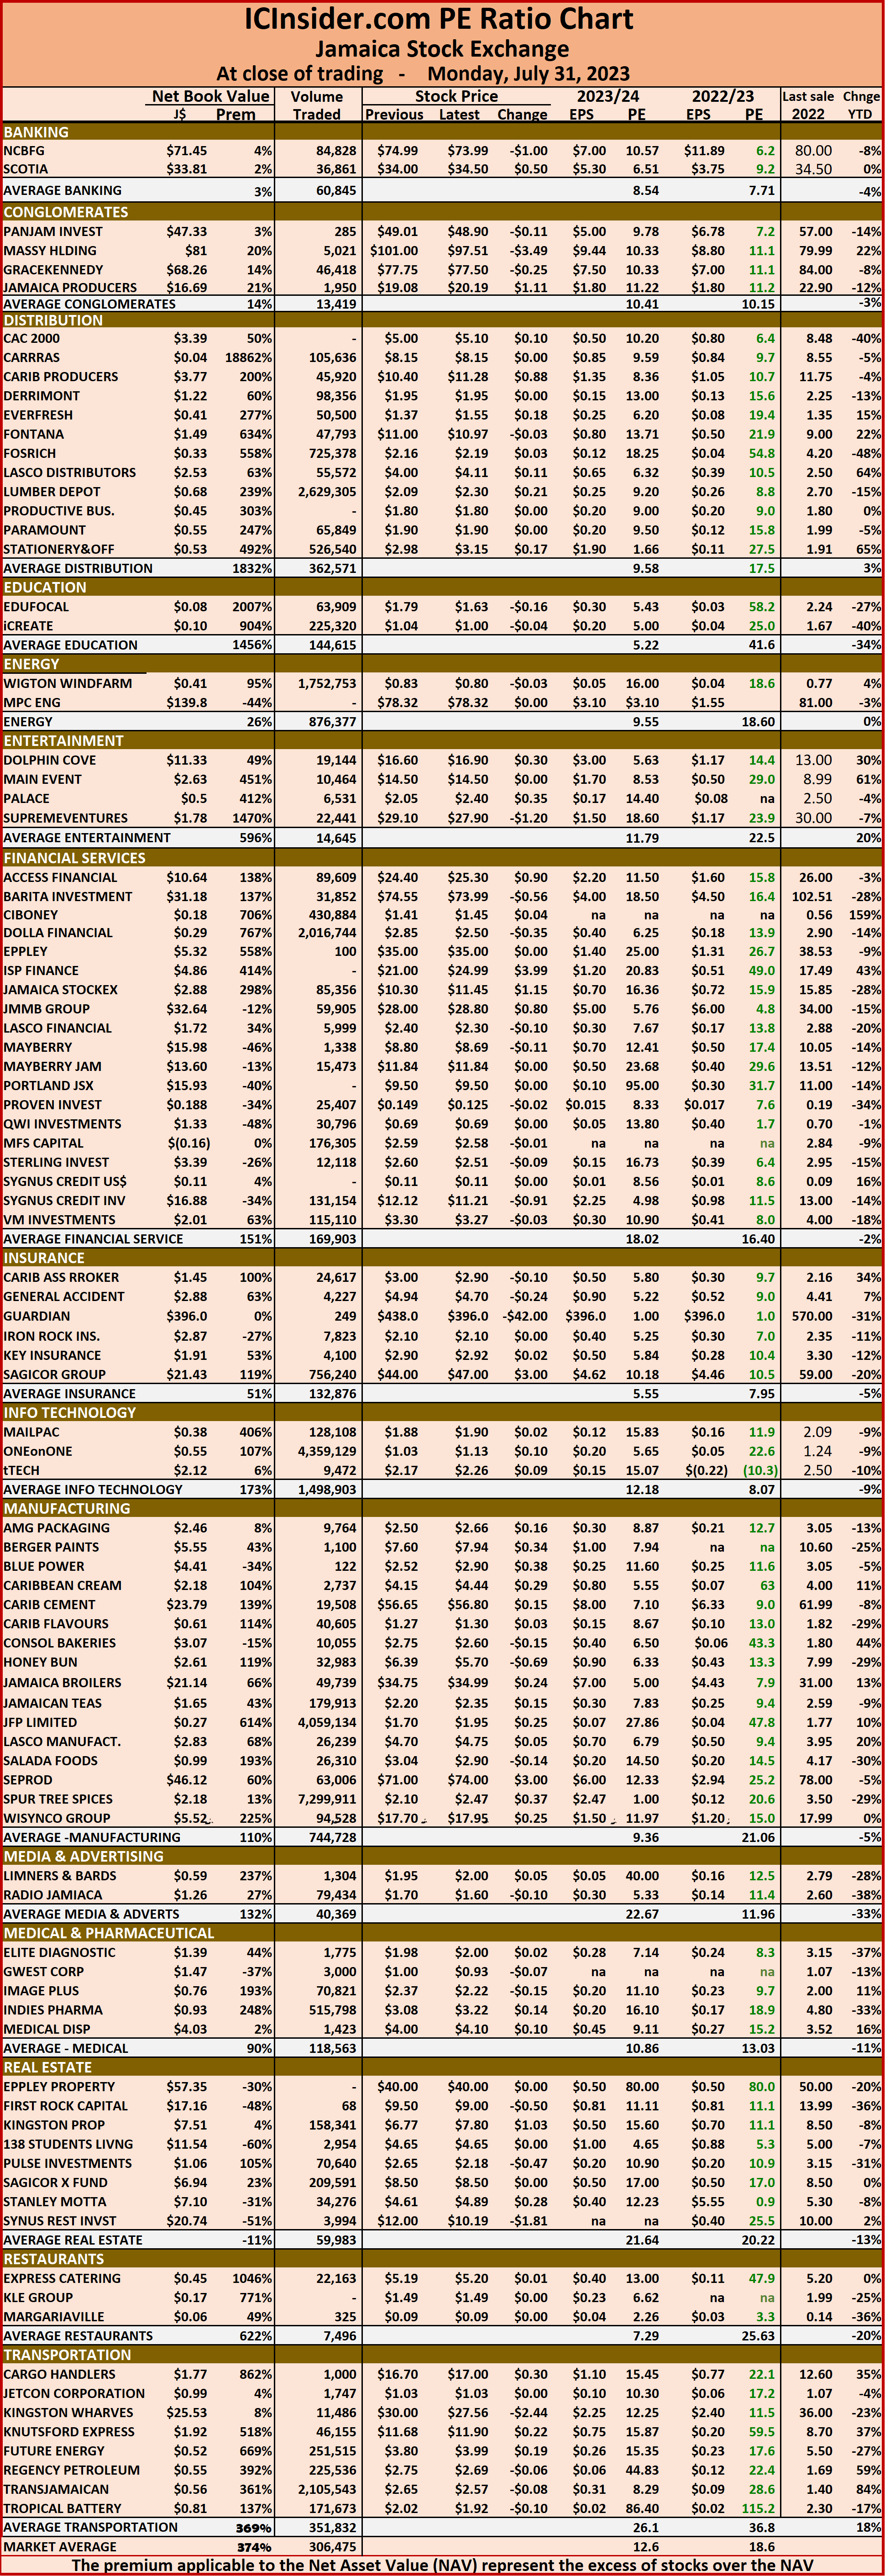 Investors who buy when the price of a stock is close to the average will find that they are not inclined to overpay for a stock.
The net asset value of each company is reported as a guide to assess the value of stocks based on this measure quickly. The chart also shows daily changes in stock prices and the percentage year to date price movement based on the last traded prices.
Dividends paid or payable and yields for each company are shown in the Main and Junior Markets’ daily report charts along with the closing volume pertaining to the highest bid and the lowest offer for each company.
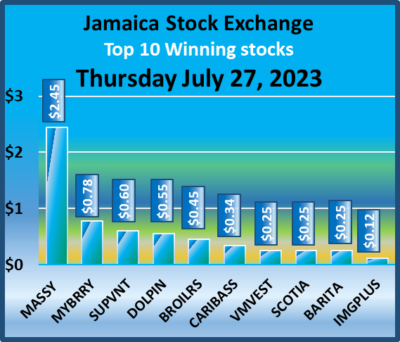
Rising stocks push JSE Markets higher
The JSE USD Market slipped at the close of trading on Thursday but the main and the Junior Market enjoyed a day of positive movement from the start of trading and never gave up the gains after investors pumped substantially more money into stocks by the close and ended with the volume and value of stocks traded, surging well over Wednesday’s levels.
 At the close, the JSE Combined Market Index rose 2,679.41 points to 342,890.87, the All Jamaican Composite Index popped 2,392.06 points to 365,690.74, the JSE Main Index surged 2,674.68 points to finish at 328,877.60, while the Junior Market Index climbed 20.08 points to 3,935.55 and the JSE USD Market Index fell 5.2 points to end at 245.27.
Trading of preference shares ending with notable price changes for Jamaica Public Service 9.5% increasing $97 to $2,900, while 138 Student Living preference share fell $9.24 in closing at $78, Productive Business 10.50% preference shares rallying $150 to end at $1,250, Productive Business Solutions 9.75% preference share gaining $1.50 to end at $101.50.
At the close, investors exchanged 49,783,784 shares in all three markets, up sharply from 18,797,388 stocks on 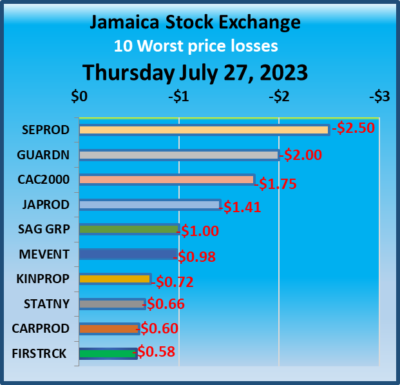 Wednesday. The value of stocks trading in the Junior and Main Markets jumped to $245.97 million from $119.29 million on Wednesday. Trading on the JSE USD market ended with investors exchanging 1,106,224 shares for US$42,488, down from 88,156 units at US$3,695 on Wednesday.
The market’s PE ratio, the most popular measure used to determine the value of stocks ended at 18.1 on 2022-23 earnings and 12.1 times those for 2023-24 at the close of trading. ICInsider.com PE ratio chart and the more detailed daily report charts provide investors with regularly updated information to help decision-making.
The PE ratio chart covers all ordinary shares on the Jamaica Stock Exchange. It shows companies grouped by industry, allowing for easy comparisons between the same sector companies and the overall market. The EPS & PE ratios are based on 2023 and 2024 actual or projected earnings, excluding major one off items.
Investors need pertinent information to successfully navigate numerous investment options in the local stock market. The ICInsider.com PE ratio chart and the more detailed daily report charts provide investors with regularly updated information to help decision-making.
Investors should use the chart to help make rational decisions when investing in stocks close to the average for the sector and not going too far from it unless there are compelling reasons to do so. This approach helps to remove emotions from investment decisions and place them on fundamentals while at the same time not being too far from the majority of investors. Investors who buy when the price of a stock is close to the average will find that they are not inclined to overpay for a stock.
 The net asset value of each company is reported as a guide to assess the value of stocks based on this measure quickly. The chart also shows daily changes in stock prices and the percentage year to date price movement based on the last traded prices.
Dividends paid or payable and yields for each company are shown in the Main and Junior Markets’ daily report charts along with the closing volume pertaining to the highest bid and the lowest offer for each company.
Mixed trading for Jamaica Stock Exchange
Junior and JSE USD Market stocks rose moderately but Main Market stocks push to the Jamaica Stock Exchange main indices down at the close on Wednesday after investors pumped far less money into stocks by the close of trading ended with the volume and value of stocks traded, declining from Tuesday’s levels.
 At the close, the JSE Combined Market Index fell 1,691.96 points to close at 340,211.46, the All Jamaican Composite Index dropped 2,254.10 points to 363,298.68, the JSE Main Index declined 1,843.86 points to end at 326,202.92, the Junior Market Index climbed 3.11 points to 3,915.47 and the JSE USD Market Index rose 2.49 points to end at 250.51.
Trading of Preference shares ended with the only notable price change being Jamaica Public Service 7% preference share which fell $9.18 to $52.02.
At the close, investors exchanged 18,797,388 shares, in all three markets, compared with 25,471,611 stocks on Tuesday. The value of stocks trading in the Junior and Main Markets was $119.29 million, down from $192.9 million on Tuesday. Trading on the JSE USD market ended with investors exchanging 88,156 shares for US$3,695, down from 329,260 units at US$12,513 on Tuesday.
 The market’s PE ratio, the most popular measure used to determine the value of stocks ended at 18.1 on 2022-23 earnings and 12.2 times those for 2023-24 at the close of trading. ICInsider.com PE ratio chart and the more detailed daily report charts provide investors with regularly updated information to help decision-making.
The PE ratio chart covers all ordinary shares on the Jamaica Stock Exchange. It shows companies grouped by industry, allowing for easy comparisons between the same sector companies and the overall market. The EPS & PE ratios are based on 2023 and 2024 actual or projected earnings, excluding major one off items.
Investors need pertinent information to successfully navigate numerous investment options in the local stock market. The ICInsider.com PE ratio chart and the more detailed daily report charts provide investors with regularly updated information to help decision-making.
Investors should use the chart to help make rational decisions when investing in stocks close to the average for the sector and not going too far from it unless there are compelling reasons to do so. This approach helps to remove emotions from investment decisions and place them on fundamentals while at the same time not being too far from the majority of investors. Investors who buy when the price of a stock is close to the average will find that they are not inclined to overpay for a stock.
 The net asset value of each company is reported as a guide to assess the value of stocks based on this measure quickly. The chart also shows daily changes in stock prices and the percentage year to date price movement based on the last traded prices.
Dividends paid or payable and yields for each company are shown in the Main and Junior Markets’ daily report charts along with the closing volume pertaining to the highest bid and the lowest offer for each company.
Main and Junior Markets fell and JSE USD rose
The Main Market of the Jamaica Stock Exchange dipped on Tuesday but the USD Market closed moderately higher at the end of trading with the volume and value of stocks traded increasing over Monday trades.
 At the close, the JSE Combined Market Index dropped 1,264.67 points to 341,903.42, the All Jamaican Composite Index rallied 114.21 points to 365,552.78, the JSE Main Index fell 1,300.23 points to 328,046.78, while the Junior Market Index slipped 5.61 points to 3,912.36 and the JSE USD Market Index added 3.25 points to settle at 248.02.
Trading of Preference shares with notable price changes are Productive Business 10.50% preference share shed $150 to end at $1,100, Jamaica Public Service 9.5% dropped $297 to close at $2,803, 138 Student Living preference share fell $15.39 to $87.24 and Transjamaican Highway 8% preference shares rallied 60 cents to $3.
At the close, investors exchanged 25,471,611 shares, in all three markets, compared with 20,410,245 stocks on Monday. The value of stocks trading in the Junior and Main Markets was $192.9 million, up from $143.54 million on Monday. Trading on the JSE USD market ended with investors exchanging 329,260 shares for US$12,513 up from 199,644 units at US$11,531 on Monday.
 The market’s PE ratio, the most popular measure used to determine the value of stocks ended at 18.2 on 2022-23 earnings and 12.2 times those for 2023-24 at the close of trading. ICInsider.com PE ratio chart and the more detailed daily report charts provide investors with regularly updated information to help decision-making.
The PE ratio chart covers all ordinary shares on the Jamaica Stock Exchange. It shows companies grouped by industry, allowing for easy comparisons between the same sector companies and the overall market. The EPS & PE ratios are based on 2023 and 2024 actual or projected earnings, excluding major one off items.
Investors need pertinent information to successfully navigate numerous investment options in the local stock market. The ICInsider.com PE ratio chart and the more detailed daily report charts provide investors with regularly updated information to help decision-making.
Investors should use the chart to help make rational decisions when investing in stocks close to the average for the sector and not going too far from it unless there are compelling reasons to do so. This approach helps to remove emotions from investment decisions and place them on fundamentals while at the same time not being too far from the majority of investors. Investors who buy when the price of a stock is close to the average will find that they are not inclined to overpay for a stock.
 The net asset value of each company is reported as a guide to assess the value of stocks based on this measure quickly. The chart also shows daily changes in stock prices and the percentage year to date price movement based on the last traded prices.
Dividends paid or payable and yields for each company are shown in the Main and Junior Markets’ daily report charts along with the closing volume pertaining to the highest bid and the lowest offer for each company.
Main & JSE USD Markets rally Juniors fall
The Main Market of the Jamaica Stock Exchange jumped sharply on Monday and the USD Market closed moderately higher at the end of trading but the Junior Market could not hold on to early morning gains and slipped lower to close out the day, following a decline in the volume of stocks traded at an increased value compared to Friday.
 The JSE Combined Market Index climbed 1,279.08 points in ending at 343,168.10, while the All Jamaican Composite Index jumped 2,921.07 points to 365,438.57, the JSE Main Index popped 1,479.39 points to 329,347.0, the Junior Market Index slipped 11.07 points to end at 3,917.98 and the JSE USD Market Index added 5.89 points to settle at 244.77.
Preference shares with notable price movements are Productive 10.50% preference share that jumped $272.50 to $1250, Jamaica Public Service 7% dropping $8.80 to close at $61.20, Productive Business Solutions 9.75% preference share shedding $2 and to end at $100 and Transjamaican Highway 8% fell that fell 65 cents to $2.40.
At the close, investors exchanged 20,410,245 shares, in all three markets, compared with 26,925,878 stocks on Friday. The value of stocks trading in the Junior and Main Markets was $143.54 million, up from $133.9 million on Friday. Trading on the JSE USD market ended with investors exchanging 199,644 shares for US$11,531 from 584,142 units at US$30,721 on Friday.
The market’s PE ratio, the most popular measure used to determine the value of stocks ended at 18.1 on 2022-23 earnings and 12.2 times those for 2023-24 at the close of trading. ICInsider.com PE ratio chart and the more detailed daily report charts provide investors with regularly updated information to help decision-making.
The PE ratio chart covers all ordinary shares on the Jamaica Stock Exchange. It shows companies grouped by industry, allowing for easy comparisons between the same sector companies and the overall market. The EPS & PE ratios are based on 2023 and 2024 actual or projected earnings, excluding major one off items.
Investors need pertinent information to successfully navigate numerous investment options in the local stock market. The ICInsider.com PE ratio chart and the more detailed daily report charts provide investors with regularly updated information to help decision-making.
Investors should use the chart to help make rational decisions when investing in stocks close to the average for the sector and not going too far from it unless there are compelling reasons to do so. This approach helps to remove emotions from investment decisions and place them on fundamentals while at the same time not being too far from the majority of investors. Investors who buy when the price of a stock is close to the average will find that they are not inclined to overpay for a stock.
 The net asset value of each company is reported as a guide to assess the value of stocks based on this measure quickly. The chart also shows daily changes in stock prices and the percentage year to date price movement based on the last traded prices.
Dividends paid or payable and yields for each company are shown in the Main and Junior Markets’ daily report charts along with the closing volume pertaining to the highest bid and the lowest offer for each company.
Main Market rallies others fall
The Main Market of the Jamaica Stock Exchange rose moderately on Friday, but the Junior Market and the USD Market slipped lower following a rise in the volume of stocks traded but with a lower value than Thursday as the markets continue to consolidate.
 At the close, the JSE Combined Market Index climbed 535.15 points to 341,889.02, the All Jamaican Composite Index rose 91.12 points to 362,517.50, the JSE Main Index rose 906.61 points to 327,867.62 while the Junior Market Index lost 33.95 points to end at 3,929.05 and the JSE USD Market Index fell 4.07 points to settle at 238.88.
Trading of Preference shares with notable price movements are Eppley 7.50% preference share rallied 91 cents in closing at $6.12, Jamaica Public Service 7% dipped $1 to $70 and 138 Student Living preference share jumped $13.39 to close at $102.63.
At the close, investors exchanged 26,925,878 shares, in all three markets, compared with 18,916,750 stocks on Thursday. The value of stocks trading in the Junior and Main markets was $133.9 million, down from $217 million on Thursday. Trading on the JSE USD market ended with investors exchanging 584,142 shares for US$30,721 from 477,710 units at US$21,075 on Thursday.
 The market’s PE ratio, the most popular measure used to determine the value of stocks ended at 18.1 on 2022-23 earnings and 12.2 times those for 2023-24 at the close of trading. ICInsider.com PE ratio chart and the more detailed daily report charts provide investors with regularly updated information to help decision-making.
The PE ratio chart covers all ordinary shares on the Jamaica Stock Exchange. It shows companies grouped by industry, allowing for easy comparisons between the same sector companies and the overall market. The EPS & PE ratios are based on 2023 and 2024 actual or projected earnings, excluding major one off items.
Investors need pertinent information to successfully navigate numerous investment options in the local stock market. The ICInsider.com PE ratio chart and the more detailed daily report charts provide investors with regularly updated information to help decision-making.
Investors should use the chart to help make rational decisions when investing in stocks close to the average for the sector and not going too far from it unless there are compelling reasons to do so. This approach helps to remove emotions from investment decisions and place them on fundamentals while at the same time not being too far from the majority of investors. Investors who buy when the price of a stock is close to the average will find that they are not inclined to overpay for a stock.
 The net asset value of each company is reported as a guide to assess the value of stocks based on this measure quickly. The chart also shows daily changes in stock prices and the percentage year to date price movement based on the last traded prices.
Dividends paid or payable and yields for each company are shown in the Main and Junior Markets’ daily report charts along with the closing volume pertaining to the highest bid and the lowest offer for each company.


