The JSE Main Market index and the US dollar market index rose on Wednesday after the Jamaica Stock Exchange was closed for the long Christmas holidays, but the Junior Market slipped moderately to start off the last week of the year.
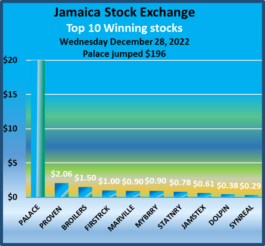 Trading ended with an exchange of 32,490,607 shares from 57,304,112 units last Friday, with a value of $98 million versus $258.7 million on the previous day. The JSE USD market ended with stocks traded with a value of US$14,629 versus US$699 last Friday.
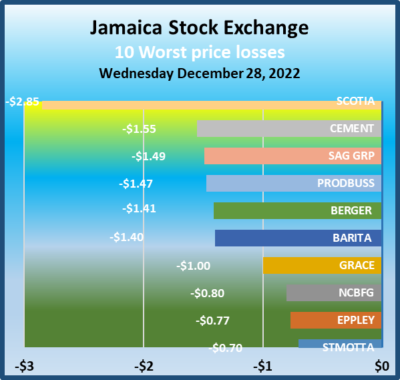
The Combined Market Index fell 89.14 points to 357,586.69, the All Jamaican Composite Index dipped 178.44 points to 384,289.39, the JSE Main Index rose 169.81 points to 345,133.04, the Junior Market slipped 26.97 points to 3,881.38 and the JSE US dollar market rose 5.46 points to 258.04.
The market’s PE ratio ended at 25 based on 2021-22 earnings and 15 times those for 2022-23 at the close of trading.
Investors need pertinent information to successfully navigate many investment options in the local stock market. The ICInsider.com PE ratio chart and the more detailed daily report charts provide investors with regularly updated information to help decision-making.
 Investors should use the chart to help make rational investment decisions by investing in stocks close to the average for the sector and not going too far from it unless there are compelling reasons to do so. This approach helps to remove emotions from investment decisions and put in on fundamentals while at the same time not being too far from the majority of investors. Investors who buy when the price of a stock is close to the average will find that they are not inclined to overpay for a stock.
The ICInsider.com PE Ratio chart covers all ordinary shares on the Jamaica Stock Exchange. It shows companies grouped on an industry basis, allowing easy comparisons between the same sector companies and the overall market.
The net asset value of each company is reported as a guide to assess the value of stocks based on this measure quickly. The chart also shows daily changes in stock prices and the percentage year to date price movement based on the last traded prices. 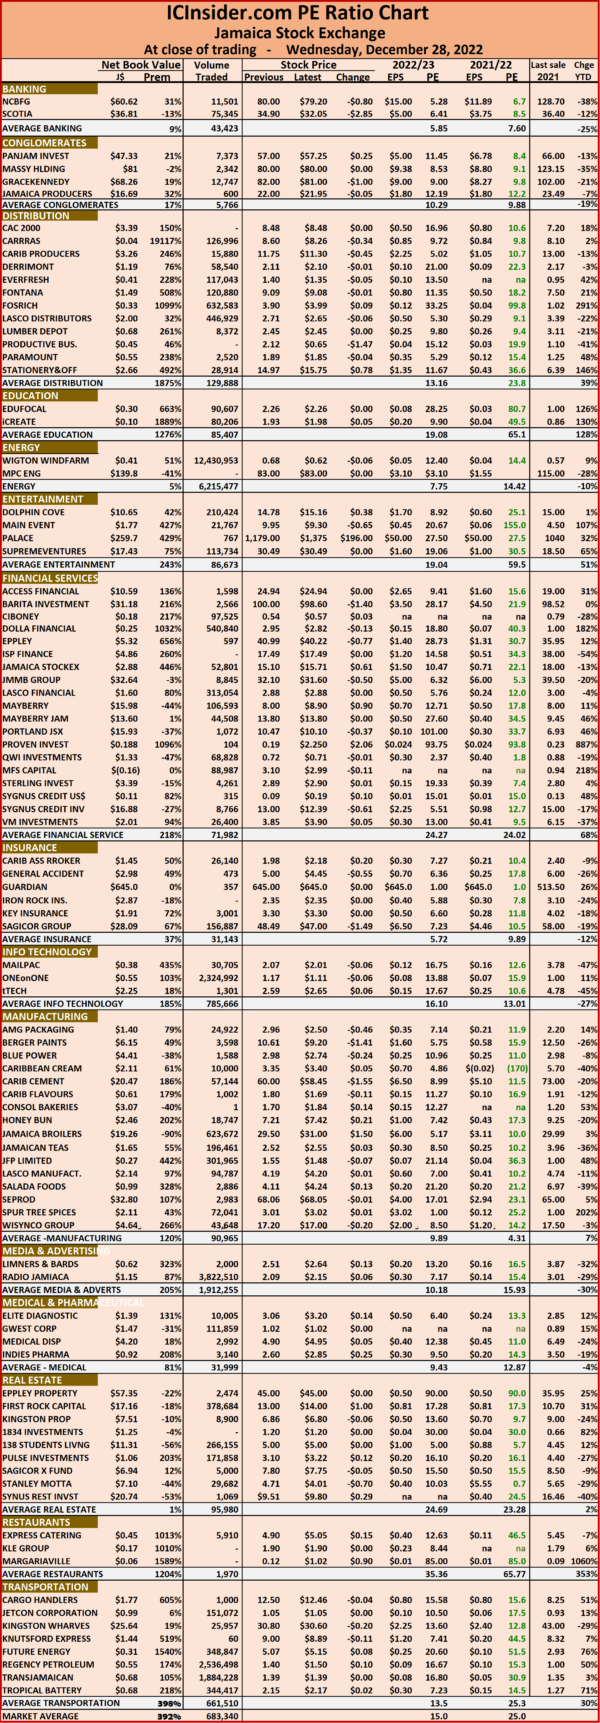 Dividends payable and yields for each company are shown in the Main and Junior Markets’ daily report charts that show the closing volume for the bids and offers.
The EPS & PE ratios are based on 2021 and 2022 actual or projected earnings, excluding major one off items. The PE Ratio is the most popular measure used to determine the value of stocks.
Jamaica Stock Exchange nearly stable,
JSE Main Market bounce, Juniors fall
The JSE Main Market and the US dollar market bounced on Friday ahead of the Christmas holidays and before the market reopens next week Wednesday, but the Junior Market slipped moderately to close off the week slightly higher than the previous week, as the volume of stocks trading in the Junior Market surged well above the 7.3 million shares that were traded on Thursday, with just over 36 million units changing hands on Friday.
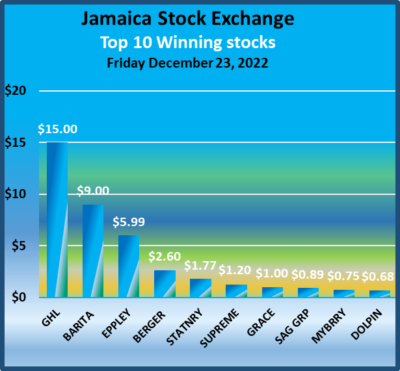 Trading ended with an exchange of 57,304,112 shares compared with 14,915,848 units on Thursday, with the value dropping to $258.7 million from $134.4 million on the previous day.
The JSE USD market ended with the value of stocks traded amounting to just US$699, down from US$24,703 on Friday.
At the close, the Combined Market Index climbed 2,679.19 points to close at 357,675.83, the All Jamaican Composite Index surged 3,483.04 points to 384,467.83, the JSE Main Index jumped 2,968.48 points to end at 344,963.23, the Junior Market slipped 9.80 points to settle at 3,908.35 and the JSE US dollar market rose 2.02 points to 252.58.
The market’s PE ratio ended at 22.5 based on 2021-22 earnings and 12.8 times those for 2022-23 at the close of trading.
Investors need pertinent information to successfully navigate many investment options in the local stock market. The ICInsider.com PE ratio chart and the more detailed daily report charts provide investors with regularly updated information to help decision-maki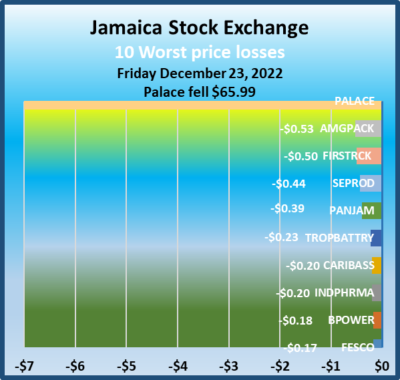 ng.
Investors should use the chart to help make rational investment decisions by investing in stocks close to the average for the sector and not going too far from it unless there are compelling reasons to do so. This approach helps to remove emotions from investment decisions and put in on fundamentals while at the same time not being too far from the majority of investors. Investors who buy when the price of a stock is close to the average will find that they are not inclined to overpay for a stock.
The ICInsider.com PE Ratio chart covers all ordinary shares on the Jamaica Stock Exchange. It shows companies grouped on an industry basis, allowing easy comparisons between the same sector companies and the overall market.
The net asset value of each company is reported as a guide to assess the value of stocks based on this measure quickly. 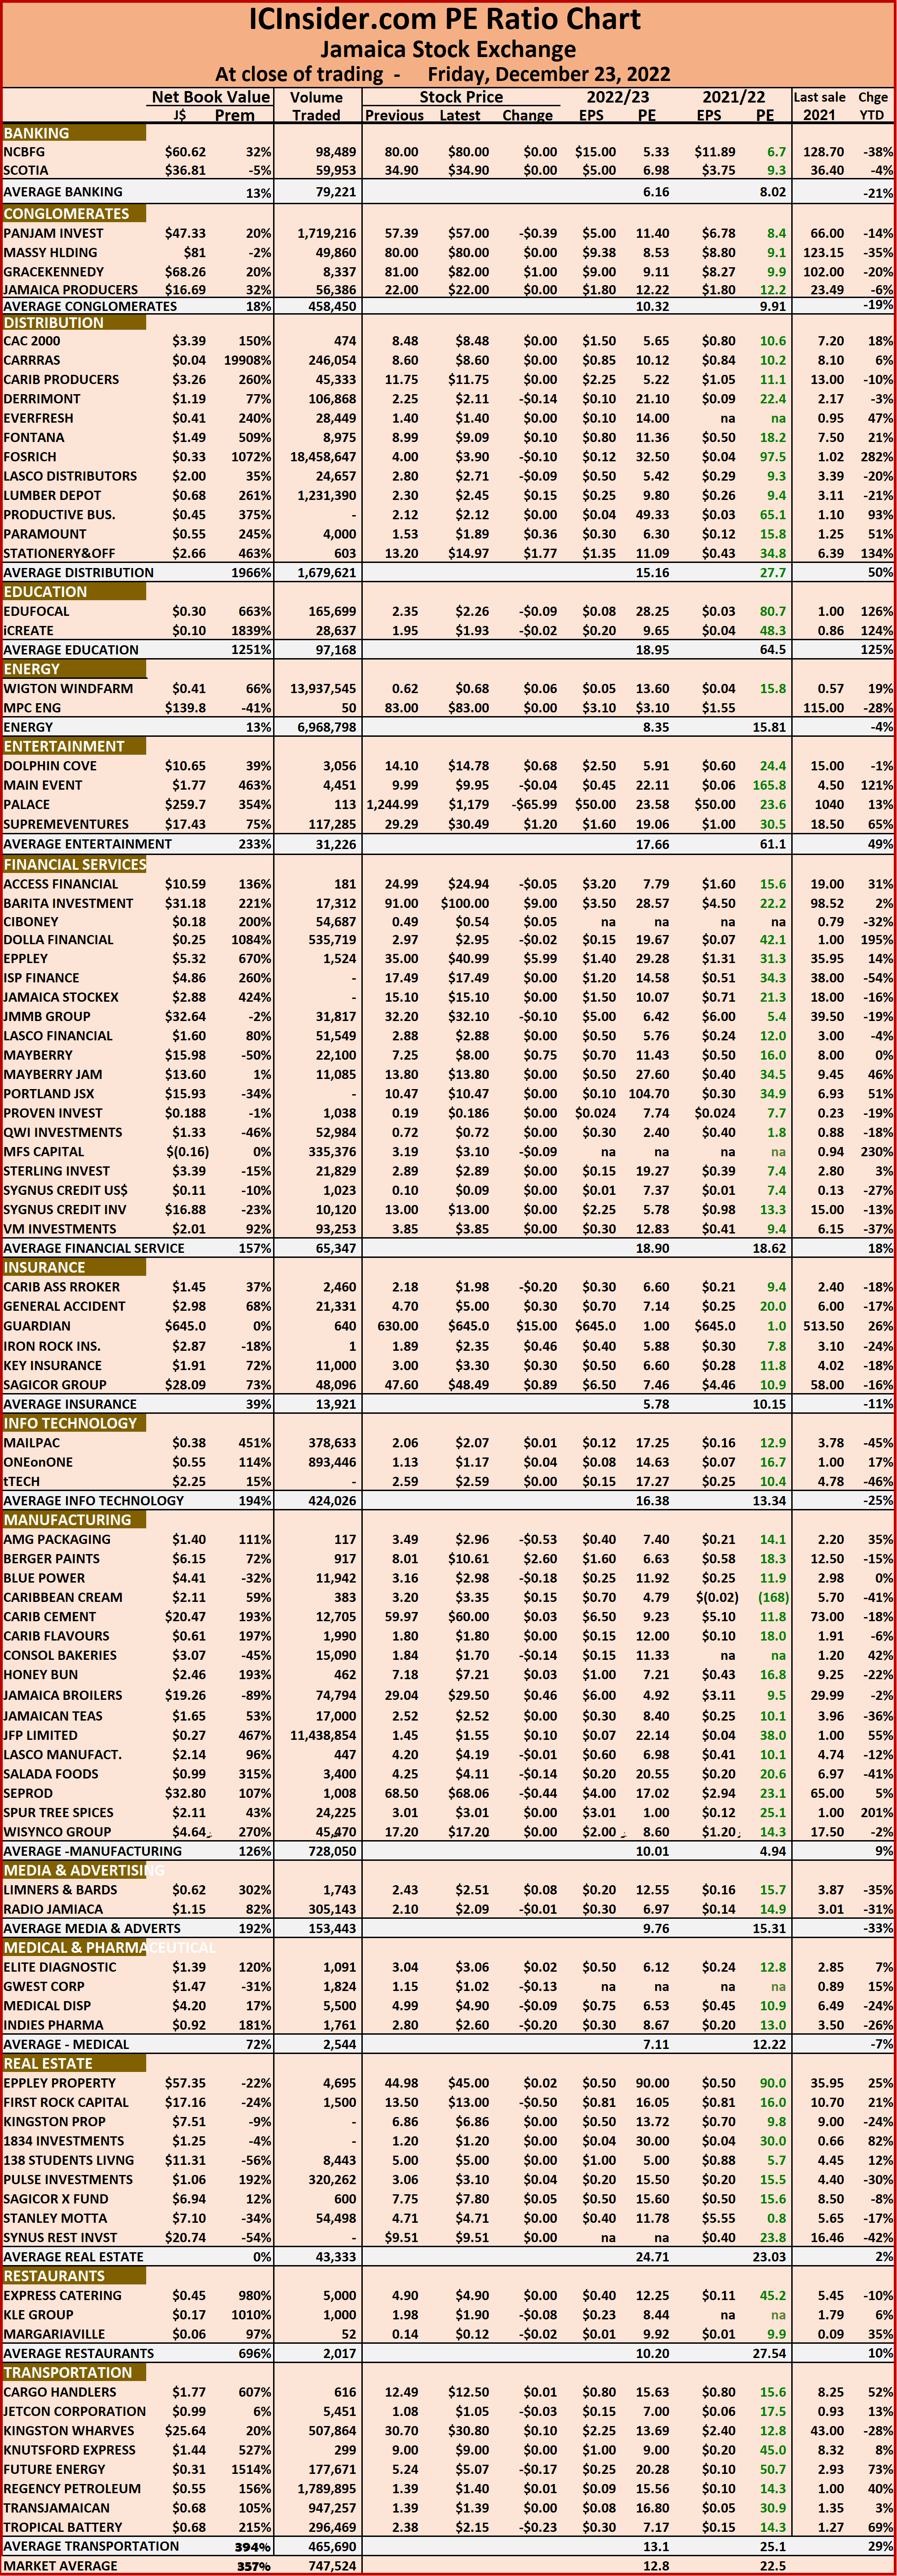 The chart also shows daily changes in stock prices and the percentage year to date price movement based on the last traded prices. Dividends payable and yields for each company are shown in the Main and Junior Markets’ daily report charts that show the closing volume for the bids and offers.
The EPS & PE ratios are based on 2021 and 2022 actual or projected earnings, excluding major one off items. The PE Ratio is the most popular measure used to determine the value of stocks.
JSE markets rise as Jamaica stocks lost value
The JSE US dollar market jumped sharply for a second day on Thursday following Wednesday’s big jump and the Junior Market rallied further following Wednesday’s big recovery but Main Market closed higher in the fading seconds of trading after it was in decline for most of the day’s session, Jamaica stocks suffered losses as shown by a declining index.
 Trading ended with an exchange of 14,915,848 shares up from 125,922,690 units on Wednesday, with the value dropping to $134.4 million from $948.7 million on the previous day. The JSE USD market ended with the value of stocks traded amounting to US$24,703 up from US$12,842 on Thursday.
At the close, the Combined Market Index climbed 1,721.80 points to 354,996.64, the All Jamaican Composite Index fell 1,195.13 points to 380,984.79, the JSE Main Index rose 1,526.78 points to 341,994.74, the Junior Market Index rallied 32.42 points to settle at 3,918.16 and the JSE US dollar market popped 6.41 points to 250.56.
The market’s PE ratio ended at 22.5 based on 2021-22 earnings and 12.8 times those for 2022-23 at the close of trading.
 Investors need pertinent information to successfully navigate many investment options in the local stock market. The ICInsider.com PE ratio chart and the more detailed daily report charts provide investors with regularly updated information to help decision-making.
Investors should use the chart to help make rational investment decisions by investing in stocks close to the average for the sector and not going too far from it unless there are compelling reasons to do so. This approach helps to remove emotions from investment decisions and put in on fundamentals while at the same time not being too far from the majority of investors. Investors who buy when the price of a stock is close to the average will find that they are not inclined to overpay for a stock.
The ICInsider.com PE Ratio chart covers all ordinary shares on the Jamaica Stock Exchange. It shows companies grouped on an industry basis, allowing easy comparisons between the same sector companies and the overall market.
The net asset value of each company is reported as a guide to assess the value of stocks based on this measure quickly. The chart also shows daily changes in stock prices and the percentage year to date price movement based on the last traded prices. Dividends payable and yields for each company are shown in the Main and Junior Markets’ daily report charts that show the closing volume for the bids and offers.
The EPS & PE ratios are based on 2021 and 2022 actual or projected earnings, excluding major one off items. The PE Ratio is the most popular measure used to determine the value of stocks.
Sharp jump in Jamaica Stock Exchange trading
Trading jumped sharply on Wednesday as 125,922,690 shares were traded up from 32,540,890 units on Tuesday with the value surging to $948.7 million versus $169.1 million while the JSE USD market ended with the value of stocks traded amounting to US$12,842 down from US$17,244 on Tuesday.
 At the close, the Combined Market Index climbed 695.36 points to 353,274.84, the All Jamaican Composite Index jumped 2,594.86 points to settle at 382,179.92, the JSE Main Index advanced a mere 86.10 points to 340,467.96, the Junior Market rallied 67.01 points to 3,885.74 and the JSE US dollar market popped 8.46 points to 244.15.
The market’s PE ratio ended at 22.2 based on 2021-22 earnings and 12.7 times those for 2022-23 at the close of trading.
Investors need pertinent information to successfully navigate many investment options in the local stock market. The ICInsider.com PE ratio chart and the more detailed daily report charts provide investors with regularly updated information to help decision-making.
 Investors should use the chart to help make rational investment decisions by investing in stocks close to the average for the sector and not going too far from it unless there are compelling reasons to do so. This approach helps to remove emotions from investment decisions and put in on fundamentals while at the same time not being too far from the majority of investors. Investors who buy when the price of a stock is close to the average will find that they are not inclined to overpay for a stock.
The ICInsider.com PE Ratio chart covers all ordinary shares on the Jamaica Stock Exchange. It shows companies grouped on an industry basis, allowing easy comparisons between the same sector companies and the overall market.
The net asset value of each company is reported as a guide to assess the value of stocks based on this measure quickly. The chart also shows daily changes in stock prices and the percentage year to date price movement based on the last traded prices. Dividends payable and yields for each company are shown in the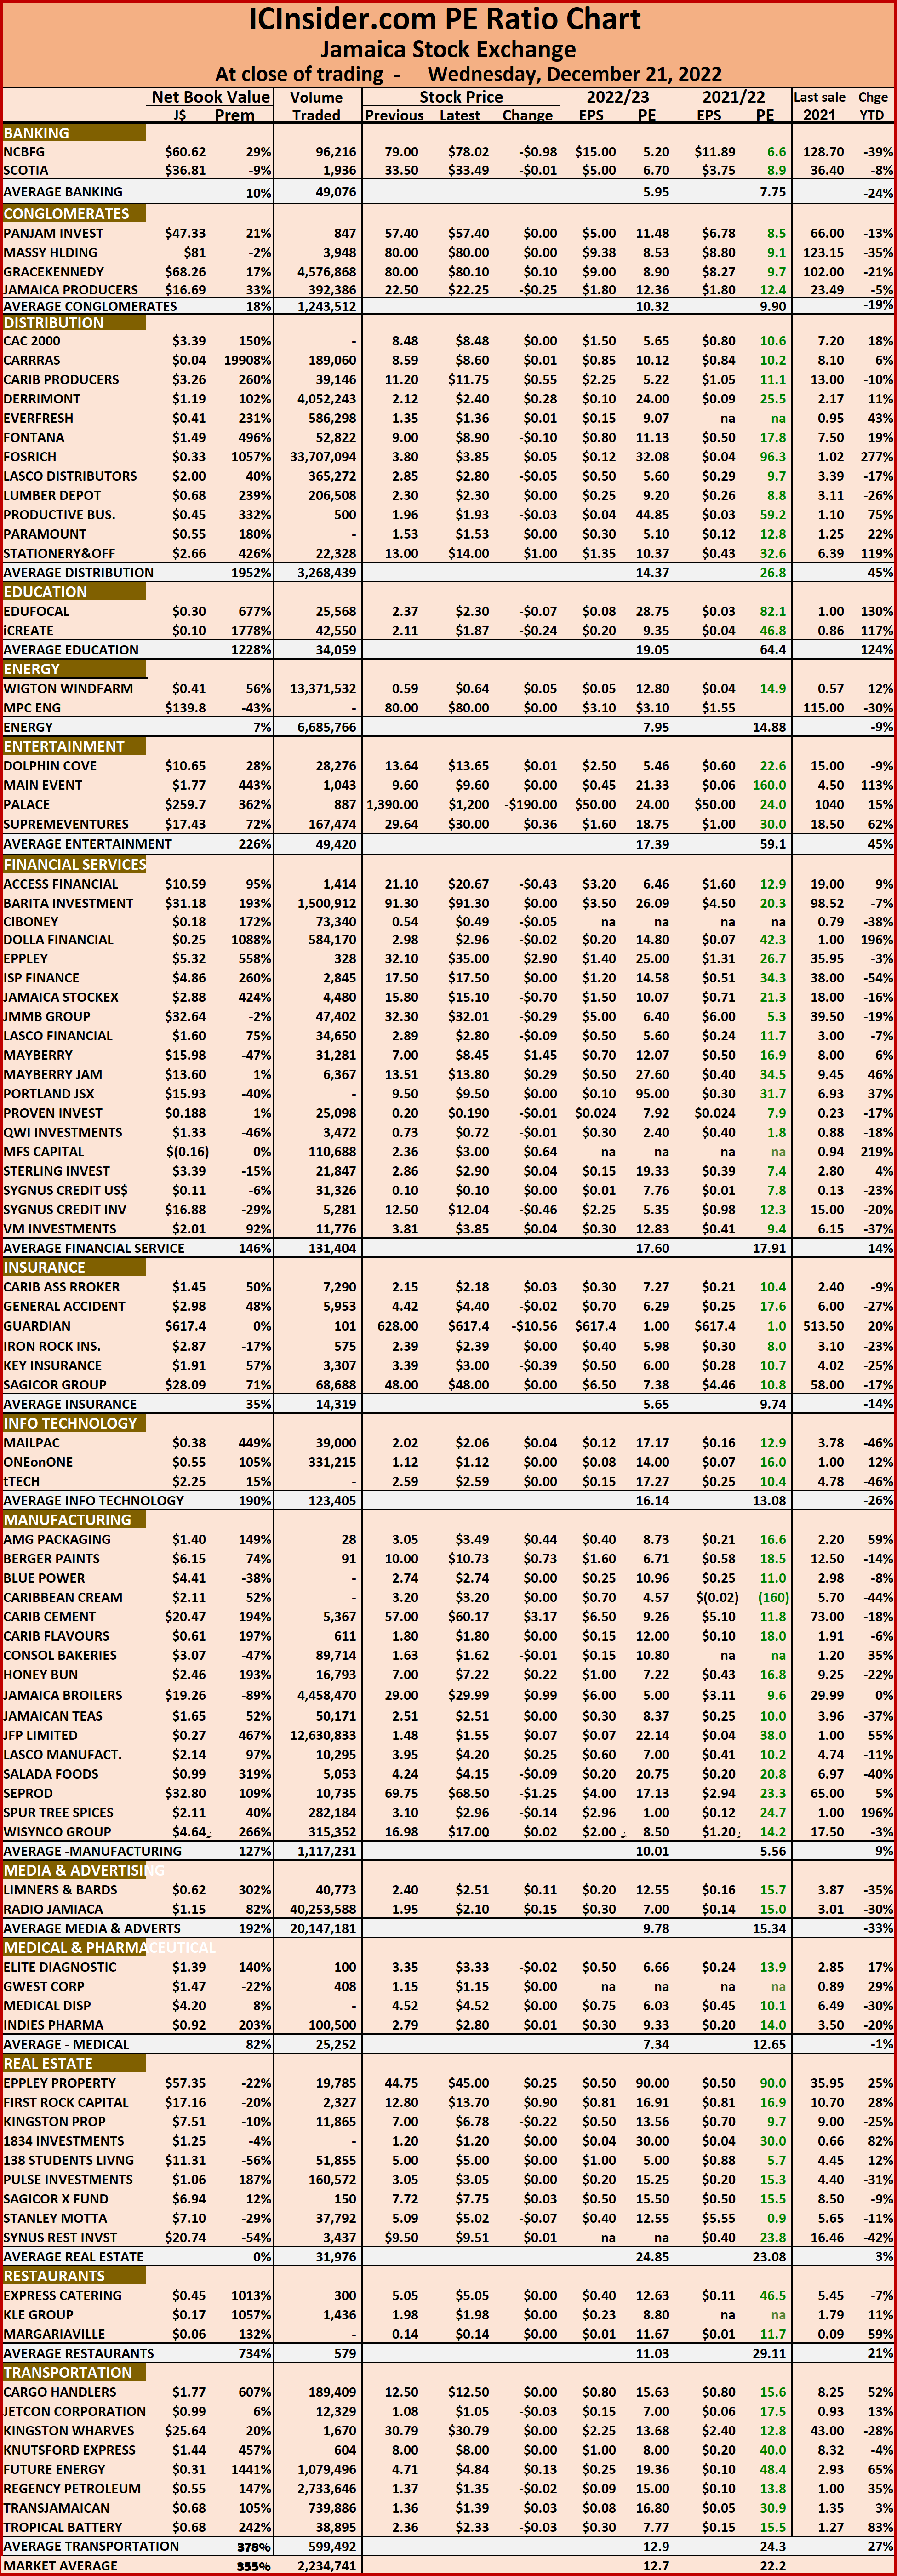 Main and Junior Markets’ daily report charts that show the closing volume for the bids and offers.
The EPS & PE ratios are based on 2021 and 2022 actual or projected earnings, excluding major one off items. The PE Ratio is the most popular measure used to determine the value of stocks.
JSE Main Market gained Juniors fell
Funds passing applied in trading stock jumped on Tuesday compared to Monday resulting in modestly fewer shares changing hands at the close but had mixed results on the various markets as the Junior Market declined for a second day but the Main market enjoyed a bounce to close out the day, while the JSE USD climbed decisively.
 At the close, the Combined Market Index climbed 1,257.94 points to 352,579.48, the All Jamaican Composite Index gained 27.39 points to close at 379,585.06, the JSE Main Index rallied 1,715.42 points to 340,381.86, the Junior Market shed 37.30 points to 3,818.73 and the JSE USdollar market popped 4.71 points to 235.69.
Trading ended with 32,540,890 shares changing hands, for $169.1 million versus $119.8 million, with 34,621,684 shares traded in all markets on the previous trading day. The JSE USD market ended with the value of stocks traded amounting to US$17,244 from US$7,737 on Monday.
The market’s PE ratio ended at 22.4 based on 2021-22 earnings and 12.7 times those for 2022-23 at the close of trading.
Investors need pertinent information to successfully navigate many investment options in the local stock market. The ICInsider.com PE ratio chart and the more detailed daily report charts provide investors with regularly updated information to help decision-making.
 Investors should use the chart to help make rational investment decisions by investing in stocks close to the average for the sector and not going too far from it unless there are compelling reasons to do so. This approach helps to remove emotions from investment decisions and put in on fundamentals while at the same time not being too far from the majority of investors. Investors who buy when the price of a stock is close to the average will find that they are not inclined to overpay for a stock.
The ICInsider.com PE Ratio chart covers all ordinary shares on the Jamaica Stock Exchange. It shows companies grouped on an industry basis, allowing easy comparisons between the same sector companies and the overall market.
The net asset value of each company is reported as a guide to assess the value of stocks based on this measure quickly. The chart also shows daily changes in stock prices and the percentage year to date price movement based on the last traded prices.  Dividends payable and yields for each company are shown in the Main and Junior Markets’ daily report charts that show the closing volume for the bids and offers.
The EPS & PE ratios are based on 2021 and 2022 actual or projected earnings, excluding major one off items. The PE Ratio is the most popular measure used to determine the value of stocks.
Regency tops out with lost altitude
The shares of Regency Petroleum that were listed on the Junior Market on Thursday and jumped 75 percent to $1.75 on Friday, topped on Monday in heavy volume and closed down at $1.41, after accounting for 54 percent of stocks traded in a market that saw slippage in prices that weight down all market indices.
 At the close of the market, the volume and the value of stocks traded just slipped below that on Friday.
At the close, the Combined Market Index dropped 744.44 points to 351,765.66, the All Jamaican Composite Index dropped 725.84 points to 379,557.67, the JSE Main Index dipped 107.55 points to 338,666.44, the Junior Market fell 37.46 points to 3,856.03 and the JSE US dollar market dipped 0.41 points to 230.98.
Trading ended, with 34,621,684 shares changing hands, for $119.8 million versus $120 million, with 35,469,567 shares traded in all markets on the previous trading day. The JSE USD market ended with the value of stocks traded amounting to US$7,737 from US$5,115 on Friday.
The market’s PE ratio ended at 22.2 based on 2021-22 earnings and 12.7 times those for 2022-23 at the close of trading.
 Investors need pertinent information to successfully navigate many investment options in the local stock market. The ICInsider.com PE ratio chart and the more detailed daily report charts provide investors with regularly updated information to help decision-making.
Investors should use the chart to help make rational investment decisions by investing in stocks close to the average for the sector and not going too far from it unless there are compelling reasons to do so. This approach helps to remove emotions from investment decisions and put in on fundamentals while at the same time not being too far from the majority of investors. Investors who buy when the price of a stock is close to the average will find that they are not inclined to overpay for a stock.
The ICInsider.com PE Ratio chart covers all ordinary shares on the Jamaica Stock Exchange. It shows companies grouped on an industry basis, allowing easy comparisons between the same sector companies and the overall market.
The net asset value of each company is reported as a guide to assess the value of stocks based on this measure quickly. The chart also shows daily changes in stock prices and the percentage year to date price movement based on the last traded prices.  Dividends payable and yields for each company are shown in the Main and Junior Markets’ daily report charts that show the closing volume for the bids and offers.
The EPS & PE ratios are based on 2021 and 2022 actual or projected earnings, excluding major one off items. The PE Ratio is the most popular measure used to determine the value of stocks.
Palace jumps to $1380, Regency at $1.75
As the 48th listing is heading for the Junior Market of the Jamaica Stock Exchange to fill the pockets of young investors, Regency Petroleum that was listed on the Junior Market on Thursday jumped 75 percent to $1.75 on Friday and seems poised to move higher when trading opens next week. 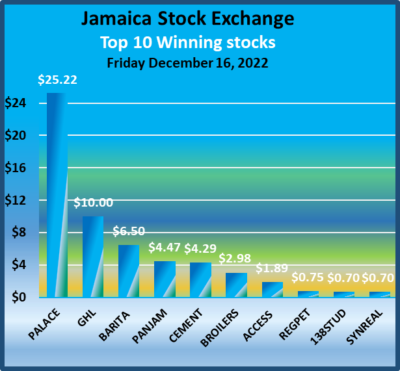 At the same time, the Palace Amusement stock has come to life with the prospects of a stock split and hit a new 52 weeks’ intraday high of $1,699 but closed at $1,380 as the Main Market slipped from Thursday’s close and the Junior Market closed higher.
At the close of the market, the volume and the value of stocks traded rose well above that on Thursday.
At the close, the Combined Market Index dropped 744.44 points to 351,765.66, the JSE Main Index fell 1,031.70 points to 338,773.99, while the All Jamaica Composite Index lost 1,890.91 points to settle at 380,283.51, the Junior Market climbed 23.76 points to settle at 3,893.49 and the JSE US dollar market jumped 2.56 points to 231.39.
Trading ended, with 35,469,567 shares changing hands, for $120 million, versus $68.76 million, with 11,071,300 shares traded in all markets on the previous trading day. 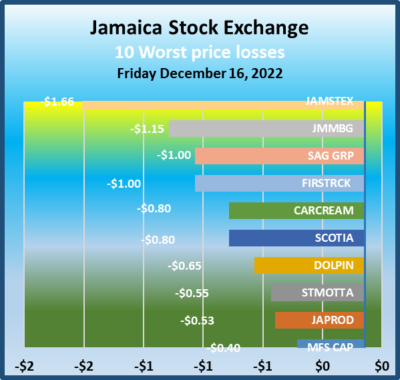 The JSE USD market ended with the value of stocks traded amounting to US$5,115 from US$5,493 on Thursday.
The market’s PE ratio ended at 23 based on 2021-22 earnings and 13 times those for 2022-23 at the close of trading.
Investors need pertinent information to successfully navigate many investment options in the local stock market. The ICInsider.com PE ratio chart and the more detailed daily report charts provide investors with regularly updated information to help decision-making.
Investors should use the chart to help make rational investment decisions by investing in stocks close to the average for the sector and not going too far from it unless there are compelling reasons to do so. This approach helps to remove emotions from investment decisions and put in on fundamentals while at the same time not being too far from the majority of investors. Investors who buy when the price of a stock is close to the average will find that they are not inclined to overpay for a stock.
The ICInsider.com PE Ratio chart covers all ordinary shares on the Jamaica Stock Exchange. It shows companies grouped on an industry basis, allowing easy comparisons between the same sector companies and the overall market.
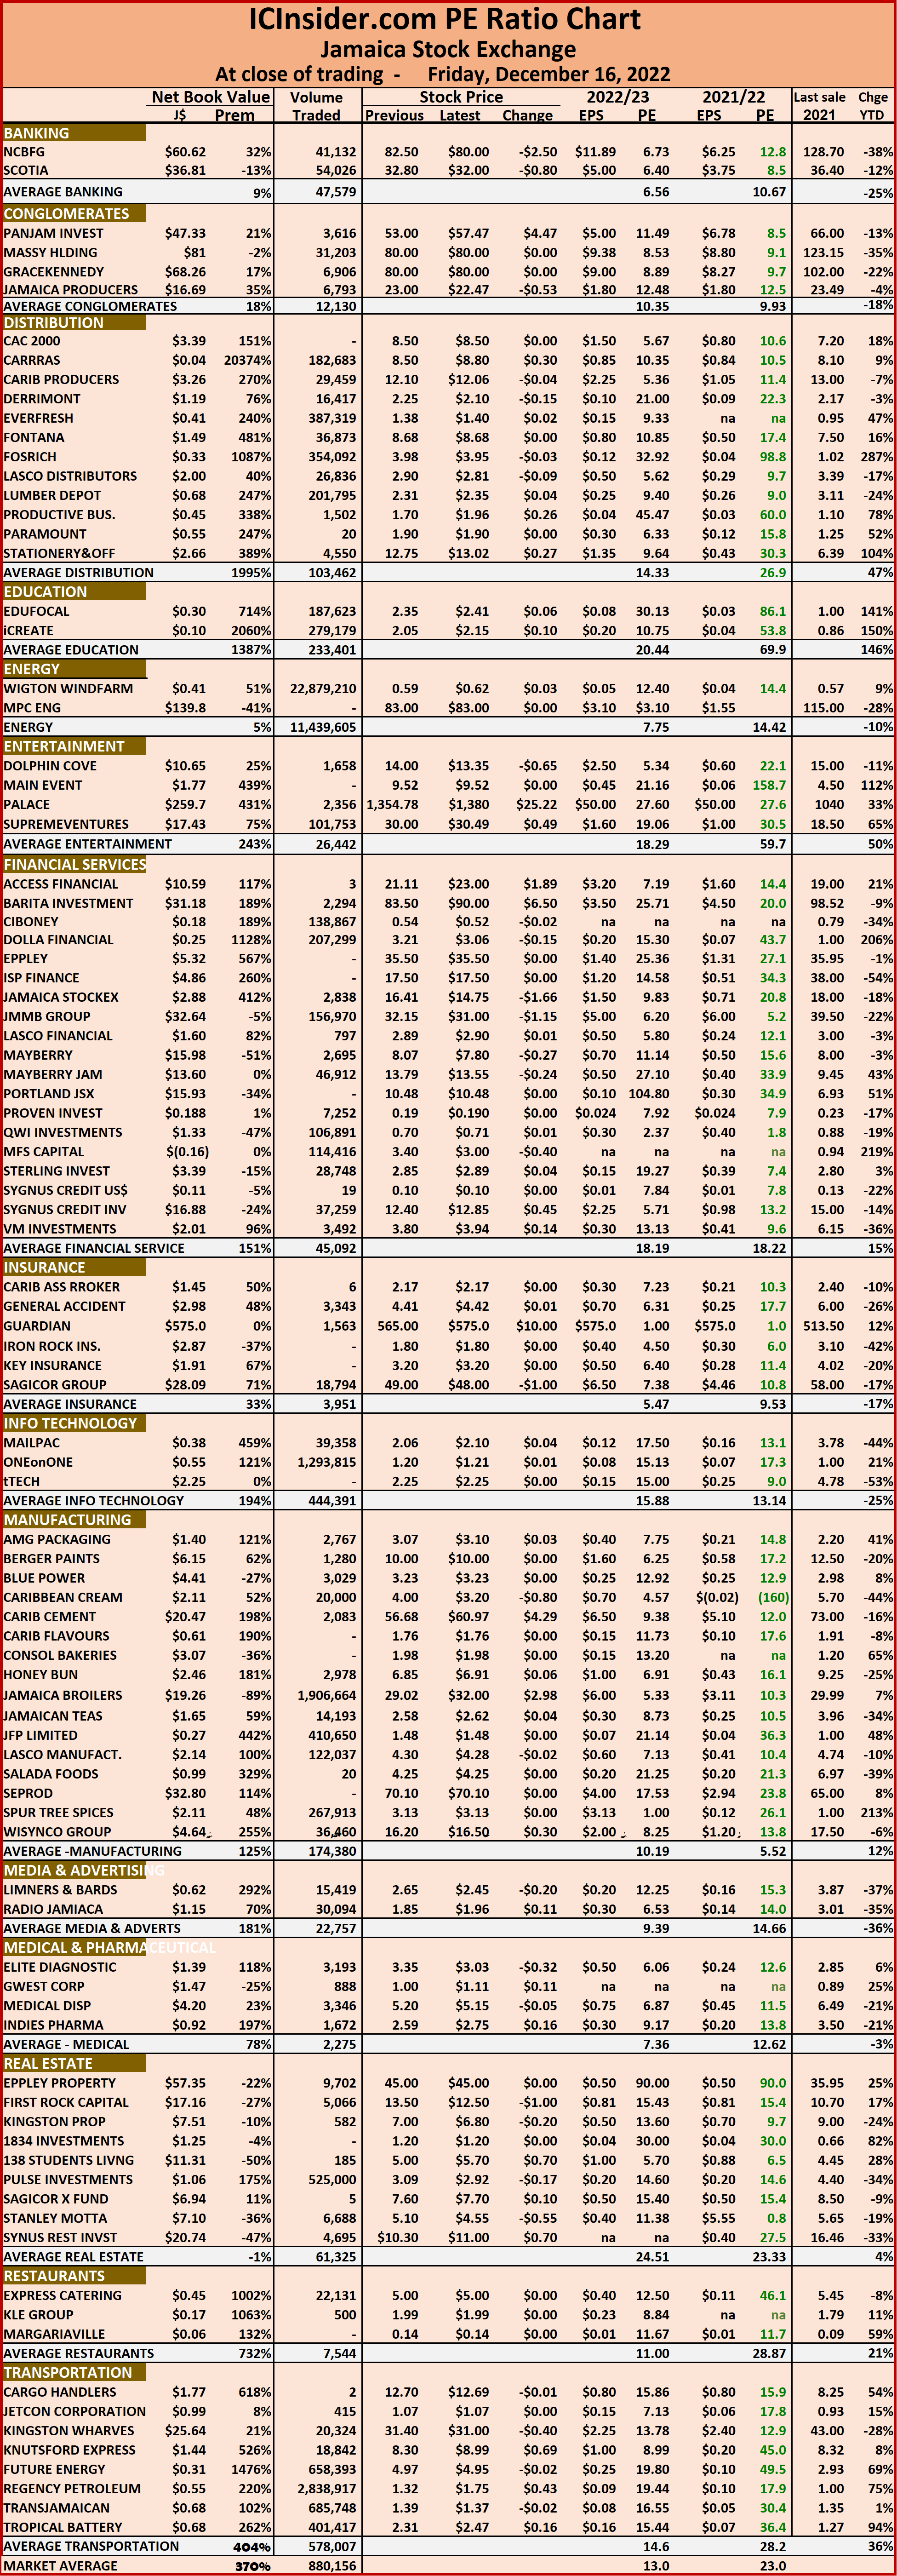 The net asset value of each company is reported as a guide to assess the value of stocks based on this measure quickly. The chart also shows daily changes in stock prices and the percentage year to date price movement based on the last traded prices. Dividends payable and yields for each company are shown in the Main and Junior Markets’ daily report charts that show the closing volume for the bids and offers.
The EPS & PE ratios are based on 2021 and 2022 actual or projected earnings, excluding major one off items. The PE Ratio is the most popular measure used to determine the value of stocks.
Palace more than doubles, Regency gains 32%
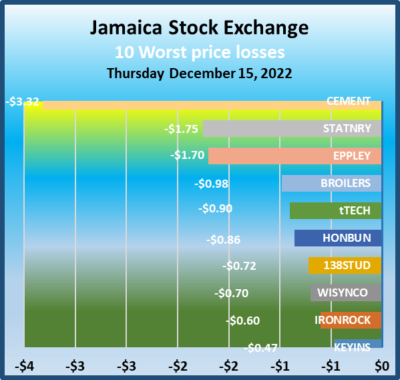
Palace Amusement jumped just over $268 on Thursday to $1,354.75 and has risen 118.5 percent since Monday in response to a proposed stock split. Elsewhere, the recent IPO, Regency Petroleum was listed on the Junior Market and traded at $1.32 for a gain of 32 percent and closed with the bid for 3.6 million shares at 41.32. At the close of the market, the volume and value of stocks traded declined from that on Wednesday.
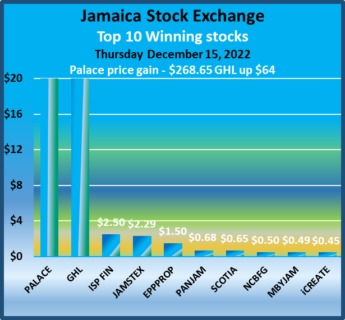 The Main Market of the Jamaica Stock Exchange recorded gains in the market indices but the Junior Market and JSE USD markets dipped at the close.
At the close, the Combined Market Index popped 480.40 points to 352,510.10, the JSE Main Index gained 850.19 points to 339,805.69, the All Jamaica Composite Index rallied 1,068.13 points to 382,174.42, the Junior Market lost 34.08 points to close at 3,869.73 and the JSE US dollar market dipped 0.13 points to 228.96.
Trading ended, with 11,071,300 shares changing hands, for $68.76 million, versus $266.2 million, with 12,607,683 shares traded in all markets on the previous trading day. The JSE USD market ended with the value of stocks traded amounting to US$5,493 from US$5,795 on Tuesday.
 The market’s PE ratio ended at 22.6 based on 2021-22 earnings and 12.8 times those for 2022-23 at the close of trading.
Investors need pertinent information to successfully navigate many investment options in the local stock market. The ICInsider.com PE ratio chart and the more detailed daily report charts provide investors with regularly updated information to help decision-making.
Investors should use the chart to help make rational investment decisions by investing in stocks close to the average for the sector and not going too far from it unless there are compelling reasons to do so. This approach helps to remove emotions from investment decisions and put in on fundamentals while at the same time not being too far from the majority of investors. Investors who buy when the price of a stock is close to the average will find that they are not inclined to overpay for a stock.
The ICInsider.com PE Ratio chart covers all ordinary shares on the Jamaica Stock Exchange. It shows companies grouped on an industry basis, allowing easy comparisons between the same sector companies and the overall market.
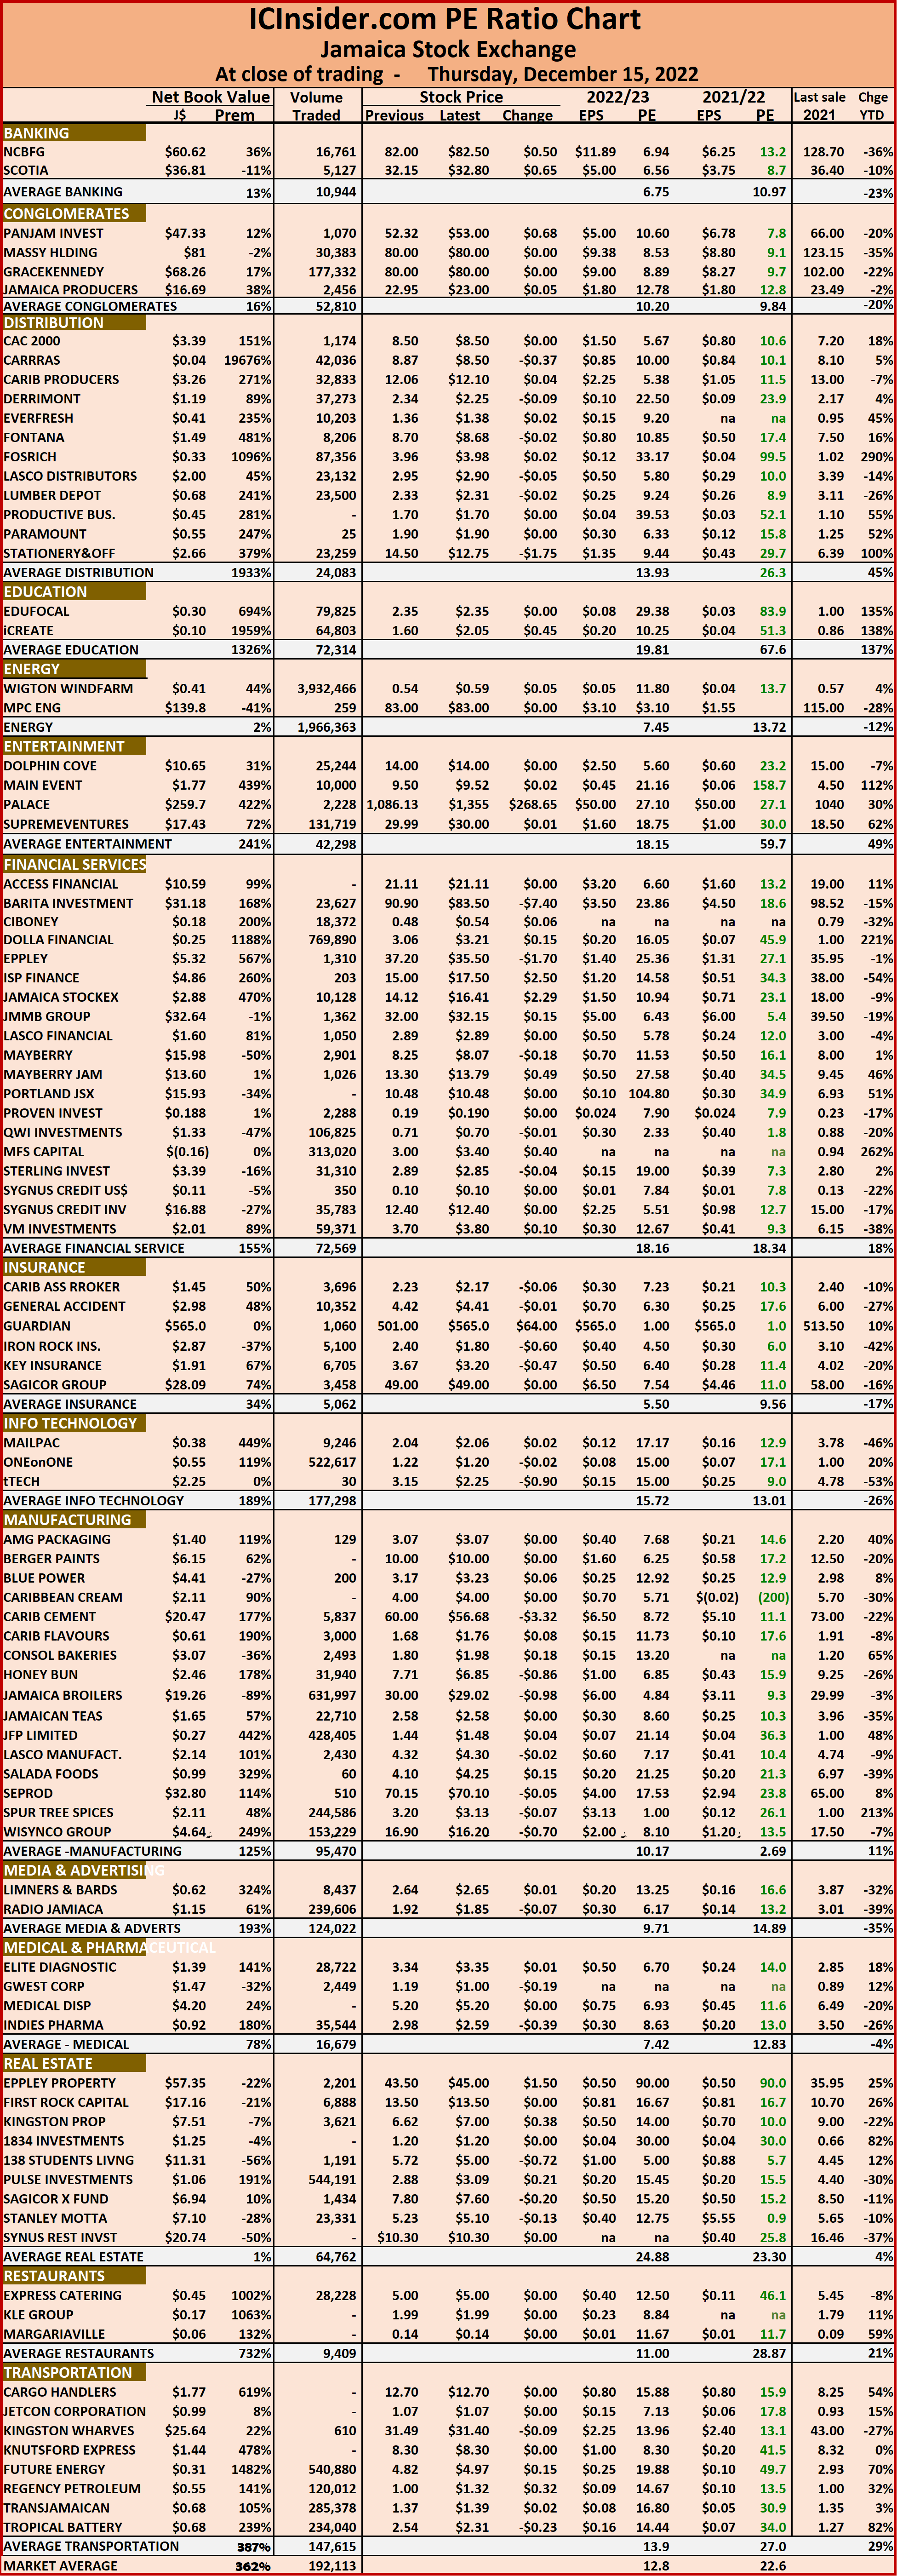 The net asset value of each company is reported as a guide to assess the value of stocks based on this measure quickly. The chart also shows daily changes in stock prices and the percentage year to date price movement based on the last traded prices. Dividends payable and yields for each company are shown in the Main and Junior Markets’ daily report charts that show the closing volume for the bids and offers.
The EPS & PE ratios are based on 2021 and 2022 actual or projected earnings, excluding major one off items. The PE Ratio is the most popular measure used to determine the value of stocks.
Palace gains 75% since split announcement
Jamaica Stock Exchange slipped at the end of trading Wednesday, but the Junior Market rose to recapture nearly all of yesterday’s loss. Palace Amusement jumped just over $264 after rising $201 yesterday in response to a proposed stock split and is up 75 percent since the announcement after trading on Monday. At the close of the market, the volume traded declined from that on Tuesday but the value was marginally higher.
 At the close, the Combined Market Index dropped 315.68 points to 352,029.70, the JSE Main Index declined 957.35 points to 338,955.50, while the All Jamaica Composite Index shed 2,883.94 points to close at 381,106.29, the Junior Market recovered almost all of the more than 72 points decline on Tuesday after jumping 63.42 points to close at 3,903.81 and the JSE US dollar market rose 2.54 points to 228.96.
Trading ended, with 12,607,683 shares changing hands, for $266.2 million, versus $265.5 million, with 17,483,473 shares traded in all markets on the previous trading day. The JSE USD market ended with the value of stocks traded amounting to US$5,493 from US$5,795 on Tuesday.
The market’s PE ratio ended at 22.3 based on 2021-22 earnings and 12.8 times those for 2022-23 at the close of trading.
 Investors need pertinent information to successfully navigate many investment options in the local stock market. The ICInsider.com PE ratio chart and the more detailed daily report charts provide investors with regularly updated information to help decision-making.
Investors should use the chart to help make rational investment decisions by investing in stocks close to the average for the sector and not going too far from it unless there are compelling reasons to do so. This approach helps to remove emotions from investment decisions and put in on fundamentals while at the same time not being too far from the majority of investors. Investors who buy when the price of a stock is close to the average will find that they are not inclined to overpay for a stock.
The ICInsider.com PE Ratio chart covers all ordinary shares on the Jamaica Stock Exchange. It shows companies grouped on an industry basis, allowing easy comparisons between the same sector companies and the overall market.
The net asset value of each company is reported as a guide to assess the value of stocks based on this measure quickly.  The chart also shows daily changes in stock prices and the percentage year to date price movement based on the last traded prices. Dividends payable and yields for each company are shown in the Main and Junior Markets’ daily report charts that show the closing volume for the bids and offers.
The EPS & PE ratios are based on 2021 and 2022 actual or projected earnings, excluding major one off items. The PE Ratio is the most popular measure used to determine the value of stocks.
Main Market squeeze out gains Juniors dive
Jamaica Stock Exchange enjoyed a mild bounce on Tuesday, but the Junior Market plunged sharply having started the day with a mild gain, but a fall in the prices of Lasco Manufacturing from $4.70 to $4, Access Financial and Cargo Handlers at the close pulled the index down. At the close of the market the volume traded declined sharply from that on Monday but the value surged well above Monday’s level.
 At the close, the Combined Market Index dropped 314.64 points to 352,345.38, the JSE Main Index rose 363.48 points to 339,912.85 while the All Jamaica Composite Index popped 97.25 points to 383,990.23, the Junior Market dropped 72.22 points to 3,840.39 and the JSE US dollar market fell 0.06 points to 226.42.
Trading ended, with 17,483,473 shares changing hands, for $265.5 million, versus $160.7 million, with 42,313,310 shares traded in all markets on the previous trading day. The JSE USD market ended with the value of stocks traded amounting to US$5,795 from US$2,560 on Monday.
The market’s PE ratio ended at 22.6 based on 2021-22 earnings and 12.7 times those for 2022-23 at the close of trading.
Investors need pertinent information to successfully navigate many investment options in the local stock market. The ICInsider.com PE ratio chart and the more detailed daily report charts provide investors with regularly updated information to help decision-making.
Investors should use the chart to help make rational investment decisions by investing in stocks close to the average for the sector and not going too far from it unless there are compelling reasons to do so. This approach helps to remove emotions from investment decisions and put in on fundamentals while at the same time not being too far from the majority of investors. Investors who buy when the price of a stock is close to the average will find that they are not inclined to overpay for a stock.
The ICInsider.com PE Ratio chart covers all ordinary shares on the Jamaica Stock Exchange. It shows companies grouped on an industry basis, allowing easy comparisons between the same sector companies and the overall market.
The net asset value of each company is reported as a guide to assess the value of stocks based on this measure quickly. The chart also shows daily changes in stock prices and the percentage year to date price movement based on the last traded prices.  Dividends payable and yields for each company are shown in the Main and Junior Markets’ daily report charts that show the closing volume for the bids and offers.
The EPS & PE ratios are based on 2021 and 2022 actual or projected earnings, excluding major one off items. The PE Ratio is the most popular measure used to determine the value of stocks.